

Abstract
Objective
We studied the effects of LTBP4 and SPP1 polymorphisms on age at loss of ambulation (LoA) in a multiethnic Duchenne muscular dystrophy (DMD) cohort.
Methods
We genotyped SPP1 rs28357094 and LTBP4 haplotype in 283 of 340 participants in the Cooperative International Neuromuscular Research Group Duchenne Natural History Study (CINRG-DNHS). Median ages at LoA were compared by Kaplan–Meier analysis and log-rank test. We controlled polymorphism analyses for concurrent effects of glucocorticoid corticosteroid (GC) treatment (time-varying Cox regression) and for population stratification (multidimensional scaling of genome-wide markers).
Results
Hispanic and South Asian participants (n = 18, 41) lost ambulation 2.7 and 2 years earlier than Caucasian subjects (p = 0.003, <0.001). The TG/GG genotype at SPP1 rs28357094 was associated to 1.2-year-earlier median LoA (p = 0.048). This difference was greater (1.9 years, p = 0.038) in GC-treated participants, whereas no difference was observed in untreated subjects. Cox regression confirmed a significant effect of SPP1 genotype in GC-treated participants (hazard ratio = 1.61, p = 0.016). LTBP4 genotype showed a direction of association with age at LoA as previously reported, but it was not statistically significant. After controlling for population stratification, we confirmed a strong effect of LTBP4 genotype in Caucasians (2.4 years, p = 0.024). Median age at LoA with the protective LTBP4 genotype in this cohort was 15.0 years, 16.0 for those who were treated with GC.
Interpretation
SPP1 rs28357094 acts as a pharmacodynamic biomarker of GC response, and LTBP4 haplotype modifies age at LoA in the CINRG-DNHS cohort. Adjustment for GC treatment and population stratification appears crucial in assessing genetic modifiers in DMD.
Duchenne muscular dystrophy (DMD) is caused by the absence of the protein dystrophin in myofibers, due to truncating dystrophin gene mutations.1 Despite this homogeneous molecular defect, variability in phenotype severity is commonly observed, for example, variable age at loss of ambulation (LoA). This is due to environmental factors, such as implementation of standards of care (glucocorticoid corticosteroid [GC] treatment, physical therapy, management of contractures, fracture prevention),2,3 and to the genetic background. Two genetic modifiers of DMD, that is, common polymorphisms that modulate disease severity combined with a pathogenic mutation, have been described: a single nucleotide polymorphism (SNP) in the promoter of the SPP1 (secreted phosphoprotein 1, or osteopontin) gene, and a coding LTBP4 (latent transforming growth factor β binding protein 4) haplotype. The association of the SPP1 rs28357094 rare G allele with earlier LoA, in a dominant inheritance model, was originally reported in 106 Italian DMD patients.4 SPP1 encodes an inflammatory cytokine involved in tissue damage response, and is part of the transforming growth factor β (TGFβ) pathway.5 The rs28357094 polymorphism alters transcription at baseline6 and in response to steroid hormones.7
The LTBP4 locus was identified by genome-wide mapping in a murine model of muscular dystrophy.8 Subsequently, a LTBP4 haplotype was associated with variable LoA in 254 patients with severe dystrophinopathy (United Dystrophinopathy Project).9 The haplotype consists of 4 coding SNPs in strong linkage disequilibrium (LD), 1 of which, rs10880, was independently associated with age at LoA. Homozygotes for the minor allele T at rs10880 (T1140M), in LD with the haplotype IAAM, showed later LoA. The proposed mechanism is that the IAAM protein isoform results in a more stable latent TGFβ complex, reducing TGFβ signaling. In the same paper, the authors found no association of SPP1 genotype with age at LoA.
Validation of genetic associations in independent cohorts is essential to establish genetic modifiers of Mendelian diseases,10 but may be exaggerated or obscured by confounding variables, such as ancestry-dependent differences in allele frequency and haplotype configuration, which associate with variations of standards of care and other environmental factors, and lead to population stratification.11–13 Disparities in diagnostics,14 standards of care,15 and phenotype severity16,17 between DMD patients of different ethnic backgrounds have been reported. The Cooperative International Neuromuscular Research Group Duchenne Natural History Study (CINRG-DNHS)18 comprises participants from 20 centers on 4 continents, constituting an ethnically diverse cohort.
We have expanded analysis of the CINRG-DNHS cohort, from the baseline cross-sectional analysis of grip strength in 156 participants4 to a longitudinal study (average follow-up 4 years) of all 340 participants.18,19 Here we sought to test the effect of SPP1 and LTBP4 genotypes on LoA in the CINRG-DNHS population, controlling for GC treatment and population stratification. After controlling for these confounding factors, we find an association of both loci with LoA.
Subjects and Methods
The institutional review board or ethics review board at each participating institution approved the study protocol, and consent and assent documents. Informed consent/assent was obtained for each participant prior to conducting study procedures.
Inclusion and Exclusion Criteria
The inclusion and exclusion criteria for the CINRG-DNHS have been previously described.18,19 Recruitment was aimed at obtaining a population representing an age span from very young to adult (age 2–28 years at baseline). Conversely, recruitment was not specifically aimed at obtaining subpopulations with homogeneous ancestry for genetic association analysis. For all analyses focused on SPP1 and LTBP4 genotypes, we excluded patients with no available genomic DNA for SNP genotyping.
LoA and GC Treatment Definitions
LoA was defined as patient-reported continuous wheelchair use, verified by inability to walk 10m unassisted. GC treatment history was recorded both retrospectively at baseline, and longitudinally during the study, and the population was dichotomized into treated at least 1 year with GCs before LoA, and untreated or treated <1 year before LoA. This included patients who had gone on and off GC treatment 1 or more times, but were cumulatively treated for at least 1 year before LoA. The 1-year treatment threshold was chosen based on the clinical rationale that a long-term effect of GC treatment, such as delaying disease milestones, cannot be reasonably expected from short-term treatment. Data were also reanalyzed with a 6-month treatment threshold, as in Flanigan et al,9 to compare LTBP4 data with the same methodology as the original report of this modifier.
Race and Ethnicity Definitions
Self-identification of participants into 1 of the following racial categories was recorded: African American, Asian, Caucasian, Mixed, or Other; self-identification into non-Hispanic or Hispanic ethnicity was specified as a separate option, according to official US Census categories (http://www.whitehouse.gov/omb/fedreg_1997standards/). Here, we clustered this information into the following groups: African American, Asian, non-Hispanic Caucasian, Hispanic Caucasian, Hispanic (ie, participants self-identifying their ethnicity as Hispanic, and race as Mixed/Other), and Other (ie, participants self-identifying their ethnicity as non-Hispanic, and race as Mixed or Other); and distinguished as South Asian participants recruited at the Study Center in Chennai, India (for these participants, no DNA samples were available because of local regulations that did not allow the shipment of DNA for the purposes of our study).
Targeted Genotyping
Targeted genotyping was carried out by TaqMan allele discrimination assays. For SPP1 rs28357094, a dominant model for the minor allele G was adopted.4 For LTBP4 association studies, we focused mainly on the rs10880 SNP (T1140M), which is in strong LD with the IAAM haplotype, and showed an independent association with LoA in the original report, in a recessive model.9 Focusing initially on a single significant SNP allowed inclusion of larger numbers of participants in the analyses. To confirm association with the full haplotype in carriers of the rs10880 T allele, we genotyped rs2303729 (V194I), rs1131620 (T787A), and rs1051303 (T820A). LTBP4 haplotypes were phased with PLINK,20 and median ages at LoA were calculated for all observed haplotype configurations, in all those patients for whom haplotypes could be phased with at least 90% probability.
Multidimensional Scaling Analysis
Genotype data from the Illumina (San Diego, CA) HumanExome Chip was available for 175 participants. These were not selected by ethnicity, nor any phenotype-related data points, but solely on the base of available DNA quantity and quality. Although mainly focusing on coding regions, the chip contains ancestry markers and other common variant markers (∼30,000) that ensure sufficient genome-wide coverage for multidimensional scaling (MDS) analysis. Chip design information is publicly available at http://genome.sph.umich.edu/wiki/Exome_Chip_Design#Illumina_Exome_Arrays. Genotypes were called from raw intensity data with Genome Studio software, and data was exported into PLINK format with the dedicated plug-in software by Illumina. PLINK was used for data cleaning and MDS analysis.20 Subjects with >10% missed calls and SNPs with >5% missed calls were removed to ensure data quality.21 MDS analysis was based on the calculation of genome-wide identity-by-state pairwise distances, on a set of “pruned” genome-wide markers in no significant LD with each other, using the PLINK whole genome association analysis toolset.20 LD-based pruning parameters were the following: 50-SNP window size, 5-SNP window slide at each step, variance inflation factor threshold = 2. The 2 highest ranking principal components were plotted.
Grouping Criteria for Analyses of Race/Ethnicity Differences in GC Treatment and LoA
Median LoA and GC treatment rates were calculated in participants with different self-identified race/ethnicities in the whole DNHS cohort of 340 patients, grouped as defined above.
Grouping Criteria for Analyses of SNP Effect on LoA
SNP effects on LoA were analyzed in the whole cohort with available genomic DNA for genotyping, and in a subcohort of participants of Caucasian ancestry, identified by MDS analysis. In both cohorts, analyses were carried out in 3 groupings based on GC treatment: all participants regardless of treatment; GC-treated participants (at least 1 year while ambulatory as defined above); GC-untreated participants (including those treated <1 year while ambulatory, as defined above). Data were also reanalyzed with a 6-month GC treatment threshold, as explained above.
A flow diagram of participant grouping, with corresponding planned analyses, participant numbers, and GC treatment rates, is shown in Figure 1.
Figure 1.
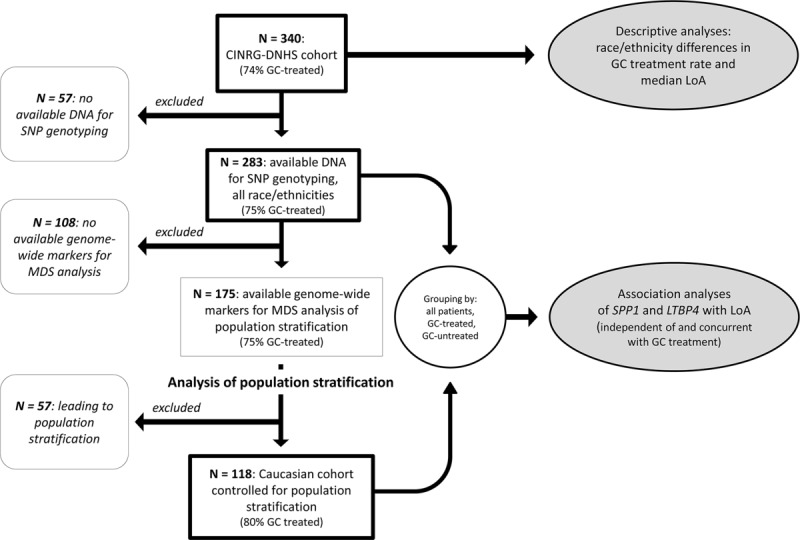
Flow diagram of analysis plan and population grouping. Subgroups included in different analyses are shown, starting from the top with the whole Duchenne Natural History Study (DNHS) cohort, and in subsequent steps excluding patients with no available DNA for genotyping; subjects with no available genome-wide markers for multidimensional scaling analysis for population stratification; and subjects leading to population stratification. Thick-border boxes indicate groups selected for specific analyses. CINRG = Cooperative International Neuromuscular Research Group; GC = glucocorticoid corticosteroid; LoA = loss of ambulation; MDS = multidimensional scaling; SNP = single nucleotide polymorphism.
Statistical Methods
Rates of GC treatment between self-identified racial and ethnic subgroups were compared by chi-square test. Loss of ambulation was studied in a time to event model with age as the time variable, and LoA as the failure event. Ambulatory participants were censored at the age of last follow-up. Median ages at LoA in race/ethnicity and genotype subgroups were based on the empiric survival curve from a Kaplan–Meier (KM) curve calculation, and compared by log-rank test. For SPP1 and LTBP4 genotypes, patients were grouped based on inheritance models specified above. Additionally, concurrent effects of GC treatment and SNP genotype were analyzed in a Cox regression model, with a time-varying GC treatment covariate (on/off treatment defined for all participants at the time of each event). Statistical significance was set at p < 0.05. Genomics Suite 6.6 (Partek, St Louis, MO) and Stata v13 (StataCorp, College Station, TX) were used for statistical analyses.
Results
Distribution by Race/Ethnicity and GC Treatment
Self-identified race/ethnicity in the 340 participants enrolled in the CINRG-DNHS was distributed as follows: 225 (66%) Caucasian, 23 (7%) Hispanic-Caucasian, 41 (12%) South Asian, 18 (5%) Hispanic, 14 (4%) Asian, 6 (2%) African American, and 13 (4%) Other. Of note, the South Asian group was the only one entirely referring to a single study center (Chennai, India).
GC treatment was administered for at least 1 year before LoA to 252 of 340 participants (74%). There were differences in the proportion of participants treated for at least 1 year with GCs between self-identified racial–ethnic subgroups. Overall, participants self-identifying as Caucasian (both Hispanic and non-Hispanic ethnicity) were more often treated for at least 1 year than other participants: 191 of 248 (77%) versus 61 of 92 (65%), chi-square p = 0.045 (Table1). This comparison might be biased by different proportions of younger, ambulatory GC-naive participants, as opposed to nonambulatory participants who did not receive treatment before LoA. When analyzing nonambulatory participants only, we found a trend in the same direction; nonambulatory Caucasians treated at least 1 year while ambulatory were 113 of 162 (70%) versus other ethnicities 39 of 67 (58%, chi-square p = 0.09, see Table1).
Table 1.
Number and Percentage of Participants Treated with Glucocorticoid Corticosteroids at Least 1 Year While Ambulatory, Grouped by Self-Identified Race and Ethnicity
| Self-Identified Race and Ethnicity | All Participants | Nonambulatory | Ambulatory | |||
|---|---|---|---|---|---|---|
| African American | 2/6 | (33%) | 0/4 | (0%) | 2/2 | (100%) |
| Asian | 9/14 | (64%) | 8/13 | (62%) | 1/1 | (100%) |
| Caucasian | ||||||
| Non-Hispanic | 173/225 | (77%) | 102/146 | (70%) | 71/79 | (90%) |
| Hispanic | 18/23 | (78%) | 11/16 | (69%) | 7/7 | (100%) |
| Hispanic | 8/18 | (44%) | 6/16 | (37%) | 2/2 | (100%) |
| Other | 12/13 | (92%) | 5/6 | (83%) | 7/7 | (100%) |
| South Asian | 30/41 | (73%) | 20/28 | (71%) | 10/13 | (77%) |
| Overall | 251/340 | (74%) | 151/229 | (66%) | 100/111 | (90%) |
Age at LoA and GC Treatment Show Differences between Self-Reported Ethnic Subgroups
Median age at LoA was 12.4 years in the non-Hispanic Caucasian population (n = 225). Compared to this numerically predominant group, median age at LoA was significantly earlier in the Hispanic (n = 18, 9.7 years, log-rank p = 0.003) and South Asian (n = 41, 10.4 years, p < 0.001) subpopulations. Median LoA was earlier in the Asian subpopulation (n = 14, 11.3 years), and later in Hispanic-Caucasian (n = 23, 13.0 years) and African American subpopulations (n = 6, 14.2), but differences with non-Hispanic Caucasians were not statistically significant.
Genotyping Results
Genomic DNA samples for targeted genotyping were available for 283 of 340 participants. The 57 patients excluded because of unavailability of DNA samples comprised all 41 patients followed at the study center in Chennai, India, as regulatory authorities did not allow participation in this part of the study.
Minor allele frequencies (MAFs) for SPP1 rs28357094 and LTBP4 rs10880 in the CINRG-DNHS population, broken down by ethnic subgroups, are shown in Table2, compared to MAFs in continental reference populations from the 1000 Genomes project (http://www.1000genomes.org/). For both SNPs, the MAF in the numerically preponderant Caucasian population was slightly lower than in the 1000 Genomes reference EUR population (0.18 vs 0.24 for SPP1 rs2835704, and 0.36 vs 0.41 for LTBP4 rs10880).
Table 2.
MAFs for SPP1 rs28357094 and LTBP4 rs10880 Compared to 1000G MAFs
| Population |
SPP1 rs28357094 |
LTBP4 rs10880 |
||
|---|---|---|---|---|
| DNHS | 1000G | DNHS | 1000G | |
| African American, n = 6 | 0.10 | 0.04 (AFR) | 0.30 | 0.51 (AFR) |
| Asian, n = 14 | 0.08 | 0.00 (ASN) | 0.31 | 0.29 (ASN) |
| non-Hispanic Caucasian, n = 225 | 0.18 | 0.24 (EUR) | 0.36 | 0.41 (EUR) |
| Hispanic Caucasian, n = 23 | 0.11 | 0.24 (EUR) | 0.34 | 0.41 (EUR) |
| Hispanic, n = 18 | 0.18 | 0.14 (AMR) | 0.31 | 0.27 (AMR) |
| Other, n = 13 | 0.13 | 0.12 | 0.31 | 0.38 |
| Overall | 0.17 | 0.12 | 0.35 | 0.38 |
MAFs for 1000G refer to a continental reference population (in parentheses), or to the whole project if not otherwise specified.
1000G = 1000 Genomes project; DNHS = Duchenne Natural History Study; MAF = minor allele frequency.
For SPP1 rs28357094, MAFs in Asian and Hispanic populations were higher than reference. These findings might be suggestive of population admixture. Both SNPs were in Hardy–Weinberg equilibrium (HWE).
LTBP4 haplotypes could be phased with 90% probability in 242 participants, including 28 of 32 TT homozygotes for LTBP4 rs10880. Of these, 24 of 28 were homozygotes for the full IAAM haplotype based on rs2303729, rs1131620, and 1051303 genotypes, whereas 4 of 28 participants were heterozygotes for other rare haplotypes (VAAM or VTTM). Haplotype distributions in different ethnic subgroups, along with median age at LoA calculated for all observed haplotype configurations (with standard errors [SEs] and 95% confidence intervals), are shown in detail in Supplementary Table1. All SNPs in the LTBP4 haplotype were in HWE.
Association Analyses in the Whole Genotyped Cohort: Effect of SPP1 on LoA Is GC Treatment–Dependent in the DNHS Population
Analyses relative to SPP1 and LTBP4 genotypes were limited to 283 patients with available genomic DNA samples (see Fig 1). Of these, 279 (because of limited availability of genomic DNA for a few participants) were successfully genotyped for SPP1 rs28357094. Median ages at LoA for genotype groups and results of log-rank and Cox regression analyses are summarized in Table3. Median ages at LoA were 11.8 years in 84 participants carrying the minor allele (TG/GG), and 13.0 years in 195 participants carrying the TT genotype (log-rank p = 0.048, Fig 2A). This closely reproduces the methodology of the previously reported association of rs28357094 genotype with LoA in 106 Italian patients,4 representing an independent validation of association with this phenotype. In the Cox regression model with GC treatment as time-varying covariate, the hazard ratio (HR) ± SE for TG/GG genotype was 1.22 ± 0.20 (p = nonsignificant [n.s.]). The HR for GC treatment was 0.41 ± 0.07 (p < 0.001).
Table 3.
KM and Cox Regression Models for LoA: Median Age at LoA, Log-Rank p-Values, Cox Hazard Ratios, and p-Values by SPP1-LTBP4 Genotypes and GC Treatment
| Cohort | All Participants |
GC Treated |
GC Untreated |
||||||||
|---|---|---|---|---|---|---|---|---|---|---|---|
| No. | Median Age at LoA, yr | p, KM Log-Rank | HR (95% CI), Cox p | No. | Median Age at LoA, yr | p, KM Log-Rank | HR (95% CI), Cox p | No. | Median Age at LoA, yr | p, KM Log-Rank | |
| Whole genotyped DNHS cohort, n = 283a | |||||||||||
| SPP1 rs28357094 | 0.048b | 1.22 (0.89–1.68), 0.22 | 0.032b | 1.61 (1.09-2.37), 0.016b | 0.6 | ||||||
| TT | 195 | 13.0 | 150 | 13.9 | 45 | 10.0 | |||||
| TG/GG | 84 | 11.8 | 63 | 12.0 | 21 | 10.0 | |||||
| LTBP4 rs10880 | 0.20 | 0.78 (0.49–1.24), 0.29 | 0.27 | 0.74 (0.44-1.26), 0.27 | — | ||||||
| CC/CT | 242 | 12.0 | 178 | 13.3 | 64 | 10 | |||||
| TT | 32 | 13.9 | 27 | 13.9 | 5 | 9.1 | |||||
| Caucasian cohort, controlled for population stratification by MDS, n = 118a | |||||||||||
| SPP1 rs28357094 | 0.047b | 1.54 (0.93–2.54), 0.09 | 0.07 | 1.85 (1.01–3.38), 0.047b | 0.7 | ||||||
| TT | 81 | 13.9 | 67 | 13.9 | 14 | 10.0 | |||||
| TG/GG | 35 | 12.0 | 26 | 12.0 | 9 | 9.0 | |||||
| LTBP4 rs10880 | 0.024b | 0.49 (0.23–1.07), 0.07 | 0.046b | 0.47 (0.20–1.09), 0.08 | — | ||||||
| CC/CT | 103 | 12.6 | 80 | 13.8 | 23 | 10 | |||||
| TT | 12 | 15.0 | 11 | 16.0 | 1 | N/A | |||||
Total number may not correspond exactly to genotype group number because of a few ungenotyped patients (limited DNA availability).
Statistically significant effect of genotype on LoA.
CI = confidence interval; DNHS = Duchenne Natural History Study; GC = glucocorticoid corticosteroid; GC treated = GC treatment at least 1 year while patient was ambulatory; GC untreated = no or <1 year of GC treatment while patient was ambulatory; HR = hazard ratio for genotype in Cox regression model with GC treatment as a time-varying covariate; KM = Kaplan–Meier survival analysis with log-rank comparison of median age at LoA; LoA = loss of ambulation; MDS = multidimensional scaling; N/A = not available.
Figure 2.

Kaplan–Meier plots of age at loss of ambulation grouped by SPP1 rs28357094 genotype. (A) All patients genotyped for SPP1 rs28357094, including all races and ethnicities (n = 279), grouped 2 ways by rs28357094 genotype (black line = TT; gray line = TG/GG). (B) All patients genotyped for SPP1 rs28357094, including all races and ethnicities (n = 279), grouped 4 ways by rs28357094 genotype (black lines = TT; gray lines = TG/GG) and GC treatment (continuous lines = at least 1 year while ambulatory; dashed lines = <1 year or untreated). (C) Caucasian cohort controlled for population stratification and genotyped for SPP1 rs28357094 (n = 116), grouped 2 ways by rs28357094 genotype (black line = TT; gray line = TG/GG). (D) Caucasian cohort controlled for population stratification and genotyped for SPP1 rs28357094 (n = 116), grouped 4 ways by rs28357094 genotype (black lines = TT; gray lines = TG/GG) and GC treatment (continuous lines = at least 1 year while ambulatory; dashed lines = <1 year or untreated).
In 274 participants genotyped for LTBP4 rs10880, median ages at LoA were 12.0 years in 242 participants with the CC/CT genotype, and 13.9 years in 32 homozygotes for the minor allele T (log-rank p = 0.20, Fig 3A). In the Cox regression model with GC treatment as time-varying covariate, HR for the TT genotype was 0.78 ± 0.18 (p = n.s.). The HR for GC treatment was 0.39 ± 0.06 (p < 0.001). In this and the following analyses, participant numbers for the 2 genotyped SNPs differ slightly, because of limited availability of genomic DNA for a few participants.
Figure 3.

Kaplan–Meier plots of age at loss of ambulation grouped by LTBP4 rs10880 genotype. (A) All patients genotyped for LTBP4 rs10880, including all races and ethnicities (n = 274), grouped 2 ways by rs10880 genotype (black line = TT; gray line = CC/CT). (B) All patients genotyped for LTBP4 rs10880, including all races and ethnicities (n = 274), grouped 4 ways by rs10880 genotype (black line = TT; gray line = CC/CT) and GC treatment (continuous lines = at least 1 year while ambulatory; dashed lines = <1 year or untreated). (C) Caucasian cohort controlled for population stratification and genotyped for LTBP4 rs10880 (n = 115), grouped 2 ways by rs10880 genotype (black line = TT; gray line = CC/CT). (D) Caucasian cohort controlled for population stratification and genotyped for LTBP4 rs10880 (n = 115), grouped 4 ways by rs10880 genotype (black line = TT; gray line = CC/CTy) and GC treatment (continuous lines = at least 1 year while ambulatory; dashed lines = <1 year or untreated).
These data show directions of association as previously reported (SPP1 TG/GG genotype: earlier age at LoA; LTBP4 TT genotype: later age at LoA). SPP1 was statistically significant in the log-rank comparison of median LoA, but not in the GC treatment–adjusted Cox model, whereas LTBP4 did not reach statistical significance. Findings for LTBP4 were similar for 24 of 32 rs10880 TT homozygotes carrying the whole IAAM/IAAM haplotype (data not shown).
When grouping only GC-treated participants (at least 1 year of treatment while ambulatory), we observed a 1.9-year difference in median LoA between SPP1 rs28357094 genotypes; median ages at LoA were 12.0 and 13.9 years for n = 63 GG/GT and n = 150 TT, respectively (log-rank p = 0.032, see Fig 2B). In the Cox regression model with GC treatment as time-varying covariate, the HR for TG/GG genotype was 1.61 ± 0.32 (p = 0.016). The HR for GC treatment was 1.30 ± 0.49 (p = n.s.). Median ages at LoA were identical (10.0 years) for untreated participants with different SPP1 genotypes (n = 21 and 45, respectively, see Fig 2B). This suggests that the SPP1 locus may be a pharmacodynamic marker for GC response, rather than directly modifying DMD severity.
As for the LTBP4 rs10880 genotype, median ages at LoA in GC-treated participants were 13.3 and 13.9 years for the CC/CT and TT genotype, n = 178 and 27, respectively (log-rank p = n.s., see Fig 3B). In the Cox regression model with GC treatment as time-varying covariate, the HR for the TT genotype was 0.74 ± 0.20 (p = n.s.). The HR for GC treatment was 1.08 ± 0.40 (p = n.s.). The number of untreated participants with the rare recessive genotype was too small for a meaningful comparison (n = 64 and 5, see Fig 3B).
MDS Analysis Shows Admixture and Population Stratification
MDS analysis was based on the calculation of identity-by-state pairwise distances, performed on 175 participants with available genome-wide markers. Compared to 108 patients excluded from this analysis because of unavailability of genome-wide markers (DNA quantity and quality not sufficient for SNP chip analysis), there were no significant differences in GC treatment rate (75.0% vs 76.5%) or median age at LoA (13.0 vs 12.0 years, log-rank p = 0.12, Supplementary Fig).
MDS analysis identified a first principal component with lower values for participants of European ancestry. This component is plotted on the x-axis in Figure 4. The y-axis represents the second principal component. On the left side of the plot (low values of first principal component), 118 participants self-identifying mostly as non-Hispanic Caucasian (n = 115), and rarely as Hispanic-Caucasians (n = 2) or Other (n = 1), are clustered closely together, indicating a subcohort of relatively homogeneous European ancestry. Of the remaining 57 patients with higher values of the first component, 12 self-identified as non-Hispanic Caucasian, appearing as “outliers” on the right side of the plot, and indicating admixture and population stratification within self-identified Caucasian participants.
Figure 4.
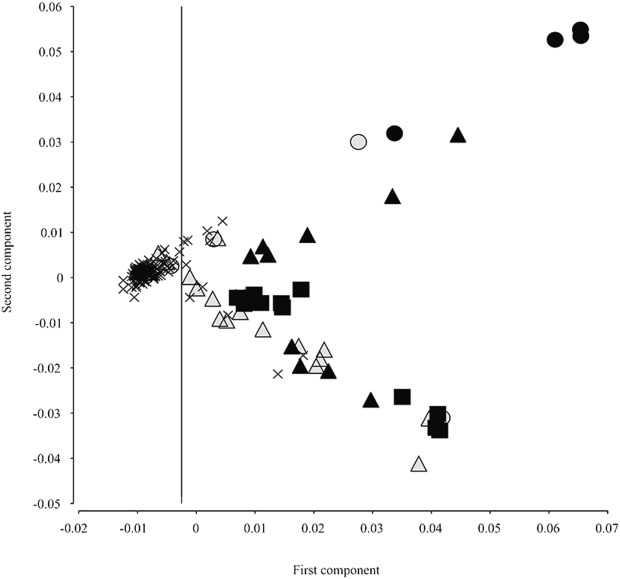
Cartesian plot of multidimensional scaling analysis of genome-wide marker population stratification. Values of the 2 highest ranking components are shown (1st on the x-axis and 2nd on the y-axis). Shape and color of the markers indicate self-identified ethnicity. Participants self-identifying as non-Hispanic Caucasian, indicated by x-shaped markers, form a cluster with low values of the first component (< −0.0025, vertical cutoff line). Forty-five participants with other self-identified races and ethnicities are mostly positioned right of the cutoff line: African American (filled circles), Asian (filled squares), Hispanic Caucasian (empty triangles), Hispanic (filled triangles), and Other (empty circles). Twelve participants self-identifying as non-Hispanic Caucasians appear as outliers, whereas 3 participants self-identifying as Hispanic Caucasian or Other cluster together with non-Hispanic Caucasians and are included in subsequent analyses.
Association Analyses in the Caucasian Cohort Controlled for Population Stratification Lead to Validation of Both SPP1 and LTBP4 Association with Age of LoA
As MDS analysis showed population stratification within self-identified racial–ethnic groups, to adjust for population-related confounding factors in genetic association, we restricted subsequent analyses to 118 patients showing no evident population stratification (see Fig 1). Of these, 116 were successfully genotyped for SPP1 rs28357094. Median ages at LoA were 12.0 and 13.9 years, n = 35 and 81 for TG/GG and TT, respectively (log rank p = 0.047, see Fig 2C). In the Cox regression model with GC treatment as time-varying covariate, the HR for TG/GG genotype was 1.54 ± 0.17 (p = 0.09), and the HR for GC treatment was 0.26 ± 0.07 (p < 0.001).
Of the participants described above, 93 were treated with GC for at least 1 year while ambulatory. For these patients, KM median ages at LoA were 12.0 and 13.9 years for TG/GG and TT genotypes, n = 26 and 67 (log-rank p = 0.07, see Fig 2D). When applying the Cox regression model with GC treatment as time-varying covariate, HR for TG/GG genotype was 1.85 ± 0.57 (p = 0.047). The HR for GC treatment was 0.72 ± 0.39 (p = n.s.). In 23 GC-untreated patients, KM median ages at LoA were 9.0 and 10.0 years for TG/GG and TT (n = 9 and 14, respectively, p = n.s., see Fig 2D).
Of 118 participants in the Caucasian cohort controlled for population stratification, 115 were genotyped for LTBP4 rs10880. KM curves plotted for this group showed delayed median LoA (15.0 years) in 12 participants carrying the TT genotype, in contrast to 103 carrying the CC/CT genotype (12.6 years, log-rank p = 0.024, see Fig 3C). Of these 12 participants, 9 were homozygotes for the full IAAM haplotype, whereas 3 were heterozygotes for IAAM and other rare LTBP4 haplotypes (VAAM and VTTM). In the Cox regression model with GC treatment as time-varying covariate, HR for TT genotype was 0.49 ± 0.19 (p = 0.07). The HR for GC treatment was 0.26 ± 0.07 (p < 0.001).
Of the participants described in the previous paragraph, 91 were GC treated for at least 1 year before LoA. Within this group, KM median age at LoA was 16.0 years for TT genotype and 13.8 for CC/CT, n = 11 and 80 (log-rank p-value = 0.046, see Fig 3D). The Cox regression model with GC treatment as time-varying covariate showed an HR for TT genotype of 0.47 ± 0.20 (p = 0.08). The HR for GC treatment was 0.75 ± 0.40 (p = n.s.). The presence of just 1 GC-untreated participant with rs10880 TT genotype precludes statistical analysis of GC-untreated participants for LTBP4 in this subgroup.
Taken together, these findings support the protective effect of the rs10880 TT genotype described by Flanigan et al.9 This was confirmed by reanalyzing CINRG-DNHS data with the 6-month GC treatment threshold used in the original report. All KM and Cox regression parameters for this reanalysis are shown in Supplementary Table2.
Discussion
We aimed to study the effect of 2 genetic modifiers on DMD phenotype, using age at LoA as a disease severity indicator, in the CINRG-DNHS cohort. This cohort includes 340 participants followed longitudinally for an average of 4 years, and the study design and baseline data have been recently reported.18,19 We grouped participants by genotype at 2 loci associated with age at LoA in DMD (SPP1 rs283570944 and LTBP4 haplotype9). We had previously reported a cross-sectional analysis of grip strength as a function of SPP1 genotype in a subset of this cohort (n = 156), not stratified for ethnicity. Here, we report time to event analyses for age at LoA in the complete CINRG-DNHS cohort (except 57 participants with unavailable DNA samples) for both the SPP1 and LTBP4 loci, controlling for population stratification and GC treatment as possible confounders.
It is well established that different ethnic groups show different MAFs for any specific genetic polymorphism, as well as different LD between genetic markers and functional variants. This can lead to hidden population stratification even within self-identified racial/ethnic groups, and thus to false-positive or false-negative findings in genetic association. The CINRG-DNHS cohort recruited participants from 20 clinical centers in 4 different continents, and is ethnically heterogeneous, although with a majority of Caucasian participants. Both previous reports14,15,17 and observed tendencies of the phenotype to differ between ethnic groups in our data further stress the importance of accounting for population stratification issues. Conversely, because of inherent study design characteristics of the CINRG-DNHS, which did not purposely recruit representative racial/ethnic subgroups, conclusive statements cannot be made about racial/ethnic disparities in DMD, based on our data.
The second potential confounding factor, GC treatment, is probably the single environmental factor most heavily affecting age at LoA in DMD.22–25 We accounted for it by implementation in time to event models, as a grouping criterion for KM analyses and a time-varying covariate for Cox regression. Because of CINRG-DNHS population characteristics, that is, a numerical predominance of GC-treated participants, our findings can be generalized more confidently to GC-treated DMD populations. Nevertheless, this is more relevant for patient care and clinical trials, as GC treatment is considered a standard of care,2 and often an inclusion criterion in clinical trials of new treatments.
We first studied SNP effects in the entire cohort with available DNA samples, without grouping for GC treatment or ethnicity. The SPP1 rs28357094 G allele, in a dominant model, was associated with 1.2-year earlier median LoA. This reproduces the methodology of the original report4 and represents an independent validation of association with LoA. The recessive LTBP4 rs10880 T allele, in close LD with the IAAM haplotype, showed a direction of association as previously reported,9 but not a statistically significant difference.
We then grouped participants genotyped for SPP1 and LTBP4 by GC treatment. In our baseline analysis of 156 DNHS participants, the association of SPP1 genotype with grip strength showed the largest effect in GC-treated participants4; and an 80-patient Italian cohort, in which the association was established with longitudinal changes of ambulation-related functional measures,26 was almost entirely GC treated. In line with these previous findings, which suggest a stronger modifier role of SPP1 in GC-treated patients, an effect of SPP1 genotype on LoA in the CINRG-DNHS cohort was observed in the GC-treated subgroup (see Fig 2B). This finding supports a role of SPP1 rs28357094 as a modulator of GC response in DMD, rather than of disease progression itself. This is in concordance with several preclinical studies of SPP1 promoter function; the minor G allele at rs28357094 decreases transcriptional activity of the gene at baseline,6 but shows a 3-fold increase in gene expression in response to steroids, whereas the common allele leaves expression unchanged by steroids.7 Consistent with a steroid-induced alteration of SPP1 expression, differences in SPP1 mRNA levels between genotypes were not found in vivo in DMD diagnostic muscle biopsies obtained prior to GC treatment.27 Evidence of a sexually dimorphic effect of rs28357094 genotype on muscle size and remodeling in Caucasian women,28 and of an increased transcriptional response of the SPP1 promoter to estrogen stimuli,7 are consistent with a pharmacodynamic role of this genetic biomarker. GCs are well-known transcriptional regulators of inflammation-related genes,29 both directly, through positive or negative GC-responsive elements (GREs), and indirectly, through suppression of other transcription factors (eg, NF-κB); and these mechanisms are relevant to GC efficacy and possibly side effects in DMD.30,31 The SPP1 promoter is predicted to contain both GREs and NF-κB–responsive sites, and further studies are needed to dissect these mechanisms both in vitro and in vivo. To our knowledge, this is the first demonstration of a pharmacodynamic biomarker for response to GCs, and this may be relevant to other conditions where GCs are standard of care. Our data, combined with the recent publication of Barfield et al,7 suggest that the 20 to 30% of DMD patients with the rare SPP1 allele are poor responders to GCs, possibly with an altered balance between beneficial and side effects. Future studies are needed to confirm this association, before routine genotyping of SPP1 is considered as part of standard of care in DMD.
Flanigan et al9 described a larger effect of the protective LTBP4 variant in GC-treated patients than in untreated patients. In the CINRG-DNHS cohort, when stratifying by GC treatment and LTBP4 genotype, we did not observe differences in genotype effect between the treated and untreated populations. Reanalyzing data with the same GC treatment threshold (at least 6 months before LoA) as in the original report did not modify these findings (see Supplementary Table2).
To adjust for potential population stratification bias, we performed MDS analysis on a subgroup of 175 participants. This showed that the correspondence between self-identified ethnicity and unbiased grouping determined by genotype identity was partial, with several outlier self-identifying Caucasian participants (admixture). Subsequently, we selected MDS rather than self-identification as a method to adjust for population stratification. A limitation of this study is the unavailability of genome-wide markers in the whole cohort, which would have allowed the selection of a larger homogeneous subcohort. However, the reason for exclusion of 108 patients was technical (DNA sample quality and quantity) and not linked to any clinically relevant variables. Furthermore, we verified that excluded patients did not significantly differ in terms of GC treatment and age at LoA (see Supplementary Fig). Thus, we expect the cohort analyzed by MDS to be representative of the whole CINRG-DNHS.
In the smaller but more homogeneous MDS-selected Caucasian subcohort, LTBP4 rs10880 was confirmed as a strong modifier of ambulatory function in DMD, with a median age at LoA in carriers of the protective genotype of 15.0 years overall, and 16.0 years in those with GC treatment (see Fig 3C–D), which positions >50% of these patients within the “intermediate dystrophinopathy” clinical spectrum. The stronger association of rs10880 in Caucasians did not seem to be in direct relation with a stronger LD with the full IAAM haplotype (see Supplementary Table1), although numbers are too small to reach a conclusion (ie, very few patients with rare haplotypes). It could also be hypothesized that in Caucasians the T allele for rs10880 might be in stronger LD with another unrecognized, functional variant, than in patients with different ancestries. Conversely, Flanigan et al did not find additional nonsynonymous coding variation by resequencing 40 chromosomes and querying the 1000 Genomes database, and conducted in vitro experiments showing an effect of the coding haplotype on TGFβ signaling, in conditions of equal LTBP4 protein expression.9 As for SPP1 rs28357094, the effect on age at LoA in the Caucasian subcohort appears smaller in magnitude than that of the LTBP4 haplotype. This is similar to what was described in the single center cohort from Padua,4 which was recruited from a homogeneous Caucasian population (great majority from northeastern Italy) with a predominance of GC-treated participants.
Recently, another genetic modifier study in DMD was published by a collaborative European group,32 further confirming the effect of the LTBP4 IAAM haplotype in delaying LoA. Conversely, the SPP1 association was not replicated in 336 patients, of whom 102 had been treated with GCs for at least 1 year while ambulatory. If SPP1 is a modifier of GC response, as our association data and in vitro findings suggest, this low GC treatment rate might have limited the power of this part of the study.
Lastly, although the genetic modifiers described here seem to explain some of the variance of the LoA phenotype in DMD, both from our data and from case reports of outlier DMD phenotypes33 it appears that several other, yet uncharacterized genetic factors must be at play.
In conclusion, our findings show that SPP1 rs28357094 acts as a modifier of the long-term effect of GC treatment in the CINRG-DNHS. Furthermore, we confirm that LTBP4 rs10880 modifies age at LoA in DMD. Our data also stress the importance of adjusting for GC treatment and population substructure in genetic association studies in DMD. These findings are relevant for future analyses of observational and interventional studies involving international, multicentric, ethnically diverse cohorts.
Acknowledgments
This project was funded through the Italian Ministry of Education PhD grant awarded to L.B. for the XXVIII Cycle of the Doctorate School of Medical, Clinical, and Experimental Science at the University of Padua, Italy, and grants from the NIH (NICHD #U54HD053177, NICHD #R24HD050846, NCATS #UL1RR031988, NCATS #UL1RR024992, NCATS #U54RR026139, NCATS #G12RR003051, NIAMS #1R01AR061875, NIAMS #R01AR062380), US Department of Education/National Institute on Disability and Rehabilitation Research (#H133B031118, #H133B090001), US Department of Defense (#W81XWH-09-1-0592), and Parent Project Muscular Dystrophy US.
We thank Drs S. F. Nelson and R. T. Wang for generating the exome chip genotype data and the participants and families who have volunteered their time to take part in this project.
The CINRG group includes the following. University of California, Davis: Michelle Cregan, Sarah Humbert, Linda Johnson, Nanette Joyce, Bethany Lipa, Alina Nicorici, Que Nguyen, Divya Reddy. Sundaram Medical Foundation and Apollo Children's Hospital, Chennai: Sivaprakasam Chidambaranathan, R. Mercy Freeda, Christine John, Suresh Kumar, Vidhya Lakshmi, K. Niroshan, Priya Reddappa, Venkata Krishna Reddy, Hilda Solomon, Vidhyalakshmi Vadivel. Holland Bloorview Kids Rehab Hospital: Blythe Dalziel, Melissa Dermody, Laila Eliasoph, Angela Gonzales, Vivien Harris, Elizabeth Hosaki, Gloria Lee. Alberta Children's Hospital: Angela Chiu, Edit Goia, Tiffany Haig, Megan Harris, Natalia Rincon, Karla Sanchez, Jennifer Thannhauser, Lori Walker, Caitlin Wright, Mehrnaz Yousefi. Queen Silvia Children's Hospital: Ann-Christine Alhander, Anna-Berit Ekstrom, Anna-Lena Gustafsson, Anna-Karin Kroksmark, Ulrika Sterky, Lisa Wahlgren. Children's National Medical Center: Marissa Birkmeier, Brittany Drogo, Sally Evans, Sarah Kaminski, Meganne Leach, Bemnete Tadesse. Royal Children's Hospital: Kate Carroll, Katy DeValle, Bronwyn Gelding, Rachel Kennedy, Andrew Kornberg, Victoria Rodriguez-Casero, Dani Villano. Hadassah Hebrew University Hospital: Renana Adani, Adina Bar Leve, Lilach Chen-Joseph, Muhannad Daana, Talia Dor-Wollman, Vera Panteleyev-Yitshak, Itai Shurr, Elana Weisband, Debbie Yaffe. Instituto de Neurosciencias Fundacion Favaloro: Luz Andreone, Fernando Bonaudo, Jose Corderi, Lorena Levi, Patricia Marco, Lilia Mesa. University of Pittsburgh: Hoda Abdel-Hamid, Roxanna Bendixen, Christopher Bise, Ann Craig, Anna Delios, Sarah Hughes, Karen Karnavas, Casey Matthews, Andrea Smith, Jason Weimer. Washington University in St Louis: Julaine Florence, Paul Golumbak, Glenn Lopate, Betsy Malkus, Justin Malone, Alan Pestronk, Renee Renna, Jeanine Schierbecker, Catherine Seiner, Charlie Wulf. Children's Hospital of Virginia: Susan Blair, Barbara Grillo, Karen Jones, Eugenio Monasterio. University of Tennessee, Memphis: Meegan Barrett-Adair, Judy Clifft, Cassandra Feliciano, Masanori Igarashi, Rachel Young. Children's Hospital of Westmead: Kayla Cornett, Ellie Faramus, Clare Miller, Kathryn North, Kristy Rose, Stephanie Wicks. University of Alberta: Lucia Chen, Cameron Kennedy. Mayo Clinic: Krista Coleman-Wood, Sherilyn Driscoll, Ann Hoffman, Nancy Kuntz, Wendy Korn-Petersen, Duygu Selcen. University of Puerto Rico: Brenda Deliz, Sheila Espada, Pura Fuste, Carlos Luciano, Lisa Morales, Irma Ramos, Jessica Torres. University of Pavia: Luca Capone. Niguarda Ca' Granda Hospital: Viviana Baiardi, Maria Beneggi, Christina Grandi, Marco Gualandris, Valentina Morettini. Texas Children's Hospital: Farida Abid, Robert Cruse, Anjali Gupta, Aryn Knight, Beverly Lott, Robert McNeil, Arin Robertson, Angela Wideman, Katy Wilkinson. University of Minnesota: Karen Buser, Joline Dalton, Amy Erickson, Marcia Margolis, Jamie Marsh, Cameron Naughton, Gareth Parry, David Walk. CINRG Coordinating Center: Mohammad Ahmed, Adrienne Arrieta, Naomi Bartley, Paola Canelos, Robert Casper, Jia Feng, Fengming Hu, Zoe Sund, Wenze Tang, Angela Zimmerman. The CINRG website is located at http://www.cinrgresearch.org.
Appendix
Collaborating Authors (CINRG Investigators)
Sundaram Medical Foundation and Apollo Children's Hospital, Chennai, India: V. Vishwanathan, MD; S. Chidambaranathan, MD. Holland Bloorview Kids Rehab Hospital, Toronto, Ontario, Canada: W. Douglas Biggar, MD; Laura McAdam, MD. Alberta Children's Hospital, Calgary, Alberta, Canada: Jean K. Mah, MD. Queen Silvia Children's Hospital, Göteborg, Sweden: Mar Tulinius, MD. Children's National Medical Center, Washington, DC: Robert Leshner, MD; Carolina Tesi-Rocha, MD; Mathula Thangarajh, MD. Royal Children's Hospital, Melbourne, Australia: Andrew Kornberg, MD; Monique Ryan, MD. Hadassah Hebrew University Hospital, Jerusalem, Israel: Yoram Nevo, MD. Instituto de Neurosciencias Fundacion Favaloro, Buenos Aires, Argentina: Alberto Dubrovsky, MD. University of Pittsburgh and Department of Veterans Affairs, Pittsburgh, PA: Paula R. Clemens, MD; Hoda Abdel-Hamid, MD. Washington University in St Louis, St Louis, MO: Anne Connolly, MD; Alan Pestronk, MD. Children's Hospital of Virginia, Richmond, VA: Jean Teasley, MD. University of Tennessee, Memphis, TN: Tulio Bertorini, MD. Children's Hospital of Westmead, Sydney, Australia: Kathryn North, MD; Richard Webster, MD. University of Alberta, Edmonton, Alberta, Canada: Hanna Kolski, MD. Mayo Clinic, Rochester, MN: Nancy Kuntz, MD; Sherilyn Driscoll, MD. University of Puerto Rico, San Juan, Puerto Rico: Jose Carlo, MD. University of Pavia and Niguarda Ca' Granda Hospital, Milan, Italy: Ksenija Gorni, MD. Texas Children's Hospital, Houston, TX: Timothy Lotze, MD. University of Minnesota, Minneapolis, MN: John Day, MD; Peter Karachunski, MD.
Authorship
L.B. and A.K. contributed equally to this work.
Potential Conflicts of Interest
EKH: grant, Parent Project Muscular Dystrophy US; past member, CINRG Executive Committee; consultancy, PTC Therapeutics, Genzyme. E.P.: speaking fee, Genzyme; scientific advisory board, Biomarin. C.M.M.: grant, Parent Project Muscular Dystrophy US.
Additional Supporting Information may be found in the online version of this article.
References
- 1.Hoffman EP, Brown RH, Jr, Kunkel LM. Dystrophin: the protein product of the Duchenne muscular dystrophy locus. Cell. 1987;51:919–928. doi: 10.1016/0092-8674(87)90579-4. [DOI] [PubMed] [Google Scholar]
- 2.Bushby K, Finkel R, Birnkrant DJ. Diagnosis and management of Duchenne muscular dystrophy, part 1: diagnosis, and pharmacological and psychosocial management. Lancet Neurol. 2010;9:77–93. doi: 10.1016/S1474-4422(09)70271-6. [DOI] [PubMed] [Google Scholar]
- 3.Bushby K, Finkel R, Birnkrant DJ. Diagnosis and management of Duchenne muscular dystrophy, part 2: implementation of multidisciplinary care. Lancet Neurol. 2010;9:177–189. doi: 10.1016/S1474-4422(09)70272-8. [DOI] [PubMed] [Google Scholar]
- 4.Pegoraro E, Hoffman EP, Piva L. SPP1 genotype is a determinant of disease severity in Duchenne muscular dystrophy. Neurology. 2011;76:219–226. doi: 10.1212/WNL.0b013e318207afeb. [DOI] [PMC free article] [PubMed] [Google Scholar]
- 5.Ceco E, McNally EM. Modifying muscular dystrophy through transforming growth factor-beta. FEBS J. 2013;280:4198–4209. doi: 10.1111/febs.12266. [DOI] [PMC free article] [PubMed] [Google Scholar]
- 6.Giacopelli F, Marciano R, Pistorio A. Polymorphisms in the osteopontin promoter affect its transcriptional activity. Physiol Genomics. 2004;20:87–96. doi: 10.1152/physiolgenomics.00138.2004. [DOI] [PubMed] [Google Scholar]
- 7.Barfield WL, Uaesoontrachoon K, Wu CS. Eccentric muscle challenge shows osteopontin polymorphism modulation of muscle damage. Hum Mol Genet. 2014;23:4043–4050. doi: 10.1093/hmg/ddu118. [DOI] [PMC free article] [PubMed] [Google Scholar]
- 8.Heydemann A, Ceco E, Lim JE. Latent TGF-beta-binding protein 4 modifies muscular dystrophy in mice. J Clin Invest. 2009;119:3703–3712. doi: 10.1172/JCI39845. [DOI] [PMC free article] [PubMed] [Google Scholar]
- 9.Flanigan KM, Ceco E, Lamar KM. LTBP4 genotype predicts age of ambulatory loss in Duchenne muscular dystrophy. Ann Neurol. 2013;73:481–488. doi: 10.1002/ana.23819. [DOI] [PMC free article] [PubMed] [Google Scholar]
- 10.Nelson SF, Griggs RC. Predicting the severity of Duchenne muscular dystrophy: implications for treatment. Neurology. 2011;76:208–209. doi: 10.1212/WNL.0b013e3182074c0e. [DOI] [PubMed] [Google Scholar]
- 11.Enoch MA, Shen PH, Xu K. Using ancestry-informative markers to define populations and detect population stratification. J Psychopharmacol. 2006;20(4 suppl):19–26. doi: 10.1177/1359786806066041. [DOI] [PubMed] [Google Scholar]
- 12.Tian C, Gregersen PK, Seldin MF. Accounting for ancestry: population substructure and genome-wide association studies. Hum Mol Genet. 2008;17:R143–R150. doi: 10.1093/hmg/ddn268. [DOI] [PMC free article] [PubMed] [Google Scholar]
- 13.Genin E, Feingold J, Clerget-Darpoux F. Identifying modifier genes of monogenic disease: strategies and difficulties. Hum Genet. 2008;124:357–368. doi: 10.1007/s00439-008-0560-2. [DOI] [PMC free article] [PubMed] [Google Scholar]
- 14.Holtzer C, Meaney FJ, Andrews J. Disparities in the diagnostic process of Duchenne and Becker muscular dystrophy. Genet Med. 2011;13:942–947. doi: 10.1097/GIM.0b013e31822623f1. [DOI] [PubMed] [Google Scholar]
- 15.Fox DJ, Kumar A, West NA. Trends with corticosteroid use in males with Duchenne muscular dystrophy born 1982–2001. J Child Neurol. 2015;30:21–26. doi: 10.1177/0883073813517263. [DOI] [PubMed] [Google Scholar]
- 16.Bortolini ER, Zatz M. Duchenne muscular dystrophy: comparison among different racial groups. Am J Med Genet. 1987;28:925–929. doi: 10.1002/ajmg.1320280418. [DOI] [PubMed] [Google Scholar]
- 17.Kenneson A, Kolor K, Yang Q. Trends and racial disparities in muscular dystrophy deaths in the United States, 1983–1998: an analysis of multiple cause mortality data. Am J Med Genet A. 2006;140:2289–2297. doi: 10.1002/ajmg.a.31437. [DOI] [PubMed] [Google Scholar]
- 18.McDonald CM, Henricson EK, Abresch RT. The Cooperative International Neuromuscular Research Group Duchenne Natural History Study—a longitudinal investigation in the era of glucocorticoid therapy: design of protocol and the methods used. Muscle Nerve. 2013;48:32–54. doi: 10.1002/mus.23807. [DOI] [PMC free article] [PubMed] [Google Scholar]
- 19.Henricson EK, Abresch RT, Cnaan A. The Cooperative International Neuromuscular Research Group Duchenne Natural History Study: glucocorticoid treatment preserves clinically meaningful functional milestones and reduces rate of disease progression as measured by manual muscle testing and other commonly used clinical trial outcome measures. Muscle Nerve. 2013;48:55–67. doi: 10.1002/mus.23808. [DOI] [PMC free article] [PubMed] [Google Scholar]
- 20.Purcell S, Neale B, Todd-Brown K. PLINK: a tool set for whole-genome association and population-based linkage analyses. Am J Hum Genet. 2007;81:559–575. doi: 10.1086/519795. [DOI] [PMC free article] [PubMed] [Google Scholar]
- 21.Neale BM, Purcell S. The positives, protocols, and perils of genome-wide association. Am J Med Genet B. 2008;147B:1288–1294. doi: 10.1002/ajmg.b.30747. [DOI] [PubMed] [Google Scholar]
- 22.DeSilva S, Drachman DB, Mellits D, Kuncl RW. Prednisone treatment in Duchenne muscular dystrophy. Long-term benefit. Arch Neurol. 1987;44:818–822. doi: 10.1001/archneur.1987.00520200022012. [DOI] [PubMed] [Google Scholar]
- 23.Angelini C, Pegoraro E, Turella E. Deflazacort in Duchenne dystrophy: study of long-term effect. Muscle Nerve. 1994;17:386–391. doi: 10.1002/mus.880170405. [DOI] [PubMed] [Google Scholar]
- 24.McAdam LC, Mayo AL, Alman BA, Biggar WD. The Canadian experience with long-term deflazacort treatment in Duchenne muscular dystrophy. Acta Myol. 2012;31:16–20. [PMC free article] [PubMed] [Google Scholar]
- 25.Ricotti V, Ridout DA, Scott E. Long-term benefits and adverse effects of intermittent versus daily glucocorticoids in boys with Duchenne muscular dystrophy. J Neurol Neurosurg Psychiatry. 2013;84:698–705. doi: 10.1136/jnnp-2012-303902. [DOI] [PubMed] [Google Scholar]
- 26.Bello L, Piva L, Barp A. Importance of SPP1 genotype as a covariate in clinical trials in Duchenne muscular dystrophy. Neurology. 2012;79:159–162. doi: 10.1212/WNL.0b013e31825f04ea. [DOI] [PMC free article] [PubMed] [Google Scholar]
- 27.Piva L, Gavassini BF, Bello L. TGFBR2 but not SPP1 genotype modulates osteopontin expression in Duchenne muscular dystrophy muscle. J Pathol. 2012;228:251–259. doi: 10.1002/path.4026. [DOI] [PMC free article] [PubMed] [Google Scholar]
- 28.Hoffman EP, Gordish-Dressman H, McLane VD. Alterations in osteopontin modify muscle size in females in both humans and mice. Med Sci Sports Exerc. 2013;45:1060–1068. doi: 10.1249/MSS.0b013e31828093c1. [DOI] [PMC free article] [PubMed] [Google Scholar]
- 29.Rhen T, Cidlowski JA. Antiinflammatory action of glucocorticoids—new mechanisms for old drugs. N Engl J Med. 2005;353:1711–1723. doi: 10.1056/NEJMra050541. [DOI] [PubMed] [Google Scholar]
- 30.Fisher I, Abraham D, Bouri K. Prednisolone-induced changes in dystrophic skeletal muscle. FASEB J. 2005;19:834–836. doi: 10.1096/fj.04-2511fje. [DOI] [PubMed] [Google Scholar]
- 31.Heier CR, Damsker JM, Yu Q. VBP15, a novel anti-inflammatory and membrane-stabilizer, improves muscular dystrophy without side effects. EMBO Mol Med. 2013;5:1569–1585. doi: 10.1002/emmm.201302621. [DOI] [PMC free article] [PubMed] [Google Scholar]
- 32.van den Bergen JC, Hiller M, Bohringer S. Validation of genetic modifiers for Duchenne muscular dystrophy: a multicentre study assessing SPP1 and LTBP4 variants. J Neurol Neurosurg Psychiatry. 2014 doi: 10.1136/jnnp-2014-308409. et al.;DOI: 10.1136/jnnp-2014-308409. [Epub ahead of print] [DOI] [PMC free article] [PubMed] [Google Scholar]
- 33.Zatz M, Pavanello RC, Lazar M. Milder course in Duchenne patients with nonsense mutations and no muscle dystrophin. Neuromuscul Disord. 2014;24:986–989. doi: 10.1016/j.nmd.2014.06.003. [DOI] [PubMed] [Google Scholar]
Associated Data
This section collects any data citations, data availability statements, or supplementary materials included in this article.