Abstract
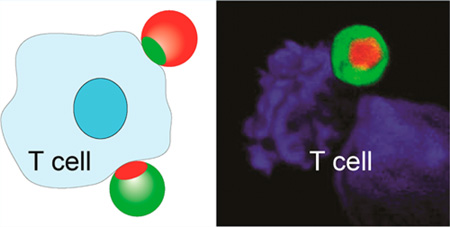
Here we show that the multifunctionality of Janus particles can be exploited for in vitro T cell activation. We engineer bifunctional Janus particles on which the spatial distribution of two ligands, anti-CD3 and fibronectin, mimics the “bull’s eye” protein pattern formed in the membrane junction between a T cell and an antigen-presenting cell. Different levels of T cell activation can be achieved by simply switching the spatial distribution of the two ligands on the surfaces of the “bull’s eye” particles. We find that the ligand pattern also affects clustering of intracellular proteins. This study demonstrates that anisotropic particles, such as Janus particles, can be developed as artificial antigen-presenting cells for modulating T cell activation.
Keywords: Janus particles, multifunctionality, T cell activation, artificial antigen-presenting cells, immunological synapse, ligand pattern
Janus particles, which in a single entity have distinct surface makeups or compartments, offer many promising biomedical applications that are not possible with homogeneous particles. For example, multicompartmental Janus particles can function as drug delivery carriers that allow controlled stepwise drug release.1–3 They can be designed to perform multiplexed biomolecular detection, where one side of a Janus particle captures analytes and the other side is graphically encoded.4,5 Janus particles that are half-magnetic and half-fluorescent enable simultaneous imaging and magnetic therapy.6 Bifunctionality of Janus particles can also be exploited for simultaneous imaging/sensing.6–8 In this study, we report a new application in which Janus particles are used as artificial antigen-presenting cells for T cell activation.
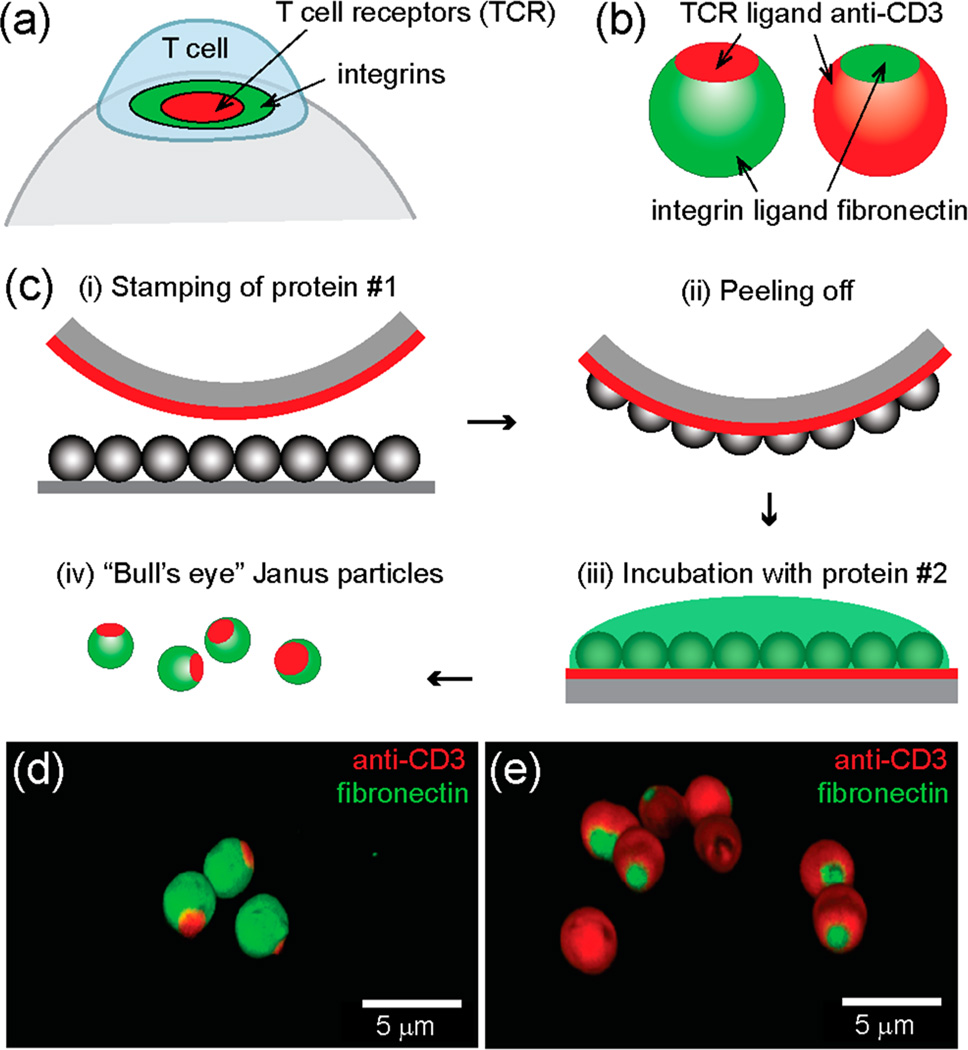
Adoptive T cell therapy harnesses the immune system to fight against cancer and infections. Activating T cells in vitro is a key step in this therapy. In vivo, T cells are activated by antigen-presenting cells (APCs), such as dendritic cells, but for in vitro activation, using APCs is costly, time-consuming, and sometimes irreproducible. As an alternative, synthetic particles that display antigens and stimulatory ligands have been developed to function as artificial APCs and provide more consistent stimulation of T cells in vitro. A wide variety of particles has been designed to mimic different aspects of the native APCs, including size,9 shape,10–12 and multivalency.13 However, current artificial APC designs have mainly focused on particles that are uniformly coated with ligands. Yet, T cell activation is known to involve spatial segregation of proteins in cell membranes. T cells are activated when T cell receptors (TCRs) and coreceptors bind their respective ligands on the surface of APCs. The activation leads proteins in the T cell membrane, at the junction with the APC, to organize spatially.14,15 This spatially organized junction is called an immunological synapse. Membrane receptors segregate to form a “bull’s eye” pattern of several distinct concentric domains, where ligand-bound TCRs accumulate in the center and integrins are enriched in a ring structure surrounding the TCRs (Figure 1a). Studies show that manipulating formation of the immunological synapse, by patterning ligands on flat two-dimensional surfaces, alters T cell activation.16–21 However, this concept has not yet been realized on curved surfaces that better mimic the cell surface of APCs.
Figure 1.
“Bull’s eye” Janus particles resemble the spatial pattern of proteins found in the immunological synapse. (a) Ligand-bound T cell receptors (TCRs) and integrins form “bull’s eye” concentric microdomains in the membrane junction between a T cell and an antigen-presenting cell, which is known as the immunological synapse. (b) Schematic illustration of native and reverse “bull’s eye” particles that display patterns of anti-CD3 and fibronectin. (c) Microcontact printing method for creating “bull’s eye” particles. (d, e) 3-D confocal fluorescence images of the “bull’s eye” particles.
Here, we design bifunctional Janus particles whose ligand presentation on the surfaces mimics the “bull’s eye” pattern in the immunological synapse. Ligands presented on the silica particles include anti-CD3 antibodies that bind TCRs and fibronectin molecules that bind α4β1and α5β1 integrins for T cell adhesion. We created two types of “bull’s eye” particles (see Figure 1b). One pattern, the “native” pattern, resembles that occurring naturally in the immunological synapse, in which anti-CD3 is enriched in the central domain and fibronectin accumulates in the surrounding region. The other protein pattern is the reversed one; a patch of fibronectin is surrounded by a field of anti-CD3. Based on aforementioned studies that show T cell activation is modulated by the spatial patterning of ligands on flat surfaces, we hypothesize that the two types of “bull’s eye” particles activate T cells differently.
The Janus particles (diameter =3 µm) were fabricated using a modified microcontact printing method (see Figure 1c and Experimental Section in the Supporting Information). Briefly, a patch of the first protein, either biotinylated bovine serum albumin (BSA) or fibronectin, was printed on silica micro-particles by pressing a polydimethylsiloxane (PDMS) stamp that was “inked” with the protein solution against a monolayer of particles. The remaining exposed surface of particles was subsequently coated with the second protein by incubation. Biotinylated anti-CD3 is conjugated with BSA-biotin via streptavidin linkers. The size of the protein patches can be adjusted by changing the applied pressure and stiffness of the PDMS stamps, with higher stamping pressure and softer stamps generating larger patches. In this study, we chose a relatively hard stamp made of 2:1 monomer-to-cross-linker ratio and a stamping pressure of 1.5 × 10⁴ Pa, such that the protein patches have an average diameter of (1.7 ± 0.3) µm (see Figure S1 in the Supporting Information). This size is similar to the size of the central protein domain found in the immunological synapse. The overlap of the two protein domains is negligible, as confirmed in 3D fluorescence confocal images (Figure 1d, e).
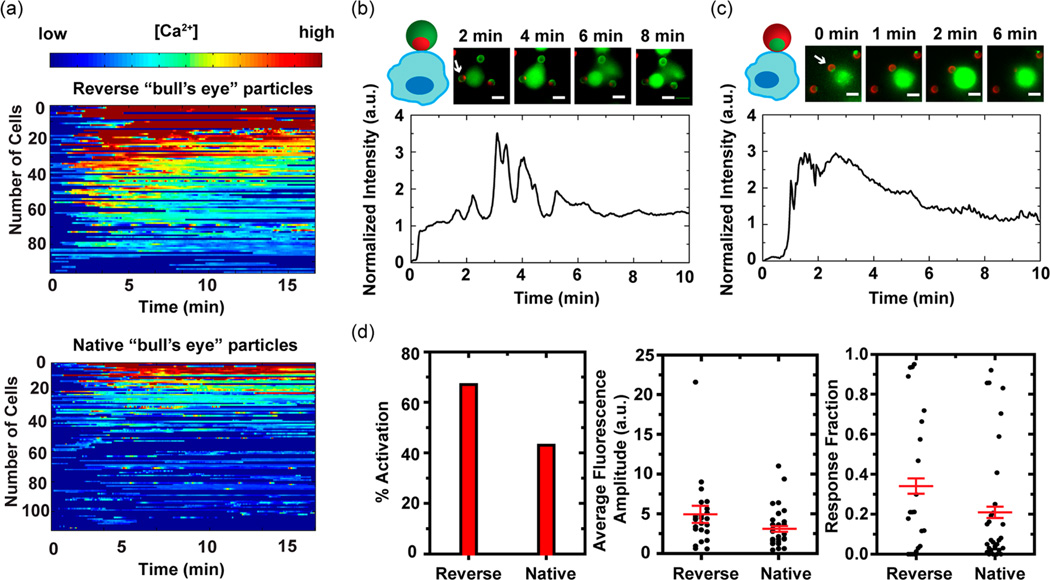
We first investigate whether the particles can activate T cells by measuring intracellular calcium elevation. When T cells are activated, calcium ions rapidly enter their cytosol from both the endoplasmic reticulum (ER) and the extracellular solution. The amplitude of calcium elevation and its duration in T cells is directly related to how strongly they are activated; more intense and sustained calcium influx indicates stronger T cell activation.22,23 In our experiments, T cells are loaded with a calcium-sensitive dye, Fluo-4 acetoxymethyl ester (AM), whose fluorescence emission increases in proportion to intracellular [Ca2+] and therefore reports the activation of individual T cells. Figure 2a demonstrates the calcium response of two groups of T cells that are stimulated by “bull’s eye” particles. Each color-scaled horizontal line represents how intracellular [Ca2+], as measured by normalized fluorescence intensity of Fluo-4, of a given T cell changes as a function of time. Despite the cell-to-cell variation of calcium response, which is a known feature of T cell activation,24,25 the difference of calcium response between the two T cell groups is evident. The particles with the reverse “bull’s eye” pattern lead to calcium elevation in a larger fraction of T cells, meaning a greater level of T cell activation, than particles with the native “bull’s eye” pattern.
Figure 2.
T cell activation as measured by intracellular calcium elevation. Jurkat T cells were loaded with calcium-sensitive dye, Fluo-4 AM, whose fluorescence intensity increases with intracellular concentration of Ca2+. (a) Normalized fluorescence intensities of T cells stimulated by particles with the reverse (total number of cells: 96) and the native “bull’s eye” pattern (total number of cells: 111) are plotted on a color scale and sorted based upon the fluorescence intensity of the first peak. (b, c) Calcium responses of two representative cells that are in direct contact with the “bull’s eye” patterns are plotted as a function of stimulation time. Time zero is defined as the time when cells are flown into imaging chambers. White arrows indicate Janus particles that are in contact with cells. Anti-CD3 and fibronectin are shown in red and green, respectively. Scale bars: 5 µm. (d) Calcium response of T cells that are in contact with the “bull’s eye” patterns is quantified with three parameters: the fraction of activated T cells (% activation), activation intensity (average fluorescence amplitude) and duration of calcium response (response fraction). Average fluorescence amplitude and response fraction are plotted in scattered plot with the mean (± SEM, shown in red). For the native pattern, a total of 30 cells were analyzed, and for the reverse pattern, 24 cells. Either data set represents results from more than 10 experiments done over 4 different days.
The native and reverse “bull’s eye” particles differ from one another in two ways: in the spatial organization of their ligand coatings, and in the total amount of surface covered by each ligand. The total number of anti-CD3 ligands available to T cells is known to influence the activation level of T cells.17,19 Consistent with this, we find the T cell activation level correlates with the surface coverage of anti-CD3 on the Janus particles–the reverse “bull’s eye” particles, whose surfaces are largely covered with anti-CD3, stimulate T cells to a similar level as particles that are completely coated with anti-CD3, whereas the native “bull’s eye” particles with a small patch of anti-CD3 stimulate T cells to a slightly greater level than particles that are completely coated with fibronectin (see Figure S2 in the Supporting Information). Beyond this effect of surface coverage, we want to know whether the spatial distribution of the ligands has an effect–what role does the “bull’s eye” spatial pattern play in T cell activation?
To answer this question we analyzed the calcium response of T cells whose point of contact with the Janus particles directly faces the “bull’s eye” pattern. When T cells are activated by the reverse “bull’s eye” pattern, the initial cell-particle contact is immediately followed by a large influx of Ca2+, as indicated by the rapid increase of Fluo-4 fluorescence intensity (Figure 2b and Figure S3a in the Supporting Information). The calcium response peaks within 2 min after the onset of signaling, is sustained for 1–3 min, and gradually returns to a basal level. Such calcium influx is characteristic of normal T cell activation.25 In contrast, T cells that are stimulated by the native “bull’s eye” pattern exhibit more transient calcium peaks, suggesting less sustained activation (Figure 2c and Figure S3b in the Supporting Information). A delay between the initial cell-particle contact and the first calcium peak is also typical, implying a phase during which T cells search for stimulatory signal from anti-CD3.
We quantify the calcium response with three parameters: (1) percentage of activated cells, (2) average fluorescence amplitude, and (3) response fraction, based upon a method reported previously (see the Experimental Section in the Supporting Information).26 Thresholds of calcium peak intensity and duration are set to identify the percentage of activated cells (% activation). Average fluorescence amplitude is the time-averaged fluorescence intensity of individual T cells and indicates the overall activation level of single cells. Response fraction, the fraction of time during which a given T cell stays activated, measures how sustained an activation is. As demonstrated in Figure 2d, the reverse “bull’s eye” pattern activates more T cells and leads to more intense and sustained calcium response than the native pattern. The comparison shows that the “bull’s eye” pattern of ligands also affects T cell activation, with the reverse “bull’s eye” pattern resulting in greater T cell activation. Therefore, we conclude that the different levels of T cell activation by the two types of particles result from the combined effect of both ligand spatial organization and surface coverage. The surface anisotropy of Janus particles provides a means of controlling both parameters.
To further elucidate how the “bull’s eye” particles affect T cell activation, we investigate the clustering morphology of two intracellular signaling proteins, actin and protein kinase C (PKC)-θ. Neither of the proteins is membrane bound, but they are known to associate with TCRs and spatially segregate in the immunological synapse. Specifically, actin distributes across the entire immunological synapse at the beginning of T cell activation, but accumulates in a ring structure in the mature synapse.27 PKC-θ is a signaling protein required for T cell activation and survival; at initial T cell activation, it follows TCRs in intracellular clustering.28
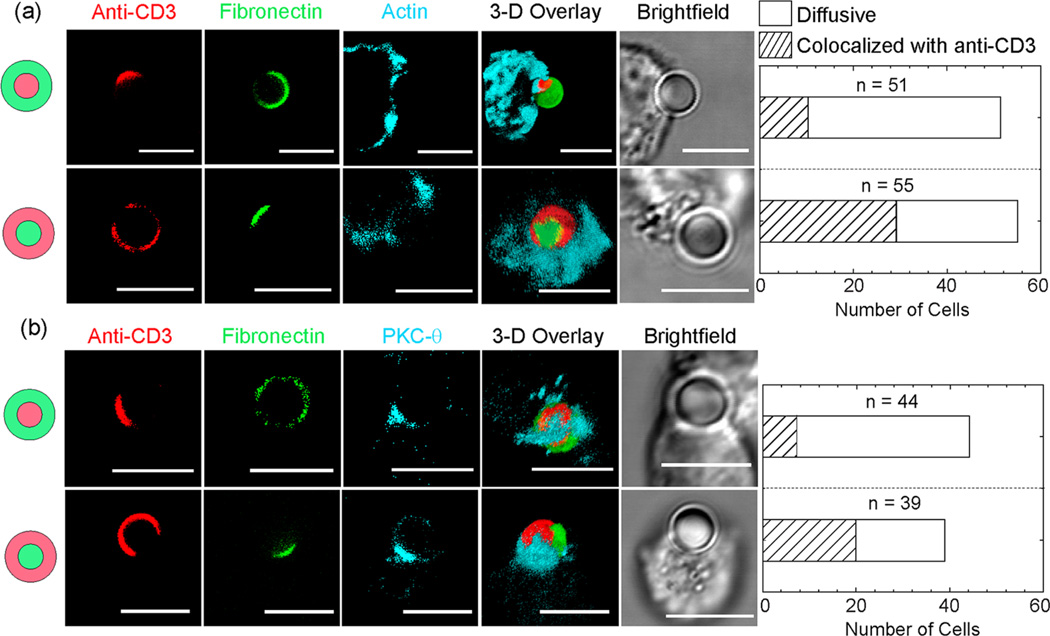
To capture the early TCR activation stage, and to prevent complete engulfment of particles, we fixed Jurkat T cells 4 min after mixing them with particles. Although cells interact with particles at random, in all possible orientations, we will here focus on cells whose point of contact with the particle faces the “bull’s eye” pattern. To characterize the localization of immunostained actin or PKC-θ in the T cells with respect to the patterns of anti-CD3 and fibronectin on the particles, we compared three-color fluorescence confocal images. Areas of particle–cell contact were identified in bright-field images. We observed different clustering morphologies of actin and PKC-θ (Figure 3 and Figure S4 in the Supporting Information). In the majority of T cells that are in contact with the native “bull’s eye” pattern, actin and PKC-θ are distributed over the entire particle–cell contact area, whereas in others, accumulation of actin and PKC-θ occurs only near the anti-CD3 patches. Similarly, in T cells that are stimulated by the reverse “bull’s eye” pattern, actin and PKC-θ colocalize with the anti-CD3 patch in some T cells, while in others they are spread diffusely. Interestingly, we did not observe exclusive colocalization of actin or PKC-θ with the fibronectin patch, even though actin in the mature immunological synapse colocalizes with ligand bound integrins. This difference might be caused by the fact that we fixed cells at early times of cell activation, but the exact reason is unclear. To confirm that the intracellular clustering of actin and PKC-θ observed is indeed due to the ligand patterns on particles, we stimulated T cells with particles that were uniformly coated with anti-CD3 and fibronectin. Only diffusive distributions of actin and PKC-θ were observed (Figures S5 and S6 in the Supporting Information). Our results indicate that intracellular localization of actin and PKC-θ is largely dictated by the spatial organization of anti-CD3 on particles, regardless of the specific protein pattern. As a result, we are able to achieve different clustering morphologies of actin and PKC-θ by stimulating T cells with “bull’s eye” particles that have opposite organization of ligands.
Figure 3.
Fluorescence confocal images show different intracellular clustering morphologies of (a) actin and (b) protein kinase C (PKC)-θ in T cells that are stimulated by “bull’s eye” particles. Actin and PKC-θ either colocalize with the anti-CD3 patch or appear diffusive over the entire particle–cell contact area. Bar graphs show the total number of cells for each category. Scale bars: 5 µm.
Previous studies have shown that the accumulation of TCRs at the center of an immunological synapse leads to signaling termination.15,29 T cell signaling is prolonged when TCRs are prevented from moving toward the center.16 We have shown here that particles with the reverse “bull’s eye” pattern lead to different localization of actin and PKC-θ within T cells than do native “bull’s eye” particles, and activate T cells more strongly. It is possible that the spatial organization of anti-CD3 and fibronectin on particle surfaces directs segregation of membrane receptors and intracellular proteins, which in turn, causes different T cell signaling outcomes. However, further investigations are necessary to understand the connection between ligand patterns and the T cell response. For instance, the intracellular domains of TCRs may be labeled to reveal whether or not clustering of TCRs is altered by the “bull’s eye” pattern. Phosphorylation of protein kinases in the early T cell signaling pathways may also be quantified. Another important question is how patterning of fibronectin affects T cell–particle interactions, as integrin clustering may enhance cell adhesion and promote costimulation of T cells.30 The detailed mechanism of how the “bull’s eye” particles modulate T cell activation will be investigated following this initial proof-of-concept study.
Here we demonstrated a new application of Janus particles as artificial antigen-presenting cells for in vitro T cell activation. Using a microcontact printing method, we created micron-sized particles with two different “bull’s eye” patterns of protein ligands on their surfaces. One pattern mimics the native organization of proteins in the immunological synapse, while the other reverses that pattern with the same ligands. We found that the reverse “bull’s eye” particles lead to more intense and sustained T cell activation than the native type, likely because of a combined effect of spatial organization and surface coverage of ligands. We also demonstrated that the “bull’s eye” patterns influence intracellular localization of signaling proteins, including actin and PKC-θ. Our results demonstrate that T cells can be activated to different levels by simply switching patterns of ligands on Janus particles. As a proof of concept, this study reports a new application of Janus particles. It shows how their anisotropic surface functionality may be exploited to fine-tune T cell activation for adoptive T cell therapy. One current limitation is that T cell activation depends on the correct particle–cell orientation, because the “bull’s eye” pattern is on only one hemisphere of the particles. Future studies aim to overcome this limitation by engineering multifaced anisotropic particles or by controlling the orientation of the particle with techniques such as optical tweezers.
Supplementary Material
ACKNOWLEDGMENTS
We thank Dr. Yi Yi for helpful discussions, Jim Powers of the IUB Light Microscopy Imaging Center for fluorescence imaging assistance, and Indiana University for funding.
Footnotes
ASSOCIATED CONTENT
Ⓢ Supporting Information
Experimental procedure, particle patch size characterization, calcium influx analysis, supplementary 3D fluorescence confocal images. This material is available free of charge via the Internet at http://pubs.acs.org.
The authors declare no competing financial interest.
REFERENCES
- 1.Hwang S, Lahann J. Differentially Degradable Janus Particles for Controlled Release Applications. Macromol. Rapid Commun. 2012;33:1178–1183. doi: 10.1002/marc.201200054. [DOI] [PubMed] [Google Scholar]
- 2.Rahmani S, Park T-H, Dishman AF, Lahann J. Multimodal Delivery of Irinotecan from Microparticles with Two Distinct Compartments. J. Controlled Release. 2013;172:239–245. doi: 10.1016/j.jconrel.2013.08.017. [DOI] [PMC free article] [PubMed] [Google Scholar]
- 3.Misra AC, Bhaskar S, Clay N, Lahann J. Multi-compartmental Particles for Combined Imaging and siRNA Delivery. Adv. Mater. 2012;24:3850–3856. doi: 10.1002/adma.201200372. [DOI] [PubMed] [Google Scholar]
- 4.Pregibon DC, Toner M, Doyle PS. Multifunctional Encoded Particles for High-Throughput Biomolecule Analysis. Science. 2007;315:1393–1396. doi: 10.1126/science.1134929. [DOI] [PubMed] [Google Scholar]
- 5.Bong KW, Chapin SC, Doyle PS. Magnetic Barcoded Hydrogel Microparticles for Multiplexed Detection. Langmuir. 2010;26:8008–8014. doi: 10.1021/la904903g. [DOI] [PMC free article] [PubMed] [Google Scholar]
- 6.Hu S-H, Gao X. Nanocomposites with Spatially Separated Functionalities for Combined Imaging and Magnetolytic Therapy. J. Am. Chem. Soc. 2010;132:7234–7237. doi: 10.1021/ja102489q. [DOI] [PMC free article] [PubMed] [Google Scholar]
- 7.Jiang J, Gu H, Shao H, Devlin E, Papaefthymiou GC, Ying JY. Bifunctional Fe3O4–Ag Heterodimer Nanoparticles for Two-Photon Fluorescence Imaging and Magnetic Manipulation. Adv. Mater. 2008;20:4403–4407. [Google Scholar]
- 8.Wu LY, Ross BM, Hong S, Lee LP. Bioinspired Nanocorals with Decoupled Cellular Targeting and Sensing Functionality. Small. 2010;6:503–507. doi: 10.1002/smll.200901604. [DOI] [PubMed] [Google Scholar]
- 9.Mescher MF. Surface Contact Requirements for Activation of Cytotoxic T Lymphocytes. J. Immunol. 1992;149:2402–2405. [PubMed] [Google Scholar]
- 10.Sunshine JC, Perica K, Schneck JP, Green JJ. Particle shape dependence of CD8+ T cell activation by artificial antigen presenting cells. Biomaterials. 2014;35:269–277. doi: 10.1016/j.biomaterials.2013.09.050. [DOI] [PMC free article] [PubMed] [Google Scholar]
- 11.Fadel TR, Look M, Staffier PA, Haller GL, Pfefferle LD, Fahmy TM. Clustering of Stimuli on Single-Walled Carbon Nanotube Bundles Enhances Cellular Activation. Langmuir. 2009;26:5645–5654. doi: 10.1021/la902068z. [DOI] [PubMed] [Google Scholar]
- 12.Mandal S, Eksteen-Akeroyd ZH, Jacobs MJ, Hammink R, Koepf M, Lambeck AJA, van Hest JCM, Wilson CJ, Blank K, Figdor CG, Rowan AE. Therapeutic Nanoworms: Towards Novel Synthetic Dendritic Cells for Immunotherapy. Chem. Sci. 2013;4:4168–4174. [Google Scholar]
- 13.Kim JV, Latouche J-B, Riviere I, Sadelain M. The ABCs of Artificial Antigen Presentation. Nat. Biotechnol. 2004;22:403–410. doi: 10.1038/nbt955. [DOI] [PubMed] [Google Scholar]
- 14.Grakoui A, Bromley SK, Sumen C, Davis MM, Shaw AS, Allen PM, Dustin ML. The Immunological Synapse: A Molecular Machine Controlling T Cell Activation. Science. 1999;285:221–227. doi: 10.1126/science.285.5425.221. [DOI] [PubMed] [Google Scholar]
- 15.Lee K-H, Holdorf AD, Dustin ML, Chan AC, Allen PM, Shaw AS. T Cell Receptor Signaling Precedes Immunological Synapse Formation. Science. 2002;295:1539–1542. doi: 10.1126/science.1067710. [DOI] [PubMed] [Google Scholar]
- 16.Mossman KD, Campi G, Groves JT, Dustin ML. Altered TCR Signaling from Geometrically Repatterned Immunological Synapses. Science. 2005;310:1191–1193. doi: 10.1126/science.1119238. [DOI] [PubMed] [Google Scholar]
- 17.Doh J, Irvine DJ. Immunological synapse arrays: Patterned protein surfaces that modulate immunological synapse structure formation in T cells. Proc. Natl. Acad. Sci. U.S.A. 2006;103:5700–5705. doi: 10.1073/pnas.0509404103. [DOI] [PMC free article] [PubMed] [Google Scholar]
- 18.Shen K, Thomas VK, Dustin ML, Kam LC. Micropatterning of costimulatory ligands enhances CD4+ T cell function. Proc. Natl. Acad. Sci. U.S.A. 2008;105:7791–7796. doi: 10.1073/pnas.0710295105. [DOI] [PMC free article] [PubMed] [Google Scholar]
- 19.Deeg J, Axmann M, Matic J, Liapis A, Depoil D, Afrose J, Curado S, Dustin ML, Spatz JP. T Cell Activation is Determined by the Number of Presented Antigens. Nano Lett. 2013;13:5619–5626. doi: 10.1021/nl403266t. [DOI] [PMC free article] [PubMed] [Google Scholar]
- 20.Matic J, Deeg J, Scheffold A, Goldstein I, Spatz JP. Fine Tuning and Efficient T Cell Activation with Stimulatory aCD3 Nanoarrays. Nano Lett. 2013;13:5090–5097. doi: 10.1021/nl4022623. [DOI] [PMC free article] [PubMed] [Google Scholar]
- 21.Delcassian D, Depoil D, Rudnicka D, Liu M, Davis DM, Dustin ML, Dunlop IE. Nanoscale Ligand Spacing Influences Receptor Triggering in T Cells and NK Cells. Nano Lett. 2013;13:5608–5614. doi: 10.1021/nl403252x. [DOI] [PMC free article] [PubMed] [Google Scholar]
- 22.Lewis RS. Calcium Signaling Mechanisms in T Lymphocytes. Annu. Rev. Immunol. 2001;19:497–521. doi: 10.1146/annurev.immunol.19.1.497. [DOI] [PubMed] [Google Scholar]
- 23.Feske S. Calcium Signalling in Lymphocyte Activation and Disease. Nat. Rev. Immunol. 2007;7:690–702. doi: 10.1038/nri2152. [DOI] [PubMed] [Google Scholar]
- 24.Manz BN, Jackson BL, Petit RS, Dustin ML, Groves J. T-Cell Triggering Thresholds are Modulated by the Number of Antigen within Individual T-Cell Receptor Clusters. Proc. Natl. Acad. Sci. U.S.A. 2011;108:9089–9094. doi: 10.1073/pnas.1018771108. [DOI] [PMC free article] [PubMed] [Google Scholar]
- 25.Yu Y, Fay NC, Smoligovets AA, Wu H-J, Groves JT. Myosin IIA Modulates T Cell Receptor Transport and CasL Phosphorylation during Early Immunological Synapse Formation. PLoS One. 2012;7:e30704. doi: 10.1371/journal.pone.0030704. [DOI] [PMC free article] [PubMed] [Google Scholar]
- 26.Salles A, Billaudeau C, Sergé A, Bernard A-M, Phélipot M-C, Bertaux N, Fallet M, Grenot P, Marguet D, He H-T, Hamon Y. Barcoding T Cell Calcium Response Diversity with Methods for Automated and Accurate Analysis of Cell Signals (MAAACS) PLoS Comput. Biol. 2013;9:e1003245. doi: 10.1371/journal.pcbi.1003245. [DOI] [PMC free article] [PubMed] [Google Scholar]
- 27.Yu Y, Smoligovets AA, Groves JT. Modulation of T cell signaling by the actin cytoskeleton. J. Cell Sci. 2013;126:1049–1058. doi: 10.1242/jcs.098210. [DOI] [PubMed] [Google Scholar]
- 28.Yokosuka T, Kobayashi W, Sakata-Sogawa K, Takamatsu M, Hashimoto-Tane A, Dustin ML, Tokunaga M, Saito T. Spatiotemporal Regulation of T Cell Costimulation by TCR-CD28 Microclusters and Protein Kinase C θ Translocation. Immunity. 2008;29:589–601. doi: 10.1016/j.immuni.2008.08.011. [DOI] [PMC free article] [PubMed] [Google Scholar]
- 29.Lee K-H, Dinner AR, Tu C, Campi G, Raychaudhuri S, Varma R, Sims TN, Burack WR, Wu H, Wang J, Kanagawa O, Markiewicz M, Allen PM, Dustin ML, Chakraborty AK, Shaw AS. The Immunological Synapse Balances T Cell Receptor Signaling and Degradation. Science. 2003;302:1218–1222. doi: 10.1126/science.1086507. [DOI] [PubMed] [Google Scholar]
- 30.Hogg N, Laschinger M, Giles K, McDowall A. T-cell integrins: more than just sticking points. J. Cell Sci. 2003;116:4695–4705. doi: 10.1242/jcs.00876. [DOI] [PubMed] [Google Scholar]
Associated Data
This section collects any data citations, data availability statements, or supplementary materials included in this article.


