

Abstract
Purpose
Randomized controlled trials have supported integrated oncology and palliative care (PC); however, optimal timing has not been evaluated. We investigated the effect of early versus delayed PC on quality of life (QOL), symptom impact, mood, 1-year survival, and resource use.
Patients and Methods
Between October 2010 and March 2013, 207 patients with advanced cancer at a National Cancer Institute cancer center, a Veterans Affairs Medical Center, and community outreach clinics were randomly assigned to receive an in-person PC consultation, structured PC telehealth nurse coaching sessions (once per week for six sessions), and monthly follow-up either early after enrollment or 3 months later. Outcomes were QOL, symptom impact, mood, 1-year survival, and resource use (hospital/intensive care unit days, emergency room visits, chemotherapy in last 14 days, and death location).
Results
Overall patient-reported outcomes were not statistically significant after enrollment (QOL, P = .34; symptom impact, P = .09; mood, P = .33) or before death (QOL, P = .73; symptom impact, P = .30; mood, P = .82). Kaplan-Meier 1-year survival rates were 63% in the early group and 48% in the delayed group (difference, 15%; P = .038). Relative rates of early to delayed decedents' resource use were similar for hospital days (0.73; 95% CI, 0.41 to 1.27; P = .26), intensive care unit days (0.68; 95% CI, 0.23 to 2.02; P = .49), emergency room visits (0.73; 95% CI, 0.45 to 1.19; P = .21), chemotherapy in last 14 days (1.57; 95% CI, 0.37 to 6.7; P = .27), and home death (27 [54%] v 28 [47%]; P = .60).
Conclusion
Early-entry participants' patient-reported outcomes and resource use were not statistically different; however, their survival 1-year after enrollment was improved compared with those who began 3 months later. Understanding the complex mechanisms whereby PC may improve survival remains an important research priority.
INTRODUCTION
The American Society of Clinical Oncology provisional clinical opinion recommends that “combined standard oncology care and palliative care (PC) should be considered early in the course of illness for any patient with metastatic cancer and/or high symptom burden.”1p880 A gap exists between this recommendation and current practice, and there is no consensus on how early PC should be integrated.1 Many oncologists delay PC referral until all disease-modifying treatments have been exhausted; as a result, PC is offered late, if at all.2 Similarly, delaying PC consultation until patients are hospice eligible or admitted to the hospital for a medical crisis3 prevents patients from receiving all of the potential benefits that early PC has to offer.4–6
In contrast, early PC provides anticipatory guidance about symptom management and thoughtful discussions on advanced care planning and goals of care that engage individuals to consider their values and care preferences in a more relaxed environment than the acute care hospital.2,5 Randomized controlled trials (RCTs) of early outpatient PC have demonstrated improved patient-reported and survival outcomes in multiple solid tumors5,7 and metastatic lung cancer.6 Providing early PC via outpatient clinics assumes that patients have an adequate functional status and the practical means to travel.8–10 Expanding early PC access, especially in rural communities, is a formidable barrier8–11 and a critically important research concern.1,12
To our knowledge, ENABLE (Educate, Nurture, Advise, Before Life Ends), is the only feasible11,12 and effective4,7 telehealth early PC model for patients with advanced cancer and family caregivers in a rural setting. In the ENABLE II RCT, we demonstrated improved quality of life (QOL), reduced depression, and trends in improved symptom intensity and survival relative to usual cancer care.4 On the basis of interviews with surviving intervention (n = 27) and control (n = 26) patients, family caregivers (n = 10),13 and oncology clinicians (n = 34),14 we designed a follow-up RCT with three modifications: first, we added a three-session life review component; second, we designed a separate but parallel intervention for caregivers; and third, we adopted a fast-track study design.15,16 This design would allow us to address the question of optimal timing of initiating PC. As in our prior RCT,4 we defined early as initiating PC within 30 to 60 days of diagnosis; however, for the comparison group, we delayed initiation of PC for 3 months. The rationale for choosing a 3-month delay was based on feedback from some surviving patients who felt that the intervention was more helpful when symptom burden was higher.13 In our prior study, symptom intensity increased at 3 months.7 Therefore, the main research objective of this study was to compare the effect of early versus delayed intervention timing on patient-reported outcomes, 1-year survival, and resource use. Family caregiver outcomes are reported elsewhere.17
PATIENTS AND METHODS
Study Design
Using a fast-track RCT design15,16 (Appendix Fig A1, online only), patients were randomly assigned to receive the ENABLE telehealth concurrent PC model with standard oncology care either within 30 to 60 days of being informed of an advanced cancer diagnosis, cancer recurrence, or progression, with, in the opinion of the oncologist, prognosis between 6 and 24 months (early group), or 3 months later (delayed group). Random assignment was on a one-to-one basis using computer-generated randomly permuted treatment assignments with randomly assigned block sizes of two and four stratified by disease (six categories) and enrollment site (four clinics). Data collectors were blinded to participant group. The study protocol and data and safety monitoring plan were approved by the Norris Cotton Cancer Center/Dartmouth College (Lebanon, NH) and the Veterans Affairs Medical Center (White River Junction, VT) institutional review boards.
Patients
Between October 11, 2010, and March 5, 2013, research coordinators reviewed all outpatient clinicians' schedules and tumor board lists using eligibility criteria (English-speaking, age ≥ 18 years with advanced-stage solid tumor or hematologic malignancy, oncologist-determined prognosis of 6 to 24 months, and able to complete baseline questionnaires; Data Supplement provides detailed criteria). Exclusions included impaired cognition (Callahan score ≤ 4),18 active axis I psychiatric (schizophrenia, bipolar disorder) or substance use disorder, uncorrectable hearing disorder, or unreliable telephone service. (Data Supplement provides details on disease-specific eligibility criteria, Callahan screener, and study protocol.) After providing signed consent, patient participants were asked to select a caregiver, defined as “someone who knows you well and is involved in your medical care,” to participate; however, patients were not excluded if they did not identify a caregiver. There were no formal caregiver exclusion criteria.
Intervention
ENABLE2,4,7,12,20 includes initial in-person, standardized outpatient PC consultation21,22 by a board-certified PC clinician and six structured weekly telephone coaching sessions by an advanced practice nurse using a manualized curriculum (ie, Charting Your Course: An Intervention for Patients With Advanced Cancer). Sessions one to three focused on problem solving, symptom management, self-care, identification and coordination of local resources, communication, decision making, and advance care planning. Sessions four to six comprised Outlook, a life-review approach23–25 that encourages participants to frame advanced illness challenges as personal growth opportunities. After the six Charting Your Course sessions, monthly follow-up calls reinforced prior content and identified new challenges or care coordination issues. Sessions generally lasted 30 to 45 minutes.
Nurse coach training included self-study, review of treatment manuals and scripts, and role playing with feedback. The study principal investigator (M.A.B.) was blinded to group assignment, reviewed all PC consultation notes, and digitally recorded nurse coach sessions for protocol adherence. She met with the nurse coaches weekly to review and provide feedback on difficult cases.
Usual Care
Usual oncology care, provided to all patients, was directed by a medical oncologist and consisted of anticancer and symptom control treatments and consultation with oncology and supportive care specialists, including a clinical PC team.4 The latter was provided whenever requested, regardless of group assignment.
Procedures
Subsequent to signed informed consent, research coordinators administered questionnaires by telephone at baseline; at 6, 12, 18, and 24 weeks; and every 12 weeks thereafter until death or study completion. Baseline demographics included age, sex, ethnicity, race, religion, marital status, employment, education, smoking, and alcohol use.
Study Outcomes
Patient-reported QOL, symptom impact, and mood.
Outcomes included QOL (assessed by 46-item Functional Assessment of Chronic Illness Therapy–Palliative Care [FACIT-Pal],26 composed of physical, emotional, social, and functional well-being and additional concern subscales [score range, 0 to 184; higher score is better; subscale α > .74] and by Treatment Outcome Index (TOI), composed of FACIT-Pal physical, functional, and additional concern subscales [score range, 0 to 132]), symptom impact (assessed by four-item Quality of Life at End of Life [QUAL-E] symptom impact subscale [score range, 4 to 20; higher score is better; α = .87]),27 and mood (assessed by 20-item Center for Epidemiologic Studies–Depression scale [CES-D]; range, 0 to 60; higher score indicates greater depressed mood; score > 16 indicates clinically significant depression]).28,29
One-year and overall survival.
The prespecified outcome of difference in 1-year survival was calculated based on vital status from enrollment to 1 year after enrollment. Overall median survival was calculated based on time from enrollment to death or study closure (September 5, 2013).
Resource use and location of death.
Patient-reported hospital and intensive care unit (ICU) days and emergency department (ED) visits were recorded at baseline (covering prior 3 months) and at other data collection time points. Decedents' data for the period between the last patient-reported assessment and death, chemotherapy use in last 14 days, and location of death were obtained via medical record review or proxy report.
Statistical Analysis
We included data collected from October 11, 2010, through September 5, 2013, in analysis. We calculated a target sample size of 360 to provide 80% power to detect a 6-point difference in the FACIT-Pal and 2.5-point difference in the CES-D based on a t test comparing the 3-month group differences with a two-sided α of .05 using ENABLE II standard deviations of 17 for the FACIT-Pal and seven for the CES-D. However at the planned study completion date (March 15, 2013), the final enrollment was 207 because of slower than anticipated accrual (see limitations). On the basis of the final sample size, the 3-month detectable differences were: FACIT-Pal, 7.7 points; CES-D, 3.2 points.
Using a terminal decline joint modeling approach,30 we compared the treatment groups on QOL, symptom impact, and mood. The advantage of this approach is that it models the trend in QOL backward from time of death rather than prospectively from time of enrollment; thus, it controls the association between QOL and survival and therefore incorporates the survival effect on QOL. Terminal decline and survival distributions are estimated with flexible models applied to each treatment group. On the basis of the fitted models, comparisons were made at specified times before death and at specified times from enrollment, conditional on patients being alive. All intent-to-treat analyses were adjusted for baseline values. The method of estimation (maximum likelihood) results in valid and efficient estimates for missing outcome data under the assumption that the data are missing at random.31 We computed effects sizes as standardized mean differences (Cohen's d); effect sizes of at least 0.3 were considered clinically relevant.32
We chose 1-year survival as our primary survival outcome because the intervention targets (ie, communication, understanding of prognosis, treatment decision making, advance care planning, and symptom control33,34) are most likely to influence survival during the first year. Using Kaplan-Meier curves, we compared early and delayed group survival rates 1 year from enrollment. Overall survival was also compared via a log-rank test incorporating data for patients surviving > 1 year. Patients who were alive at the last follow-up (September 5, 2013) were censored on that date. We compared relative rates for both groups of decedents of hospital, ICU, and ED days or visits using a Poisson generalized linear model, with duration serving as an offset and allowing for overdispersion.
RESULTS
Baseline Characteristics of Patients and Intervention Participation
We enrolled and randomly assigned 207 patients (participation rate, 38%; Fig 1) to early (n = 104) or delayed intervention (n = 103). The early group had significantly less education, higher weekly alcoholic beverage use, and higher clinical trial enrollment; the groups were otherwise balanced on other important prognostic factors (Table 1). Patient-reported outcome scores were not statistically different at baseline (Appendix Table A1, online only). Participants (n = 207) and nonparticipants (n = 304) did not differ with regard to disease or sex.
Fig 1.

CONSORT diagram: patient recruitment, treatment, and analysis. PCT, palliative care treatment; psych, psychiatric disorder.
Table 1.
Baseline Demographic and Clinical Characteristics of Patient Participants
| Characteristic | Early Group (n = 104) |
Delayed Group (n = 103) |
P* | ||
|---|---|---|---|---|---|
| No. | % | No. | % | ||
| Age, years | .68 | ||||
| Mean | 64.03 | 64.6 | |||
| SD | 10.28 | 9.59 | |||
| Male sex | 56 | 53.85 | 53 | 51.46 | .78 |
| Marital status | .68 | ||||
| Never married | 7 | 6.73 | 5 | 4.85 | |
| Married or living with partner | 69 | 66.35 | 66 | 64.08 | |
| Divorced or separated | 15 | 14.42 | 21 | 20.39 | |
| Widowed | 13 | 12.5 | 11 | 10.68 | |
| Education | .05 | ||||
| < High school graduate | 8 | 7.69 | 3 | 2.91 | |
| High school graduate | 61 | 58.65 | 50 | 48.54 | |
| College graduate | 35 | 33.65 | 50 | 48.54 | |
| Race† | .52 | ||||
| White | 102 | 98.08 | 98 | 95.15 | |
| Black | 0 | 0.0 | 1 | 0.97 | |
| Other | 2 | 1.92 | 3 | 2.91 | |
| Missing | 0 | 0.0 | 1 | 0.97 | |
| Religion | .96 | ||||
| Catholic | 34 | 32.69 | 31 | 30.1 | |
| Protestant | 31 | 29.81 | 32 | 31.07 | |
| Jewish | 1 | 0.96 | 0 | 0.0 | |
| None | 23 | 22.12 | 21 | 20.39 | |
| Other | 13 | 12.5 | 15 | 14.56 | |
| Missing | 2 | 1.92 | 4 | 3.88 | |
| Attend religious services | .33 | ||||
| Never | 37 | 35.58 | 40 | 38.83 | |
| Occasionally | 42 | 40.38 | 33 | 32.04 | |
| Regularly | 20 | 19.23 | 27 | 26.21 | |
| Not applicable/missing | 5 | 4.81 | 3 | 2.91 | |
| Ever prayed for your own health | 72 | 69.23 | 70 | 67.96 | .88 |
| If yes, ever prayed in past month | 63 | 87.5 | 59 | 84.29 | .47 |
| Work status | 1.00 | ||||
| Employed | 25 | 24.04 | 24 | 23.3 | |
| Retired | 49 | 47.12 | 50 | 48.54 | |
| Not employed | 29 | 27.88 | 29 | 28.16 | |
| Student | 1 | 0.96 | 0 | 0.0 | |
| Medical insurance | .94 | ||||
| Medicare | 52 | 50 | 52 | 50.49 | |
| Private/commercial | 35 | 33.65 | 36 | 34.95 | |
| Military | 11 | 10.58 | 8 | 7.77 | |
| Medicaid | 4 | 3.85 | 3 | 2.91 | |
| Uninsured | 2 | 1.92 | 3 | 2.91 | |
| Missing | 0 | 0.0 | 1 | 0.97 | |
| Ever smoked | 72 | 69.23 | 73 | 70.87 | .88 |
| Currently smoke | 17 | 23.61 | 14 | 19.18 | .55 |
| Years of smoking | 36.65 | 13.24 | 41.91 | 9.22 | |
| No. of packs per day | .38 | ||||
| ≤ .5 | 9 | 52.94 | 11 | 78.57 | |
| 1 | 6 | 35.29 | 3 | 21.43 | |
| 1.5 | 2 | 11.76 | 0 | 0.0 | |
| Used to smoke | 55 | 76.39 | 59 | 80.82 | |
| How long since smoked, months | .73 | ||||
| < 1 | 2 | 3.64 | 3 | 5.08 | |
| 1 to 6 | 6 | 10.91 | 3 | 5.08 | |
| 6 to 12 | 4 | 7.27 | 4 | 6.78 | |
| > 12 | 42 | 76.36 | 48 | 81.36 | |
| No. of packs per day | .06 | ||||
| ≤ .5 | 15 | 27.27 | 24 | 40.68 | |
| 1 | 23 | 41.82 | 16 | 27.12 | |
| 1.5 | 11 | 20 | 5 | 8.47 | |
| 2 | 2 | 3.64 | 6 | 10.17 | |
| 2.5 | 0 | 0.0 | 3 | 5.08 | |
| 3 | 3 | 5.45 | 4 | 6.78 | |
| Used other tobacco | 13 | 12.5 | 13 | 12.62 | 1.00 |
| Alcoholic beverages in typical week | 2.56 | 5.76 | 1.22 | 2.84 | .04 |
| CAGE‡ | 0.84 | 1.01 | 0.77 | 0.6 | .82 |
| Caregiver enrolled | 63 | 60.58 | 61 | 59.22 | .89 |
| Lives in rural area | 62 | 59.62 | 60 | 58.25 | .78 |
| Diagnosis | .97 | ||||
| Lung | 46 | 44.23 | 42 | 40.78 | |
| GI tract | 26 | 25 | 24 | 23.3 | |
| Breast | 10 | 9.62 | 13 | 12.62 | |
| Other solid tumor | 10 | 9.62 | 10 | 9.71 | |
| Genitourinary tract | 7 | 6.73 | 9 | 8.74 | |
| Hematologic malignancy | 5 | 4.81 | 5 | 4.85 | |
| Disease status at enrollment | .24 | ||||
| New diagnosis | 48 | 46.15 | 46 | 44.66 | |
| Recurrence | 29 | 27.88 | 20 | 19.42 | |
| Progression | 27 | 25.96 | 36 | 34.95 | |
| Do not know | 0 | 0.0 | 1 | 0.97 | |
| Brain metastasis at enrollment | 17 | 16.35 | 18 | 17.48 | .71 |
| Charlson score | 6.3 | 1.62 | 6.21 | 1.86 | .71 |
| Karnofsky performance status | 80.58 | 10.87 | 81.46 | 9.74 | .54 |
| Anticancer treatment at enrollment | |||||
| Chemotherapy | 76 | 73.08 | 80 | 77.67 | .52 |
| Radiotherapy | 20 | 19.23 | 20 | 19.42 | 1.00 |
| In a clinical trial at enrollment | 19 | 18.27 | 8 | 7.77 | .04 |
| Advance directive in medical record at enrollment | |||||
| Living will or durable power of attorney | 39 | 37.5 | 50 | 48.54 | .12 |
| Do not resuscitate order | 12 | 11.54 | 8 | 7.77 | .48 |
| Referral to hospice at enrollment | 3 | 2.88 | 0 | 0.0 | .25 |
NOTE. Percentages may not equal 100% because of rounding.
Abbreviations: CAGE, Cut Down, Annoyed, Guilty, Eye Opener; SD, standard deviation.
Fisher's exact test was used for categorical variables; t test was used for continuous variables.
No participants were of Hispanic ethnicity; three participants did not respond to question.
CAGE acronym represents four questions used in this alcoholism screening questionnaire.
Relative to intervention participation, in-person PC consults were completed for 69 (66%) early (by day 24) and 68 (66%) delayed participants (by day 79). Eighty-eight percent of early and 69% of delayed participants completed ≥ three coaching sessions. Patient participants provided consent within a median of 28 days (interquartile range, 13 to 49) after they were identified using the protocol-defined eligibility criteria (Data Supplement). Decedents' median participation ranged from 240 to 493 days.
QOL, Symptom Impact, and Mood
As summarized in Tables 2 and 3, the intent-to-treat analyses of patient-reported outcomes estimated from the terminal decline model showed no statistically significant differences between the groups 3 months after enrollment (FACIT-Pal: early, 129.9; 95% CI, 126.6 to 133.3 v delayed, 127.2; 95% CI, 124.1 to 130.3; overall P = .34; symptom impact: early, 11.4; 95% CI, 10.8 to 12.1 v delayed, 12.2; 95% CI, 11.6 to 12.8; overall P = .09; CES-D: early, 11.2; 95% CI, 9.7 to 12.7 v delayed, 10.8; 95% CI, 9.5 to 12.1; overall P = .33). Similarly, there were no significant differences in analyses of decedents' outcomes looking backward from death at 12, 6, or 3 months.
Table 2.
Quality of Life, Symptom Impact, and Mood Scores for All Patients After Enrollment
| Instrument | 3 Months From Enrollment (early, n = 72; delayed, n = 83)* |
6 Months From Enrollment (early, n = 57; delayed, n = 56)* |
12 Months From Enrollment (early, n = 29; delayed, n = 28)* |
Overall P | ||||||
|---|---|---|---|---|---|---|---|---|---|---|
| Estimated Mean | 95% CI | ES (E−D)† | Estimated Mean | 95% CI | ES (E−D)† | Estimated Mean | 95% CI | ES (E−D)† | ||
| FACIT-Pal | 0.13 | 0.13 | 0.04 | .34 | ||||||
| Early | 129.9 | 126.6 to 133.3 | 129.9 | 126.6 to 133.3 | 129.9 | 126.51 to 133.26 | ||||
| Delayed | 127.2 | 124.1 to 130.3 | 127.2 | 124.1 to 130.3 | 129.1 | 125.8 to 132.4 | ||||
| TOI | 0.11 | 0.11 | 0.11 | .24 | ||||||
| Early | 99.5 | 96.5 to 102.4 | 99.5 | 96.5 to 102.4 | 99.4 | 96.4 to 102.4 | ||||
| Delayed | 97.7 | 94.9 to 100.5 | 97.7 | 94.9 to 100.6 | 99.8 | 96.8 to 102.8 | ||||
| QUAL-E symptom impact subscale | −0.21 | −0.22 | −0.31 | .09 | ||||||
| Early | 11.4 | 10.8 to 12.1 | 11.4 | 10.7 to 12.1 | 11.5 | 10.8 to 12.2 | ||||
| Delayed | 12.2 | 11.6 to 12.8 | 12.2 | 11.6 to 12.8 | 12.6 | 11.9 to 13.3 | ||||
| CES-D | 0.04 | 0.04 | 0.10 | .33 | ||||||
| Early | 11.2 | 9.7 to 12.7 | 11.2 | 9.6 to 12.7 | 11.2 | 9.7 to 12.7 | ||||
| Delayed | 10.8 | 9.5 to 12.1 | 10.8 | 9.4 to 12.1 | 10.1 | 8.7 to 11.5 | ||||
Abbreviations: CES-D, Center for Epidemiologic Studies–Depression scale; E−D, early minus delayed; ES, effect size; FACIT-Pal, Functional Assessment of Chronic Illness Therapy–Palliative Care; QUAL-E, Quality of Life at End of Life; TOI, Treatment Outcome Index.
No. of patients represent estimated No. alive at that time point.
Cohen's d.
Table 3.
Quality of Life, Symptom Impact, Mood, and Quality of Care Scores Measured Backward From Death
| Instrument | 12 Months Before Death (early, n = 16; delayed, n = 18)* |
6 Months Before Death (early, n = 36; delayed, n = 44)* |
3 Months Before Death (early, n = 40; delayed, n = 53)* |
Overall P | ||||||
|---|---|---|---|---|---|---|---|---|---|---|
| Estimated Mean | 95% CI | ES (E−D)† | Estimated Mean | 95% CI | ES (E−D)† | Estimated Mean | 95% CI | ES (E−D)† | ||
| FACIT-Pal | 0.07 | 0.09 | 0.18 | .73 | ||||||
| Early | 132.6 | 127.9 to 137.3 | 132.8 | 127.0 to 138.6 | 122.2 | 117.2 to 127.1 | ||||
| Delayed | 131.0 | 126.9 to 135.0 | 130.9 | 126.4 to 135.5 | 118.3 | 113.7 to 122.9 | ||||
| TOI | 0.001 | 0.01 | 0.26 | .48 | ||||||
| Early | 101.6 | 97.5 to 105.7 | 101.6 | 96.6 to 106.7 | 92.3 | 87.9 to 96.7 | ||||
| Delayed | 101.5 | 98.0 to 105.0 | 101.5 | 97.5 to 105.4 | 88.2 | 84.1 to 92.3 | ||||
| QUAL-E symptom impact subscale | −0.08 | −0.05 | −0.19 | .30 | ||||||
| Early | 12 | 10.9 to 13.1 | 12.1 | 10.7 to 13.4 | 10.4 | 9.4 to 11.5 | ||||
| Delayed | 12.3 | 11.2 to 13.4 | 12.3 | 11.0 to 13.5 | 11.2 | 10.3 to 12.1 | ||||
| CES-D | 0.003 | −0.02 | −0.06 | .82 | ||||||
| Early | 9.8 | 6.3 to 13.4 | 9.5 | 4.9 to 14.3 | 12.8 | 9.8 to 15.7 | ||||
| Delayed | 9.8 | 8.00 to 11.6 | 9.8 | 7.8 to 11.8 | 13.4 | 11.3 to 15.5 | ||||
Abbreviations: CES-D, Center for Epidemiologic Studies–Depression scale; E−D, early minus delayed; ES, effect size; FACIT-Pal, Functional Assessment of Chronic Illness Therapy–Palliative Care; QUAL-E, Quality of Life at End of Life; TOI, Treatment Outcome Index.
No. of patients represent estimated No. alive at that time point.
Cohen's d.
One-Year and Overall Survival
Of 207 participants, 109 (53%) had died by the end of data collection (September 5, 2013). Figure 2 Kaplan-Meier curves illustrate a 15% difference at 1 year (early group, 63% v delayed group, 48%; P = .038). Overall median survival was 18.3 months for the early group (n = 50) and 11.8 months for the delayed group (n = 59). However, the overall log-rank test was not significant (P = .18), suggesting a convergence in overall survival after 12 months.
Fig 2.
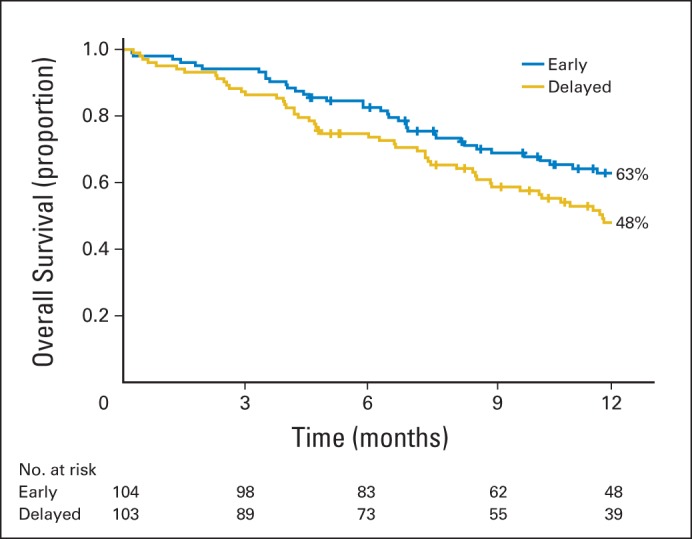
Kaplan-Meier estimates of 1-year survival by treatment group.
Resource Use and Location of Death
At baseline, early group participants had a statistically lower rate of hospital use 3 months before enrollment but a trend toward higher ICU days (Table 4). Early decedents' relative rates of hospital, ICU days, and ED visits were lower compared with the delayed group but not statistically significant. The estimated relative rate of chemotherapy use in the last 2 weeks of life was not statistically different (1.57; 95% CI, 0.37 to 6.7; P = .54). Just more than half of early (54%; n = 27) and 47% (n = 28; P = .60) of delayed entry decedents died at home; 80% did so with hospice services (Appendix Table A2, online only).
Table 4.
Decedents' Rate of Resource Use Over Study Period (n = 109)
| Resource | Early Group (decedents, n = 50)* |
Delayed Group (decedents, n = 59)* |
Relative Rate† | 95% CI | P | ||
|---|---|---|---|---|---|---|---|
| Rate | 95% CI | Rate | 95% CI | ||||
| Hospital days | |||||||
| Baseline (total sample) | 0.69 | 0.4 to 1.18 | 1.39 | 0.97 to 1.97 | 0.5 | 0.26 to 0.94 | .03 |
| Total use | 0.95 | 0.61 to 1.46 | 1.3 | 0.91 to 1.86 | 0.73 | 0.41 to 1.27 | .26 |
| ICU days | |||||||
| Baseline (total sample) | 0.52 | 0.28 to 0.95 | 0.22 | 0.1 to 0.5 | 2.32 | 0.85 to 6.37 | .10 |
| Total use | 0.1 | 0.04 to 0.24 | 0.15 | 0.07 to 0.3 | 0.68 | 0.23 to 2.02 | .49 |
| ED visits | |||||||
| Baseline (total sample) | 0.16 | 0.1 to 0.25 | 0.21 | 0.15 to 0.31 | 0.75 | 0.41 to 1.34 | .32 |
| Total use | 0.14 | 0.09 to 0.2 | 0.19 | 0.14 to 0.26 | 0.73 | 0.45 to 1.19 | .21 |
| Chemotherapy in last 2 weeks of life | 0.08 | 0.03 to 0.2 | 0.05 | 0.02 to 0.15 | 1.57 | 0.37 to 6.7 | .54 |
| Hospice use | 0.68 | 0.55 to 0.84 | 0.63 | 0.51 to 0.78 | 1.08 | 0.8 to 1.45 | .62 |
Abbreviations: ED, emergency department; ICU, intensive care unit.
Mean months from enrollment to death among decedents: early, 9.53 (standard deviation, 7.24); delayed, 7.82 (standard deviation, 6.25).
Delayed group as reference.
DISCUSSION
To our knowledge, this is the first study to evaluate the optimal timing of initiating PC concurrently with standard oncology care using an outpatient PC consultation and telehealth follow-up model that was specifically tailored for patients with advanced cancer in a rural setting.4,7 Unlike our prior RCT comparing early PC with usual oncology care, comparison group patients in this study received PC after a 3-month delay.15,16 This design allowed us to compare intervention with usual care at 3 months. We found no statistical differences in patient-reported outcomes; however, at 1 year, a 15% survival advantage was noted in the early-entry group (P = .038).
Our finding of a 15% improvement in 1-year survival in patients with advanced cancer of mixed diagnoses receiving early (v 3-month delayed) PC is consistent with the improved survival noted by Temel et al6 in their early PC study in patients with non–small-cell lung cancer only (11.6 v 8.9 months; P = .02). These consistent findings suggest that concurrent PC provided soon after diagnosis confers a survival benefit by a mechanism that is yet to be defined. Those findings, together with improved QOL and mood, served as the basis for the recommendation of early PC for all patients with cancer with metastatic disease and/or high symptom burden.1
Unlike that by Temel et al6,35 and our prior study,4 the current study did not demonstrate statistically significant improvement in QOL or mood related to early PC. If QOL and mood are presumed to be the mechanisms of improved survival, our results raise the question of how survival improvement occurred. There are several plausible explanations. First, in retrospect, we predicted an overly ambitious recruitment rate for a 3-year study. A reduced sample size and power could have prevented us from detecting differences (type II error) in patient-reported outcomes, as indicated by our revised power calculations. Second, it is possible that a 3-month delay was not long enough to observe potential PC benefits. In our prior study4 and in a recent cluster RCT,36 symptom distress levels were low at 3 months, and intervention effects on patient-reported outcomes were not apparent until month 4. Third, it is possible that survival benefits occurred from unmeasured PC effects. For example, delaying exposure to advance care planning and decision support may have affected these patients' overall decisions.33,37 Although chemotherapy use at baseline and use before death were similar in the current study, intermediate treatment choices were not measured. Less aggressive treatment choices or earlier hospice use—purported mechanisms of longer survival in advanced cancer35,37,38—could explain the PC survival advantage in the early-entry group.
Despite favorable QOL, early PC studies have shown mixed responses for symptom intensity.1,5,36 In an effort to capture the multidimensional symptom burden construct (eg, severity, bother, and worry) rather than just intensity, we chose the multidimensional QUAL-E symptom impact subscale.27 However, this measure showed little variation even as patients approached death, as evidenced by the lack of within-group differences between time points in the analysis looking forward 3 months after enrollment (Table 2) and in the analysis looking backward from death (Table 3). In those analyses, delayed decedents' mean scores in the year before death varied by < 1 point within a possible 16-point range. Whether this represents measurement insensitivity, a ceiling effect, or a stabilizing effect from the intervention effect requires further exploration.
Early PC has demonstrated a positive impact on economic outcomes.39 The rate of 0.95 hospital days per month in early-entry group compares favorably with Medicare recipients' national average of 1.7 and New Hampshire average of 1.4 days per month in the last 6 months of life.40,41 This finding is salient, given the younger mean age in our sample, because these patients are more likely to be hospitalized to receive aggressive end-of-life care.42 Similarly, chemotherapy use in our sample in the last 14 days averaged 7% (reported as relative rate), comparing favorably with the rate of 17.5% noted by Temel et al.6 Furthermore, more than half of decedents had home deaths, with 80% having hospice support, consistent with conclusions of an early PC Cochrane review showing that patients receiving PC were twice as likely to have a home death compared with patients without early PC.5
The optimal timing of initiating PC requires further study. In 2012, PC via hospice had a duration of 18.7 days.43 The average time from PC referral to death ranged from 41 to 90 days in a national cancer center survey.44 In our study, decedents' median participation was 240 to 493 days. As a result, we had ample time, in a convenient home setting, to develop relationships with and introduce essential PC21 and high-quality cancer care,45 including symptom management, communication, decision making, and advance care planning, to a rural population with typically low access.
Study limitations should be noted. First, although we did not detect differences in disease or sex between participants and nonparticipants, differences in unmeasured characteristics could limit practice applicability. Second, racial and ethnic homogeneity reflects the northern New England population. Third, clinicians were at liberty to refer patients to the clinical PC team whenever they deemed it necessary; half of the delayed patients' who received their PC consults did so earlier than prescribed by the protocol, which may have diluted the intervention impact. Fourth, outcomes of intent-to-treat analyses included participants who did not complete all intervention components. Future analyses will explore intervention dose impact on study outcomes. Fifth, despite our attempt to standardize disease stage and study entry point, it is not known how sample heterogeneity may have affected study outcomes. Sixth, we did not choose a single primary outcome, resulting in the potential implication of an inflated type I error rate. Finally, regional PC quality improvement efforts,2 publication of early PC advantages,1,4,6 and growing acceptance of early PC as a care standard13,14 may have created selection biases and affected our ability to reach the needed accrual target to reject the null hypothesis.
The American Society of Clinical Oncology1 and others46 agree on early integration of PC and oncology care. The challenge now is to determine the optimal timing, essential elements, and personnel to deliver this high-quality cancer care. Our study supports the association between early PC and improved survival; however, PC mechanisms remain elusive.
Supplementary Material
Acknowledgment
We thank members of Dartmouth-Hitchcock Section of Palliative Medicine (Ira Byock, MD, Sharona Sachs, MD, and Sandra Knowlton-Soho, RN) and the nurse practitioners, physicians, and staff of the Section of Hematology/Oncology (James Rigas, MD, and Marc Pipas, MD); Veterans Affairs Medical Center (VAMC; White River Junction, VT; Stefan Balan, MD, Luann Graves, Lisa Lambert, MD, Nancy Kuemmerle, DO, PhD, and Sarah Colson, APRN); Mountainview Medical Center (Berlin, VT; John Valentine, MD, and Elaine Owen, APRN); the Dartmouth-Hitchcock Norris Cotton Cancer Center South staff; St Joseph Medical Center, (Nashua, NH); VAMC (Providence, RI; Katherine Farisy-Anderson, MD); the nurse interventionists (Peggy Bishop, MS, APRN, Peggy Plunkett, MSN, APRN, Lynn Devlin, MS, APRN, Ellen Thompson, MS, RN, Nancy Redfield, APRN, J. Nicholas Dionne-Odom, PhD, RN, Nichole L. Sorenson, MSN, APRN, and Jennifer Frost, MS, RN); and the study staff (Terry Kneeland, MPH, Daphne Ellis, Ingrid Svensborn, RN, and Linda Kingman). We also thank Imatullah Akyar, PhD, RN, Kristen R. Allen, MPH, and Tasha Smith, PhD, for their help with manuscript review and preparation. Most importantly, we thank all of the patients and caregivers, who were our biggest teachers and contributed to our understanding of their needs as they live with cancer.
Appendix
Table A1.
Baseline Scores for Longitudinal Patient-Reported Outcomes
| Variable | Early Group (n = 104) |
Delayed Group (n = 103) |
P* | ||
|---|---|---|---|---|---|
| No. | % | No. | % | ||
| FACIT-Pal | 127.67 | 21.39 | 124.68 | 21.15 | .31 |
| Physical well-being | 20.48 | 5.76 | 19.18 | 6.37 | .12 |
| Social/family well-being | 22.18 | 4.59 | 22.05 | 4.71 | .84 |
| Emotional well-being | 8.99 | 3.72 | 8.63 | 3.66 | .49 |
| Functional well-being | 16.96 | 6.15 | 16.91 | 6.34 | .96 |
| Additional concerns | 59.07 | 10.24 | 58 | 9.41 | .44 |
| TOI† | 96.51 | 19.52 | 94.09 | 19.69 | .38 |
| QUAL-E symptom impact subscale | 11.84 | 3.63 | 11.52 | 3.7 | .56 |
| CES-D | 14.99 | 10.64 | 13.42 | 9.47 | .27 |
NOTE. Percentages may not equal 100% because of rounding.
Abbreviations: CES-D, Center for Epidemiologic Studies–Depression scale; FACIT-Pal, Functional Assessment of Chronic Illness Therapy–Palliative Care; QUAL-E, Quality of Life at End of Life; TOI, Treatment Outcome Index.
Fisher's exact test was used for categorical variables; t test was used for continuous variables.
TOI is sum of scores on physical well-being, functional well-being, and additional concerns subscales of FACIT-Pal.
Table A2.
Location of Death
| Variable | Early Group (n = 50) |
Delayed Group (n = 59) |
P* | ||
|---|---|---|---|---|---|
| No. | % | No. | % | ||
| Location of death | .60 | ||||
| Home | 27 | 54 | 28 | 47.4 | |
| Hospital/non-ICU† | 11 | 22 | 15 | 25.4 | |
| Hospital/ICU | 3 | 6 | 2 | 3.4 | |
| Hospital/location unknown | 1 | 2 | 3 | 5.1 | |
| Nursing home | 3 | 6 | 0 | 0 | |
| Residential hospice | 1 | 2 | 3 | 5.1 | |
| Other | 2 | 4 | 3 | 5.1 | |
| Missing | 2 | 4 | 4 | 6.8 | |
| Home death with hospice care† | 21 | 77.7 | 23 | 82.2 | |
NOTE. Percentages may not equal 100% because of rounding.
Abbreviation: ICU, intensive care unit.
Fisher's exact test used to compare location of death.
Home death with hospice care is a subset of home death above.
Fig A1.
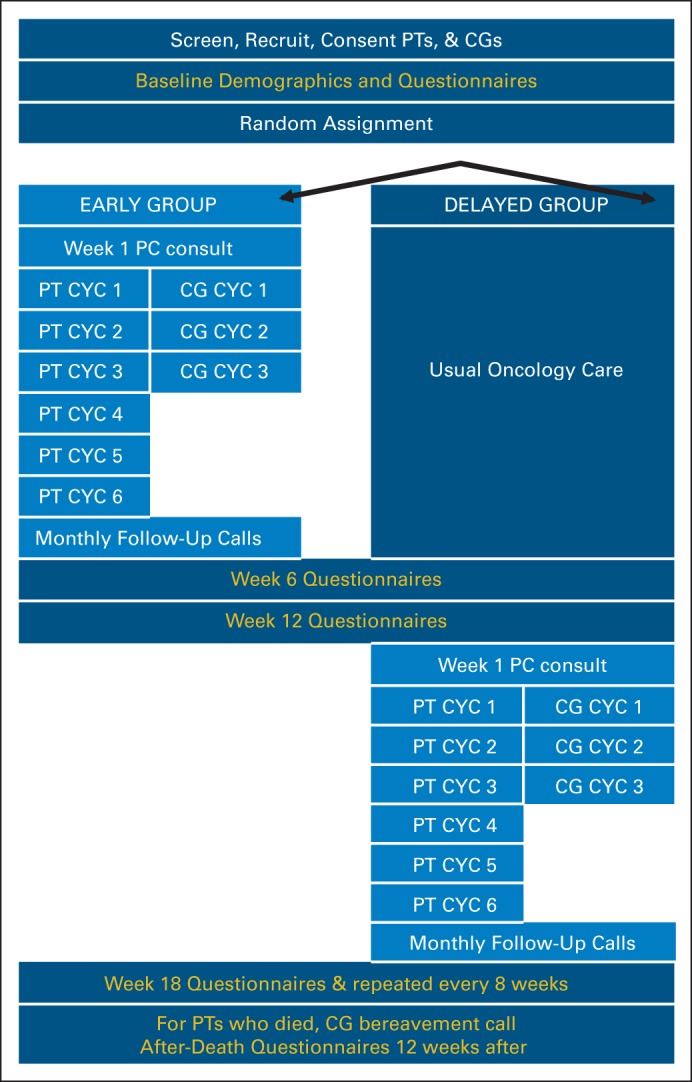
Study schema. CYC, Charting Your Course; FCG, family caregiver; PC, palliative care; PT, patient.
Footnotes
See accompanying editorial on page 1420
Supported by Grant No. R01NR011871-01 from the National Institute for Nursing Research; by a Cancer and Leukemia Group B Foundation Clinical Scholar Award; by the Foundation for Informed Medical Decision-Making; by Grants No. P30CA023108, UL1 TR001086, and R03NR014915; an NIH/NINR Small Research Grant 1R03NR014915-01 (Zhigang Li); by Norris Cotton Cancer Center pilot funding; by the Dartmouth-Hitchcock Section of Palliative Medicine; by a National Palliative Care Research Center Junior Career Development Award (M.A.B.); by Grant No. 5R25CA047888 from the University of Alabama at Birmingham Cancer Prevention and Control Training Program (J.N.D.-O.); and by Mentored Research Scholar Grant No. MRSG 12-113-01-CPPB in Applied and Clinical Research from the American Cancer Society (K.D.L.).
Presented at the 50th Annual Meeting of the American Society of Clinical Oncology, Chicago, IL, May 30-June 3, 2014.
Authors' disclosures of potential conflicts of interest are found in the article online at www.jco.org. Author contributions are found at the end of this article.
Clinical trial information: NCT01245621.
AUTHORS' DISCLOSURES OF POTENTIAL CONFLICTS OF INTEREST
Disclosures provided by the authors are available with this article at www.jco.org.
AUTHOR CONTRIBUTIONS
Conception and design: Marie A. Bakitas, Tor D. Tosteson, Zhigang Li, Kathleen D. Lyons, Jay G. Hull, Konstantin H. Dragnev, Mark T. Hegel, Tim A. Ahles
Administrative support: Marie A. Bakitas, Jennifer Frost
Provision of study materials or patients: Marie A. Bakitas, Konstantin H. Dragnev
Collection and assembly of data: Marie A. Bakitas, Kathleen D. Lyons, Zhongze Li, J. Nicholas Dionne-Odom
Data analysis and interpretation: All authors
Manuscript writing: All authors
Final approval of manuscript: All authors
AUTHORS' DISCLOSURES OF POTENTIAL CONFLICTS OF INTEREST
Early Versus Delayed Initiation of Concurrent Palliative Oncology Care: Patient Outcomes in the ENABLE III Randomized Controlled Trial
The following represents disclosure information provided by authors of this manuscript. All relationships are considered compensated. Relationships are self-held unless noted. I = Immediate Family Member, Inst = My Institution. Relationships may not relate to the subject matter of this manuscript. For more information about ASCO's conflict of interest policy, please refer to www.asco.org/rwc or jco.ascopubs.org/site/ifc.
Marie A. Bakitas
No relationship to disclose
Tor D. Tosteson
No relationship to disclose
Zhigang Li
No relationship to disclose
Kathleen D. Lyons
No relationship to disclose
Jay G. Hull
No relationship to disclose
Zhongze Li
No relationship to disclose
J. Nicholas Dionne-Odom
No relationship to disclose
Jennifer Frost
No relationship to disclose
Konstantin H. Dragnev
No relationship to disclose
Mark T. Hegel
Research Funding: Johnson & Johnson
Andres Azuero
No relationship to disclose
Tim A. Ahles
No relationship to disclose
REFERENCES
- 1.Smith TJ, Temin S, Alesi ER, et al. American Society of Clinical Oncology provisional clinical opinion: The integration of palliative care into standard oncology care. J Clin Oncol. 2012;30:880–887. doi: 10.1200/JCO.2011.38.5161. [DOI] [PubMed] [Google Scholar]
- 2.Bakitas M, Bishop MF, Caron P, et al. Developing successful models of cancer palliative care services. Semin Oncol Nurs. 2010;26:266–284. doi: 10.1016/j.soncn.2010.08.006. [DOI] [PMC free article] [PubMed] [Google Scholar]
- 3.Institute of Medicine. Dying in America: Improving Quality and Honoring Individual Preferences Near the End of Life. Washington, DC: National Academies Press; 2014. [PubMed] [Google Scholar]
- 4.Bakitas M, Lyons K, Hegel M, et al. Effects of a palliative care intervention on clinical outcomes in patients with advanced cancer: The Project ENABLE II randomized controlled trial. JAMA. 2009;302:741–749. doi: 10.1001/jama.2009.1198. [DOI] [PMC free article] [PubMed] [Google Scholar]
- 5.Gomes B, Calanzani N, Curiale V, et al. Effectiveness and cost-effectiveness of home palliative care services for adults with advanced illness and their caregivers. Cochrane Database Syst Rev. 2013;6:CD007760. doi: 10.1002/14651858.CD007760.pub2. [DOI] [PMC free article] [PubMed] [Google Scholar]
- 6.Temel JS, Greer JA, Muzikansky A, et al. Early palliative care for patients with metastatic non-small-cell lung cancer. N Engl J Med. 2010;363:733–742. doi: 10.1056/NEJMoa1000678. [DOI] [PubMed] [Google Scholar]
- 7.Bakitas M, Lyons KD, Hegel MT, et al. Project ENABLE II randomized controlled trial to improve palliative care for rural patients with advanced cancer: Baseline findings, methodological challenges, and solutions. Palliat Support Care. 2009;7:75–86. doi: 10.1017/S1478951509000108. [DOI] [PMC free article] [PubMed] [Google Scholar]
- 8.Smith AK, Thai JN, Bakitas MA, et al. The diverse landscape of palliative care clinics. J Palliat Med. 2013;16:661–668. doi: 10.1089/jpm.2012.0469. [DOI] [PMC free article] [PubMed] [Google Scholar]
- 9.Center to Advance Palliative Care, National Palliative Care Research Center. America's Care of Serious Illness: A State-by-State Report Card on Access to Palliative Care in Our Nation's Hospitals. New York, NY: Center to Advance Palliative Care; 2008. [DOI] [PMC free article] [PubMed] [Google Scholar]
- 10.Bakitas M, Clifford K, Dionne-Odom JN, et al. Rural palliative care. In: Ferrell BR, Coyle N, editors. Oxford Textbook of Palliative Nursing (ed 4) Oxford, United Kingdom: Oxford University Press; 2014. [Google Scholar]
- 11.Bakitas M, Ahles TA, Skalla K, et al. Proxy perspectives regarding end-of-life care for persons with cancer. Cancer. 2008;112:1854–1861. doi: 10.1002/cncr.23381. [DOI] [PMC free article] [PubMed] [Google Scholar]
- 12.Bakitas M, Stevens M, Ahles T, et al. Project ENABLE: A palliative care demonstration project for advanced cancer patients in three settings. J Palliat Med. 2004;7:363–372. doi: 10.1089/109662104773709530. [DOI] [PubMed] [Google Scholar]
- 13.Maloney C, Lyons KD, Li Z, et al. Patient perspectives on participation in the ENABLE II randomized controlled trial of a concurrent oncology palliative care intervention: Benefits and burdens. Palliat Med. 2013;27:375–383. doi: 10.1177/0269216312445188. [DOI] [PMC free article] [PubMed] [Google Scholar]
- 14.Bakitas M, Lyons KD, Hegel MT, et al. Oncologists' perspectives on concurrent palliative care in a National Cancer Institute-designated comprehensive cancer center. Palliat Support Care. 2013;11:415–423. doi: 10.1017/S1478951512000673. [DOI] [PMC free article] [PubMed] [Google Scholar]
- 15.Farquhar M, Higginson IJ, Booth S. Fast-track trials in palliative care: An alternative randomized controlled trial design. J Palliat Med. 2009;12:213. doi: 10.1089/jpm.2008.0267. [DOI] [PubMed] [Google Scholar]
- 16.Higginson IJ, Vivat B, Silber E, et al. Study protocol: Delayed intervention randomised controlled trial within the Medical Research Council (MRC) framework to assess the effectiveness of a new palliative care service. BMC Palliat Care. 2006;5:7. doi: 10.1186/1472-684X-5-7. [DOI] [PMC free article] [PubMed] [Google Scholar]
- 17.Dionne-Odom JN, Azuero A, Lyons KD, et al. Benefits of immediate vs. delayed palliative care to informal family caregivers of persons with advanced cancer: Outcomes from the ENABLE III randomized controlled trial. J Clin Oncol. 2014;32(suppl 15s):605s. abstr LBA9513. [Google Scholar]
- 18.Callahan CM, Unverzagt FW, Hui SL, et al. Six-item screener to identify cognitive impairment among potential research subjects. Med Care. 2002;40:771–781. doi: 10.1097/00005650-200209000-00007. [DOI] [PubMed] [Google Scholar]
- 19.O'Hara RE, Hull JG, Lyons KD, et al. Impact on caregiver burden of a patient-focused palliative care intervention for patients with advanced cancer. Palliat Support Care. 2010;8:395–404. doi: 10.1017/S1478951510000258. [DOI] [PMC free article] [PubMed] [Google Scholar]
- 20.National Cancer Institute. Research-Tested Intervention Programs: Project ENABLE II. http://rtips.cancer.gov/rtips/programDetails.do?programId=3590238.
- 21.National Consensus Project. Clinical Practice Guidelines for Quality Palliative Care (ed 3) Brooklyn, NY: National Consensus Project for Quality Palliative Care; 2013. [Google Scholar]
- 22.Jacobsen J, Jackson V, Dahlin C, et al. Components of early outpatient palliative care consultation in patients with metastatic nonsmall cell lung cancer. J Palliat Med. 2011;14:459–464. doi: 10.1089/jpm.2010.0382. [DOI] [PubMed] [Google Scholar]
- 23.Steinhauser KE, Alexander SC, Byock IR, et al. Do preparation and life completion discussions improve functioning and quality of life in seriously ill patients? Pilot randomized control trial. J Palliat Med. 2008;11:1234–1240. doi: 10.1089/jpm.2008.0078. [DOI] [PubMed] [Google Scholar]
- 24.Steinhauser KE, Clipp EC, Hays JC, et al. Identifying, recruiting, and retaining seriously-ill patients and their caregivers in longitudinal research. Palliat Med. 2006;20:745–754. doi: 10.1177/0269216306073112. [DOI] [PubMed] [Google Scholar]
- 25.Steinhauser KE, Christakis NA, Clipp EC, et al. Preparing for the end of life: Preferences of patients, families, physicians, and other care providers. J Pain Symptom Manage. 2001;22:727–737. doi: 10.1016/s0885-3924(01)00334-7. [DOI] [PubMed] [Google Scholar]
- 26.Lyons KD, Bakitas M, Hegel MT, et al. Reliability and validity of the Functional Assessment of Chronic Illness Therapy-Palliative care (FACIT-Pal) scale. J Pain Symptom Manage. 2009;37:23–32. doi: 10.1016/j.jpainsymman.2007.12.015. [DOI] [PMC free article] [PubMed] [Google Scholar]
- 27.Steinhauser KE, Clipp EC, Bosworth HB, et al. Measuring quality of life at the end of life: Validation of the QUAL-E. Palliat Support Care. 2004;2:3–14. doi: 10.1017/s1478951504040027. [DOI] [PubMed] [Google Scholar]
- 28.Radloff L. The CES-D scale: A self report depression scale for research in the general population. Appl Psychol Meas. 1977;1:385–401. [Google Scholar]
- 29.Okun A, Stein R, Buman L, et al. Content validity of the Psychiatric Symptom Index, CES-depression scale, and State-Trait Anxiety Inventory from the perspective of DSM-IV. Psychol Rep. 1996;79:1059–1069. doi: 10.2466/pr0.1996.79.3.1059. [DOI] [PubMed] [Google Scholar]
- 30.Li Z, Tosteson TD, Bakitas MA. Joint modeling quality of life and survival using a terminal decline model in palliative care studies. Stat Med. 2013;32:1394–1406. doi: 10.1002/sim.5635. [DOI] [PMC free article] [PubMed] [Google Scholar]
- 31.Little JA, Rubin DB. Statistical Analysis With Missing Data (ed 2) Chichester, United Kingdom: John Wiley & Sons; 2002. [Google Scholar]
- 32.Cuijpers P, Turner EH, Mohr DC, et al. Comparison of psychotherapies for adult depression to pill placebo control groups: A meta-analysis. Psychol Med. 2014;44:685–695. doi: 10.1017/S0033291713000457. [DOI] [PubMed] [Google Scholar]
- 33.Parikh RB, Kirch RA, Smith TJ, et al. Early specialty palliative care: Translating data in oncology into practice. N Engl J Med. 2013;369:2347–2351. doi: 10.1056/NEJMsb1305469. [DOI] [PMC free article] [PubMed] [Google Scholar]
- 34.Haun MW, Estel S, Rücker G, et al. Early palliative care for improving quality of life and survival time in adults with advanced cancer (protocol) Cochrane Database Syst Rev. 2014;5:CD011129. doi: 10.1002/14651858.CD011129.pub2. [DOI] [PMC free article] [PubMed] [Google Scholar]
- 35.Pirl WF, Greer JA, Traeger L, et al. Depression and survival in metastatic non–small-cell lung cancer: Effects of early palliative care. J Clin Oncol. 2012;30:1310–1315. doi: 10.1200/JCO.2011.38.3166. [DOI] [PMC free article] [PubMed] [Google Scholar]
- 36.Zimmermann C, Swami N, Krzyzanowska M, et al. Early palliative care for patients with advanced cancer: A cluster-randomised controlled trial. Lancet. 2014;383:1721–1730. doi: 10.1016/S0140-6736(13)62416-2. [DOI] [PubMed] [Google Scholar]
- 37.Greer JA, Pirl WF, Jackson VA, et al. Effect of early palliative care on chemotherapy use and end-of-life care in patients with metastatic non–small-cell lung cancer. J Clin Oncol. 2012;30:394–400. doi: 10.1200/JCO.2011.35.7996. [DOI] [PubMed] [Google Scholar]
- 38.Younis T, Milch R, Abul-Khoudoud N, et al. Length of survival of patients with cancer in hospice: A retrospective analysis of patients treated at a major cancer center versus other practice settings. J Palliat Med. 2007;10:381–389. doi: 10.1089/jpm.2006.0071. [DOI] [PubMed] [Google Scholar]
- 39.Meier DE. Increased access to palliative care and hospice services: Opportunities to improve value in health care. Milbank Q. 2011;89:343–380. doi: 10.1111/j.1468-0009.2011.00632.x. [DOI] [PMC free article] [PubMed] [Google Scholar]
- 40.Dartmouth Atlas of Health Care. Inpatient days per decedent during the last six months of life, by gender and level of care intensity. http://www.dartmouthatlas.org/data/map.aspx?ind=85&ch=32%2c9&tf=10&loct=3&extent=-14071323.410590487%202305693.8872850095%20-7398676.589409513%206806306.112714991.
- 41.Morden NE, Chang CH, Jacobson JO, et al. End-of-life care for Medicare beneficiaries with cancer is highly intensive overall and varies widely. Health Aff (Millwood) 2012;31:786–796. doi: 10.1377/hlthaff.2011.0650. [DOI] [PMC free article] [PubMed] [Google Scholar]
- 42.Tang ST, Wu SC, Hung YN, et al. Determinants of aggressive end-of-life care for Taiwanese cancer decedents, 2001 to 2006. J Clin Oncol. 2009;27:4613–4618. doi: 10.1200/JCO.2008.20.5096. [DOI] [PubMed] [Google Scholar]
- 43.National Hospice and Palliative Care Organization. NHPCO's Facts and Figures on Hospice Care in America (ed 2013) Alexandria, VA: National Hospice and Palliative Care Organization; 2013. [Google Scholar]
- 44.Hui D, Elsayem A, De la Cruz M, et al. Availability and integration of palliative care at US cancer centers. JAMA. 2010;303:1054–1061. doi: 10.1001/jama.2010.258. [DOI] [PMC free article] [PubMed] [Google Scholar]
- 45.Institute of Medicine. Delivering High-Quality Cancer Care: Charting a New Course for a System in Crisis. Washington, DC: National Academies of Science; 2013. [PubMed] [Google Scholar]
- 46.National Comprehensive Cancer Network. NCCN clinical practice guidelines in oncology: Palliative care. http://www.nccn.org/professionals/physician_gls/f_guidelines.asp. [DOI] [PubMed]
Associated Data
This section collects any data citations, data availability statements, or supplementary materials included in this article.