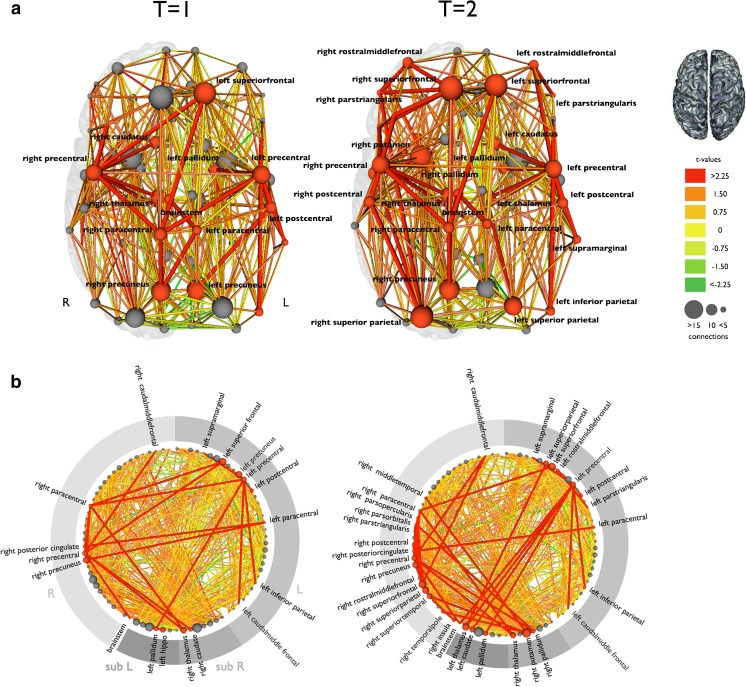
Fig. 2.
Longitudinal structural connectivity changes in amyotrophic lateral sclerosis (ALS). This figure shows the reconstructed structural brain networks, and affected connections in 25 patients with ALS compared with a group of healthy controls at 2 time points. a The affected connections and interconnecting nodes are displayed in red comparing patients at baseline and follow-up (after an average of 5.5 months) with a group of healthy controls. The size of the nodes is determined by their degree (number of structural connections). Nodes and connections are red if they are part of the affected subnetwork. The affected subnetwork at follow-up included more structural connections, extending mainly to frontal and parietal brain regions. b This figure shows all brain regions arranged on a ring. The red nodes and connections are part of the affected subnetwork, showing an increasing number of affected connections and regions at follow-up compared with baseline. R = right; L = left; sub = subcortical structures; T=1 = first time point; T=2 = second time point. Reproduced with permission from Verstraete E, Veldink JH, van den Berg LH, van den Heuvel MP. Structural brain network imaging shows expanding disconnection of the motor system in amyotrophic lateral sclerosis. Hum Brain Mapp 2014;35:1351-1361. Copyright © 2013 Wiley Periodicals, Inc

