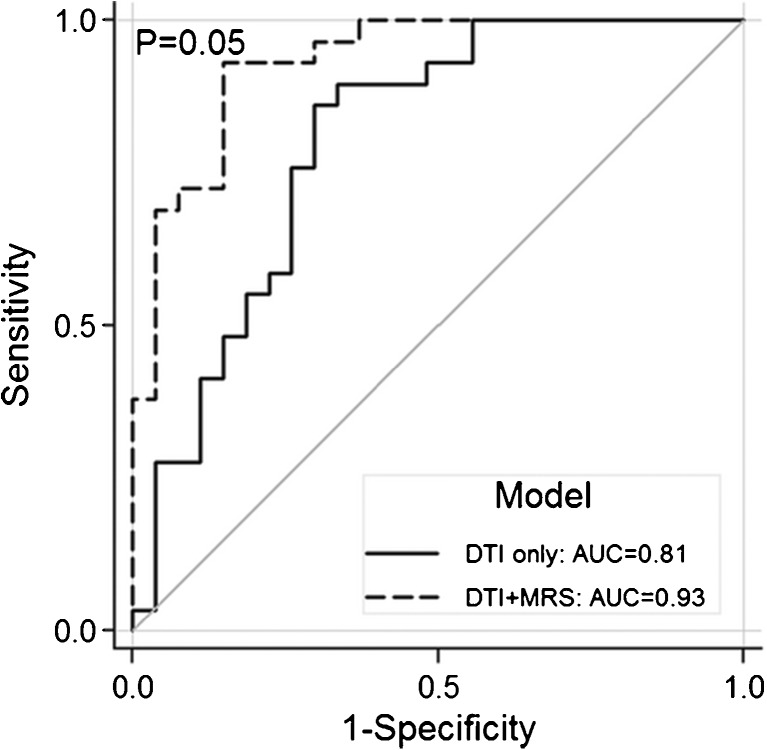
Fig. 4.
Receiver operator curve demonstrating significant increases in added utility of combining magnetic resonance spectroscopy (MRS) and diffusion tensor imagin (DTI) for amyotropic lateral sclerosis. Solid line represents the model using only DTI fractional anisotropy (FA) values of the corticospinal tracts. Dashed line represents the model using DTI FA values of the corticospinal tracts combined with MRS data of the motor cortex. AUC = area under the curve. Reproduced with permission from Foerster BR, Carlos RC, Dwamena BA, et al. Multimodal MRI as a diagnostic biomarker for amytrophic lateral sclerosis. Ann Clin Transl Neurol 2014;1:1-8. Copyright © 2014 Wiley, Inc

