

Abstract
BACKGROUND
Reporting clinically actionable incidental genetic findings in the course of clinical exome testing is recommended by the American College of Medical Genetics and Genomics (ACMG). However, the performance of clinical exome methods for reporting small subsets of genes has not been previously reported.
METHODS
In this study, 57 exome data sets performed as clinical (n =12) or research (n =45) tests were retrospectively analyzed. Exome sequencing data was examined for adequacy in the detection of potentially pathogenic variant locations in the 56 genes described in the ACMG incidental findings recommendation. All exons of the 56 genes were examined for adequacy of sequencing coverage. In addition, nucleotide positions annotated in HGMD (Human Gene Mutation Database) were examined.
RESULTS
The 56 ACMG genes have 18336 nucleotide variants annotated in HGMD. None of the 57 exome data sets possessed a HGMD variant. The clinical exome test had inadequate coverage for >50% of HGMD variant locations in 7 genes. Six exons from 6 different genes had consistent failure across all 3 test methods; these exons had high GC content (76%–84%).
CONCLUSIONS
The use of clinical exome sequencing for the interpretation and reporting of subsets of genes requires recognition of the substantial possibility of inadequate depth and breadth of sequencing coverage at clinically relevant locations. Inadequate depth of coverage may contribute to false-negative clinical exome results.
The American College of Medical Genetics and Genomics (ACMG)9 recommends that every clinical exome test be accompanied with a report on pathogenic findings in 56 genes with well-known clinical importance (1). This controversial guidance (2–7) assumes that the analytical performance of clinical exome sequencing returns DNA sequence data of sufficient quality to assess genetic findings that were not validated during the initial development of the clinical exome test. In prior studies, the coding sequence not covered by exome sequencing has ranged from 1.4% to 39.1% (8–11). The extent of coverage depends on the source of DNA used for sequencing (saliva, white blood cells), biochemical characteristics of the targeted region (e.g., GC content), methodology of sequence enrichment (e.g., liquid phase baits), sequencing technology (e.g., sequence by synthesis), and basic quality parameters (e.g., minimum depth of coverage). Moreover, no general consensus has been reached regarding the establishment and reporting of false-negative rates in clinical exome sequencing. Because the ACMG guideline recommends reporting on pathogenic findings in 56 genes with actionable clinical significance, patients and physicians may expect that these genes have adequate depth and breadth of sequencing coverage in a clinical exome analysis. This study surveyed the potential low sequencing coverage at potentially significant nucleotide positions that may contribute to false-negative reporting of pathogenic variants in the 56 ACMG genes.
Materials and Methods
INSTITUTIONAL REVIEW
We obtained human exome sequencing data from several sources. Data from Thomas Jefferson University and the University of Texas Southwestern Medical Center were obtained under separate research protocols approved by their respective Institutional Review Boards.
EXOME CAPTURE METHODS
The TargetSeq (TargetSeq™ Target Enrichment Kit, Life Technologies), SureSelect v4 (SureSelect™ Human All Exon Target Enrichment System v4+UTR, Agilent Technologies), and TruSeq (TruSeq™ Exome Enrichment Kit, Illumina) exome capture methods were optimized before the analysis of the samples in this study (Table 1). All of the exome capture methods in this study were solution-phase capture. For TargetSeq and SureSelect v4, 3 μg genomic DNA was used. For TruSeq, 1 μg genomic DNA was used.
Table 1.
Overall performance of exome enrichment methods.
| Capture method | Base pairs targeted by method (megabases) | Sequencer | Unique samples examined | Mean uniquely mapped reads (millions) | Mean total base pairs generated (gigabases) | Mean base pairs generated in target regions (gigabases) | Mean read depth in target regions | Mean percentage of targeted coding nucleotides by depth of coverage (%)a | ||
|---|---|---|---|---|---|---|---|---|---|---|
| >5× | >10× | >20× | ||||||||
| SureSelect v4 (Agilent) | 70 | SOLiD 5500xl | 12 | 199 | 7.6 | 3.4 | 120× | 95 | 92 | 87 |
| TargetSeq (LifeTech) | 37 | SOLiD 5500xl | 33 | 206 | 6.7 | 2.8 | 76× | 91 | 89 | 83 |
| TruSeq (Illumina) | 62 | HiSeq 2000 | 12 | 92 | 9.1 | 4.5 | 74× | 93 | 91 | 84 |
SureSelect v4 is designed to target 70 MB including noncoding regions such as untranslated regions; the analysis for coding nucleotide coverage was limited to the 50 MB of coding nucleotides targeted by the method.
GENOMIC DNA AND KIT PREPARATION
Genomic DNA was used in each of the exome evaluations (Table 1). The sample type and method of purification differed for each type of exome evaluation. Samples for TargetSeq and SureSelect v4 capture were prepared from genomic DNA extracted from whole blood extraction kits (QIAamp DNA Midi, Qiagen). TruSeq exome capture was prepared from genomic DNA either extracted from whole blood extraction kits (Gentra Systems Autopure LS, Qiagen) or submitted as purified genomic DNA to a core facility.
SEQUENCING
TargetSeq and SureSelect v4 libraries were sequenced on a SOLiD 5500xl (Life Technologies). SureSelect v4 exome sequencing on the SOLiD 5500xl was validated for clinical use under the US Clinical Laboratory Improvement Amendments; in addition, the laboratory is inspected and accredited by the College of American Pathologists. Illumina TruSeq exome libraries were sequenced on a HiSeq 2000 (Illumina) in a research core facility.
ALIGNMENT AND GENOTYPING
All sequence reads were mapped to the hg19 reference genome (12). We analyzed SOLiD 5500xl sequence reads with an iterative mapping approach using Applied Biosystems LifeScope Genomic Analysis Software v2.5. Each sequence read was allowed to have a maximum of 2 mismatches. Illumina HiSeq 2000 sequence reads were mapped with the Short Read Mapping Package (13). The sequence reads were quality-trimmed with the reads’ associated quality values by use of Cutadapt (14). During mapping, mismatches (replacements) were allowed that did not comprise >4% of a given read’s length; no insertions or deletions were permitted. For all sequence mappings, only those reads mapping uniquely to the human genome were maintained.
CALCULATION OF COVERAGE OF TARGET REGIONS
We calculated coverage across the exome by intersecting sequence reads with the respective exome capture kit bed files (targeted regions) using the Bedcov flag in SamTools (15) and the coveragebed module of BED tools (16). Each application identifies the number of base pairs and number of sequence reads mapping to each region of the bed file.
We examined targeted exons for adequacy of breadth of coverage by setting a minimum depth of coverage at ≥20×. An exon was considered to have a low breadth of coverage for a specific exome method if any base position within the exon of interest had <20× depth of coverage in more than half of the samples examined.
We also determined depth of coverage for nucleotide positions in the 56 ACMG genes that may be reported as sites of clinically significant variants. Single-nucleotide variants (SNVs) that have been reported to occur within the 56 ACMG genes were extracted from HGMD® (Human Gene Mutation Database) Professional 2013.4 (BIOBASE Biological Databases). The SNVs categorized by HGMD as “DM” [disease causing (pathological) mutation] were further analyzed. These DM variants were then used to create a BED file for the determination of the depth of coverage.
Results
The exome sequencing data sets examined in the present study demonstrated the heterogeneity of performance among various methods (Table 1). TargetSeq and SureSelect v4 had the highest number of mapped reads, with means of 206 million and 199 million, respectively. In terms of base pairs generated in the designed target regions, SureSelect v4 and TruSeq were the highest, at 7.6 giga-bases and 9.1 gigabases, respectively. All of the data sets examined had a mean depth of coverage across all target regions ranging from 74× to 120×. The depth of coverage was inversely correlated with the coverage of target regions. At the low end of stringency (>5×), the lowest coverage of target regions was 91%; however, with higher stringency (>20×), the best method covered only 87% of target regions (SureSelect v4). The SureSelect v4 (clinical method) had 92% of targeted nucleotides covered at >10×. In comparison, a recent survey of clinical exome laboratories demonstrates a typical metric of >10× depth of coverage for 90%–95% of target nucleotides (17).
The 56 genes cited in the ACMG guideline have a total of 18336 SNVs annotated in HGMD as pathogenic (DM). None of these HGMD DM variants were identified in any of the samples examined. The nucleotide positions of the 18336 HGMD pathogenic sequence variants were examined for depth of coverage. Although a recent next generation sequencing laboratory standard described the use of depth of coverage between 10× and 20× at a given nucleotide position (18), the present study used a minimum depth of coverage of >20× at a nucleotide position on the basis of studies examining the depth of coverage necessary for accurate base calling (8, 10, 11, 19–21).
When the 3 exome methods were compared by HGMD variant locations, substantial differences were seen in both design and sequencing coverage (Fig. 1). The Venn diagram shows the variant locations that were not in the capture probe designs for the 3 methods examined. A high number of variant locations were not directly covered in the capture probe designs of SureSelect, TargetSeq, and TruSeq (2352, 1779, and 719, respectively) (Fig. 1A). In addition to the variants not covered in the method design, the number of variant locations with low depth of sequencing coverage (<20×) also examined for SureSelect, TargetSeq, and TruSeq are 842, 1295, and 1269, respectively (Fig. 1B). In the sequencing results of the 3 methods, low coverage was seen for multiple variant locations, but the sequencing coverage was better than the designed capture probe coverage for SureSelect and TargetSeq. Although the variant locations may be absent in the designed capture probes, the variant location may be sequenced if a nearby region has a successful capture.
Fig. 1. Overlap of low-coverage HGMD variant positions in 3 exome methods.
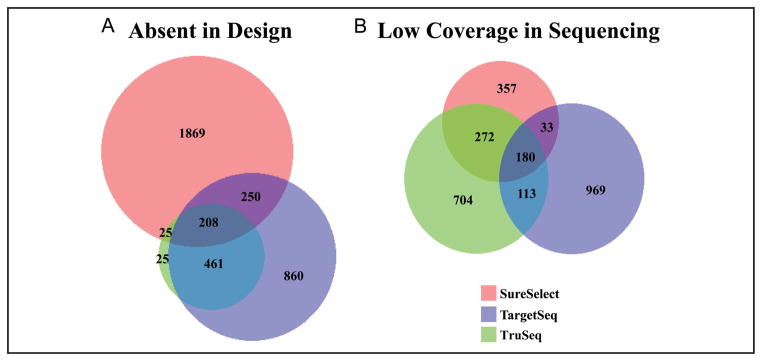
The nucleotide positions of 18336 HGMD pathogenic variants in the 56 ACMG genes were examined for absence from the design of 3 exome capture kits (A). In addition, exome sequencing from the 3 kits was examined for low depth of coverage (<20×) of the 18336 HGMD pathogenic variants in at least half of the samples examined for each kit (B). SureSelect (n = 12), TargetSeq (n = 33), TruSeq (n = 12).
An aggregate analysis of the clinical exome test for HGMD variant coverage in each of the 56 ACMG genes was performed (Fig. 2). The heterogeneity of coverage in terms of the percentage of variants with ≤10× or ≤20× depth of coverage can be seen for each gene. The clinical exome aggregate data had 4 genes [SDHD (succinate dehydrogenase complex, subunit D, integral membrane protein),10 PMS2 (PMS2 postmeiotic segregation increased 2 [S. cerevisiae]), PCSK9 (proprotein convertase subtilisin/kexin type 9), and KCNH2 (potassium voltage-gated channel, subfamily H [eag-related], member 2)] for which >20% of HGMD variants had a median inadequate (≤20×) depth of coverage. However, with this aggregate analysis, the overall percentage of variants in the 56 genes with inadequate coverage was <10%.
Fig. 2. Percentage of HGMD variant locations with low depth of coverage.

The 2 graphs compare the percentage of HGMD SNV locations covered by the SureSelect exome method (n=12) for each of the 56 ACMG genes. The y axis is a list of each of the 56 genes. The x axis is the percentage of variant locations with ≤ 10× coverage (leftpanel) or ≤20× coverage (rightpanel). For each graph, the median is the bolded hash mark within the rectangle. The left end of the rectangle is the 25th percentile, and the right end of the rectangle is the 75th percentile. The whiskers extend to ± 1SD from the mean. For both the gene symbols and names of the genes used in this figure, see the human genes footnote in this article.
For each exome capture methodology, individual exons within the ACMG genes were also examined for consistent adequacy of coverage (>20×) at HGMD variant positions (Table 2). For example, the gene ACTC1 (actin, alpha, cardiac muscle 1) had 15 unique variant locations with low depth of coverage across the 12 samples sequenced by SureSelect; this resulted in 39% (15/38) of ACTC1 HGMD variant locations having inadequate coverage across all 12 SureSelect Samples. By this analysis, SureSelect had 7 genes [SDHD, TGFBR2 (transforming growth factor, β receptor II [70/80 kDa]), GLA (galactosidase, α), SDHC (succinate dehydrogenase complex, subunit C, integral membrane protein, 15 kDa), COL3A1 (collagen, type III, α1), PMS2, PSCK9] for which >50% of HGMD variant locations had inadequate coverage. TargetSeq and TruSeq had 38 and 9 genes, respectively, with inadequate coverage in >50% of variant locations. For TargetSeq, 5 genes had >80% of HGMD variant locations with inadequate coverage. TruSeq had 4 genes with >80% of HGMD variant locations with inadequate coverage; 2 of these genes [SDHAF2 (succinate dehydrogenase complex assembly factor 2) and GLA] had inadequate coverage at 100% of HGMD variant locations.
Table 2.
HGMD variants with low coverage.
| ACMG genea | HGMD variants | Unique variant position with low coverageb | ||
|---|---|---|---|---|
| SureSelect | TargetSeq | TruSeq | ||
| ACTC1 | 38 | 15 | 18 | 12 |
| ACTA2 | 24 | 6 | 4 | 9 |
| APC | 1528 | 391 | 397 | 577 |
| APOB | 132 | 17 | 42 | 56 |
| BRCA1 | 1219 | 262 | 321 | 414 |
| BRCA2 | 1159 | 174 | 582 | 565 |
| CACNA1S | 14 | 0 | 6 | 6 |
| COL3A1 | 224 | 122 | 138 | 56 |
| DSC2 | 33 | 13 | 21 | 17 |
| DSG2 | 50 | 9 | 27 | 14 |
| DSP | 89 | 18 | 52 | 23 |
| FBN1 | 1403 | 336 | 547 | 621 |
| GLA | 670 | 401 | 397 | 670 |
| KCNH2 | 683 | 237 | 448 | 167 |
| KCNQ1 | 444 | 52 | 327 | 85 |
| LDLR | 1445 | 317 | 1159 | 324 |
| LMNA | 323 | 112 | 252 | 54 |
| MEN1 | 567 | 174 | 443 | 110 |
| MLH1 | 676 | 281 | 422 | 238 |
| MSH2 | 623 | 255 | 273 | 450 |
| MSH6 | 236 | 37 | 101 | 0 |
| MUTYH | 90 | 2 | 77 | 75 |
| MYBPC3 | 457 | 87 | 366 | 55 |
| MYH11 | 12 | 3 | 5 | 1 |
| MYH7 | 456 | 149 | 221 | 62 |
| MYL2 | 17 | 1 | 10 | 8 |
| MYL3 | 16 | 6 | 12 | 5 |
| MYLK | 2 | 0 | 0 | 1 |
| NF2 | 313 | 133 | 229 | 96 |
| PCSK9 | 34 | 18 | 22 | 2 |
| PKP2 | 127 | 42 | 69 | 61 |
| PMS2 | 70 | 38 | 32 | 16 |
| PRKAG2 | 15 | 1 | 4 | 6 |
| PTEN | 405 | 165 | 128 | 29 |
| RB1 | 595 | 211 | 446 | 386 |
| RET | 276 | 121 | 219 | 48 |
| RYR1 | 410 | 102 | 262 | 107 |
| RYR2 | 170 | 34 | 46 | 87 |
| SCN5A | 624 | 130 | 348 | 174 |
| SDHAF2 | 3 | 1 | 2 | 3 |
| SDHB | 169 | 69 | 96 | 78 |
| SDHC | 33 | 18 | 17 | 28 |
| SDHD | 122 | 89 | 92 | 9 |
| SMAD3 | 16 | 5 | 14 | 6 |
| STK11 | 235 | 75 | 197 | 26 |
| TGFBR1 | 42 | 12 | 9 | 27 |
| TGFBR2 | 96 | 59 | 63 | 29 |
| TMEM43 | 3 | 0 | 2 | 1 |
| TNNI3 | 59 | 22 | 36 | 5 |
| TNNT2 | 75 | 9 | 39 | 7 |
| TP53 | 285 | 73 | 178 | 19 |
| TPM1 | 33 | 5 | 17 | 15 |
| TSC1 | 256 | 86 | 96 | 78 |
| TSC2 | 723 | 188 | 565 | 106 |
| VHL | 392 | 44 | 299 | 184 |
| WT1 | 125 | 47 | 81 | 61 |
For both the gene symbols and names of the genes used in this table, see the human genes footnote in this article.
Total number of HGMD variant locations with low depth of coverage (<20×) in every sample for each respective capture kit.
We analyzed exons with inadequate coverage in more than half the samples examined for each method (Table 3). Six exons had low coverage in all samples examined by all methods [APOB (apolipoprotein B) exon 1, KCNH2 exon 13, KCNQ1 (potassium voltage-gated channel, KQT-like subfamily, member 1) exon 1, RYR1 (ryanodine receptor 1 [skeletal]) exon 90, SCN5A (sodium channel, voltage-gated, type V, α subunit) exon 1, TGFBR1 (transforming growth factor, β receptor 1) exon 1]. Many of the exons failed by 1 or 2 methods but were adequately covered by another method. The gene with the most exon failures was PMS2 (exons 2, 3, 4, 5, 12, 14, and 15); however, no PMS2 exons with inadequate coverage were seen in the TruSeq data set. The median GC content of all exons with inadequate coverage was 65% (range 20%–84%).
Table 3.
Exons with frequent low coverage.a
| Gene (exon) | SureSelect | TargetSeq | TruSeq | GC content (%) | Other observations |
|---|---|---|---|---|---|
| APOB (1) | 12 | 33 | 12 | 79 | |
| BRCA1 (1) | 12 | 33 | 0 | 56 | Pseudogene |
| BRCA2 (18) | 0 | 0 | 8 | 41 | |
| CACNA1S (18) | 0 | 0 | 12 | 56 | |
| DSG2 (1) | 0 | 6 | 12 | 73 | Pseudogene |
| KCNH2 (1) | 4 | 30 | 8 | 65 | |
| KCNH2 (2) | 7 | 27 | 2 | 75 | |
| KCNH2 (4) | 5 | 32 | 0 | 69 | |
| KCNH2 (12) | 6 | 0 | 0 | 66 | |
| KCNH2 (13) | 12 | 33 | 12 | 78 | |
| KCNQ1 (1) | 12 | 33 | 12 | 77 | |
| LDLR (1) | 5 | 33 | 12 | 67 | |
| MEN1 (10) | 2 | 24 | 0 | 66 | |
| MSH6 (1) | 11 | 31 | 0 | 72 | |
| MYH7 (27) | 11 | 2 | 0 | 65 | |
| PCSK9 (9) | 6 | 0 | 0 | 65 | |
| PKP2 (1) | 2 | 23 | 12 | 71 | |
| PKP2 (6) | 6 | 20 | 0 | 58 | |
| PMS2 (2) | 12 | 7 | 0 | 46 | |
| PMS2 (3) | 12 | 6 | 0 | 38 | |
| PMS2 (4) | 5 | 32 | 0 | 46 | |
| PMS2 (5) | 12 | 6 | 0 | 49 | |
| PMS2 (12) | 12 | 6 | 0 | 45 | Pseudogene |
| PMS2 (14) | 11 | 6 | 0 | 55 | Pseudogene |
| PMS2 (15) | 10 | 0 | 0 | 52 | Pseudogene |
| PRKAG2 (5) | 0 | 18 | 4 | 72 | |
| RB1 (1) | 12 | 33 | 4 | 76 | Pseudogene |
| RET (1) | 1 | 27 | 0 | 68 | Pseudogene |
| RYR1 (28) | 0 | 16 | 0 | 70 | Pseudogene |
| RYR1 (33) | 7 | 5 | 0 | 67 | Pseudogene |
| RYR1 (35) | 4 | 0 | 12 | 50 | Pseudogene |
| RYR1 (75) | 0 | 0 | 11 | 60 | Pseudogene |
| RYR1 (90) | 12 | 33 | 12 | 76 | Pseudogene |
| RYR2 (1) | 5 | 32 | 12 | 48 | Pseudogene |
| RYR2 (5) | 5 | 25 | 11 | 20 | Pseudogene, Repetitive DNA |
| RYR2 (6) | 0 | 26 | 12 | 36 | Pseudogene |
| RYR2 (82) | 0 | 22 | 10 | 57 | Pseudogene |
| RYR2 (93) | 0 | 0 | 11 | 36 | Pseudogene |
| SCN5A (1) | 12 | 33 | 12 | 81 | |
| SCN5A (28) | 7 | 27 | 0 | 56 | |
| SDHC (2) | 0 | 0 | 12 | 54 | Pseudogene |
| SDHC (4) | 0 | 0 | 11 | 56 | Pseudogene |
| SDHC (5) | 6 | 6 | 12 | 46 | Pseudogene |
| SDHD (4) | 12 | 6 | 0 | 49 | |
| TGFBR1 (1) | 12 | 33 | 12 | 84 | Pseudogene |
| TSC2 (34) | 0 | 23 | 0 | 67 | Pseudogene |
| VHL (1) | 6 | 14 | 0 | 72 | Pseudogene |
| WT1 (1) | 7 | 28 | 6 | 73 |
Listed are the genes and corresponding exons which had low coverage (<100% of nucleotides at ≥20× depth) in more than half the samples examined. For both the gene symbols and names of the genes used in this table, see the human genes footnote in this article.
Discussion
When the 18336 pathogenic variant positions from 56 genes were examined in aggregate, the clinical exome data had approximately 90% of variant locations at ≥20× depth of coverage (Fig. 2). However, when examined at the level of individual genes, the paucity of coverage prevented analysis of many variant positions. The clinical exome tests had 7 genes where >50% of the HGMD variant locations had inadequate coverage. This inadequacy of coverage in a subset of 56 genes from exome sequencing is due to a combination of factors, including design of capture probes, high-GC-content targets that may be difficult to capture and/or sequence, and pseudogenes. These factors have been previously discussed in the context of the overall analytical performance of exome sequencing (9).
The ACMG “incidental findings” guideline recommends that clinical laboratories issue a disclaimer that the additional 56 clinically important genes examined may not have the same quality or comprehensiveness as tests specifically designed to test for these genes. However, from the perspective of patients and clinicians, the consent or notification of testing for the ACMG 56 genes may create the false expectation that a sufficient genetic evaluation of these genes will be performed, regardless of a laboratory disclaimer. Indeed, the authors of the guideline acknowledge that physicians and their patients could interpret an indeterminate result because of lack of coverage of a clinically important nucleotide position as a negative result.
The 18336 nucleotide positions used in this study are an overestimate of the true pathogenic variants in the 56 genes. Variants in the HGMD database have been shown to be occasionally incorrectly annotated as pathogenic secondary to errors in the experimental literature or database errors (22). Indeed, it was observed in one study that approximately 80% of the HGMD variants classified as disease causing have an allele frequency of >5% in the 1000 Genome Database; by definition, a rare variant has <5% allele frequency in a population (22). However, the evaluation of depth of coverage at these 18336 variant positions provides a uniform tool for surveying the quality of exome data sets for reporting on individual genes. The focus of this study was on adequate depth of coverage to analyze variants in the context of clinical testing. However, additional quality metrics need to be examined in future studies, including the accuracy of alignment and base calling. A recent study has demonstrated significant discordance between software programs that perform alignment and base calling (23). In the prior study, 15 exome data sets were examined by 5 commonly used alignment and variant-calling software combinations. The SNV concordance between the 5 software combinations was only 57.4%. The indel (insertion or deletion of multiple bases) concordance was only 26.8%. Thus, not only is the exome capture method and sequencing important, but also the software used for interpretation needs to be carefully evaluated. For clinical laboratories, much more work needs to be done for standardizing both capture methods and data analysis. The ideal validation of clinical exome tests not only should include aggregate statistics of coverage, but also should specifically analyze individual genes and clinically important SNVs and indels.
Some experts have advocated that whole genome sequencing may have fewer quality issues than exome sequencing, albeit at a much higher resource requirement for sequencing, data storage, and computational power. However, a recent study of clinical whole genome sequencing reveals that a subset analysis of the 56 ACMG genes has inadequate coverage for variant detection in 9%–17% of genes (24). The concept of deviation from uniform sequencing coverage has been termed bias, and each capture method and sequencing technology has differences in coverage bias (25). This bias is an explanation for exome samples having good mean or aggregate coverage statistics but poor coverage at specific genes or variant locations.
Protocol modifications that are well known for optimization of PCR reactions can be used to decrease coverage bias in exome sequencing and other enrichment-based next generation sequencing technologies. Previous studies that focused on optimizing exome sequencing have explored techniques such as changing DNA polymerase, temperature ramp rate, and denaturation time or adding betaine or tetramethylammonium chloride (26, 27). These modifications have been specifically used to address AT- or GC-rich target regions. In addition to modifying the reaction conditions or adding chemical additives, there are successful examples of adding high concentrations of capture probes (spike-in) to regions with decreased coverage (28, 29). In 1 example, the baseline exome test covered only 75% of 3000 clinically relevant genes (with a requirement for ≥20× depth of coverage at every coding nucleotide); however, with the addition of a spike-in reagent containing a high concentration of probes targeted to low-coverage regions, 97% of 3000 clinically relevant genes had adequate coverage (28). These modifications may be used to decrease coverage bias and improve the overall quality of data from exome sequencing tests.
The quality of clinical exome sequencing data should be taken into consideration with the ongoing discussion on the return of “incidental findings.” Examination of depth of coverage at specific clinically significant variant positions as performed by this study may be a useful routine quality metric for clinical exome/genome tests. If a clinical laboratory plans to report subsets of genes from exome data, the target regions of these genes should be analytically validated before clinical implementation. In the short term, laboratories should consider supplementing exome methods with assay modifications or Sanger sequencing to fill in regions with poor coverage. In the long term, the heterogeneous and occasional poor depth of coverage in this subset of 56 genes illustrates the opportunity for further innovation in next-generation sequencing methods.
Acknowledgments
We thank Vanessa Schmid, Aaron Guillory, Ahwan Pandey, Kathleen Delgrosso, and Kathryn Scott for DNA sequencing data.
Footnotes
Nonstandard abbreviations: ACMG, American College of Medical Genetics and Genomics; SNV, single-nucleotide variant; HGMD, Human Gene Mutation Database.
Human genes: SDHD, succinate dehydrogenase complex, subunit D, integral membrane protein; PMS2, PMS2 postmeiotic segregation increased 2 (S. cerevisiae); PCSK9, proprotein convertase subtilisin/kexin type 9; KCNH2, potassium voltage-gated channel, subfamily H (eag-related), member 2; ACTC1, actin, alpha, cardiac muscle 1; TGFBR2, transforming growth factor, β receptor II (70/80 kDa); GLA, galactosidase, α; SDHC, succinate dehydrogenase complex, subunit C, integral membrane protein, 15 kDa; COL3A1, collagen, type III, α1; SDHAF2, succinate dehydrogenase complex assembly factor 2; APOB, apolipoprotein B; KCNQ1, potassium voltage-gated channel, KQT-like subfamily, member 1; RYR1, ryanodine receptor 1 (skeletal); SCN5A, sodium channel, voltage-gated, type V, α subunit; TGFBR1, transforming growth factor, β receptor 1; WT1, Wilms tumor 1; VHL, von Hippel-Lindau tumor suppressor, E3 ubiquitin protein ligase; TSC2, tuberous sclerosis 2; TPM1, tropomyosin 1 (α); TP53, tumor protein p53; TNNT2, troponin T type 2 (cardiac); TNNI3, troponin I type 3 (cardiac); TMEM43, transmembrane protein 43; STK11, serine/threonine kinase 11; SMAD3, SMAD family member 3; SDHB, succinate dehydrogenase complex, subunit B, iron sulfur (Ip); RYR2, ryanodine receptor 2 (cardiac); RET, ret proto-oncogene; RB1, retinoblastoma 1; PTEN, phosphatase and tensin homolog; PRKAG2, protein kinase, AMP-activated, gamma 2 non-catalytic subunit; PKP2, plakophilin 2; NF2, neurofibromin 2 (merlin); MYLK, myosin light chain kinase; MYL2, myosin, light chain 2, regulatory, cardiac, slow; MYL3, myosin, light chain 3, alkali; ventricular, skeletal, slow; MYH7, myosin, heavy chain 7, cardiac muscle, beta; MYH11, myosin, heavy chain 11, smooth muscle; MYBPC3, myosin binding protein C, cardiac; MUTYH, mutY homolog; MSH2/6, mutS homolog 2/6; MLH1, mutL homolog 1; MEN1, multiple endocrine neoplasia I; LMNA, lamin A/C; LDLR, low density lipoprotein receptor; FBN1, fibrillin 1; DSP, desmoplakin; DSG2, desmoglein 2; DSC2, desmocollin 2; CACNA1S, calcium channel, voltage-dependent, L type, α1S subunit; BRCA1/2, breast cancer 1/2, early onset; APC, adenomatous polyposis coli; ACTA2, actin, alpha 2, smooth muscle, aorta.
Author Contributions: All authors confirmed they have contributed to the intellectual content of this paper and have met the following 3 requirements: (a) significant contributions to the conception and design, acquisition of data, or analysis and interpretation of data; (b) drafting or revising the article for intellectual content; and (c) final approval of the published article.
Authors’ Disclosures or Potential Conflicts of Interest: Upon manuscript submission, all authors completed the author disclosure form. Disclosures and/or potential conflicts of interest:
Employment or Leadership: None declared.
Consultant or Advisory Role: J.Y. Park and L.J. Kricka, Fujirebio, Inc., a subsidiary of Miraca Holdings, a joint owner of Baylor Medical Genetics Lab.
Stock Ownership: None declared.
Honoraria: None declared.
Research Funding: J.Y. Park, NIH Office of Rare Diseases Research: Collaboration, education, and test translation (CETT) program for rare genetic diseases; P. Fortina, NIH-NCI Cancer Center Core grant (P30 CA056036).
Expert Testimony: None declared.
Patents: None declared.
Role of Sponsor: The funding organizations played no role in the design of study, choice of enrolled patients, review and interpretation of data, or preparation or approval of manuscript.
References
- 1.Green RC, Berg JS, Grody WW, Kalia SS, Korf BR, Martin CL, et al. ACMG recommendations for reporting of incidental findings in clinical exome and genome sequencing. Genet Med. 2013;15:565–74. doi: 10.1038/gim.2013.73. [DOI] [PMC free article] [PubMed] [Google Scholar]
- 2.Green RC, Lupski JR, Biesecker LG. Reporting genomic sequencing results to ordering clinicians: incidental, but not exceptional. JAMA. 2013;310:365–6. doi: 10.1001/jama.2013.41703. [DOI] [PMC free article] [PubMed] [Google Scholar]
- 3.Holtzman NA. ACMG recommendations on incidental findings are flawed scientifically and ethically. Genet Med. 2013;15:750–1. doi: 10.1038/gim.2013.96. [DOI] [PubMed] [Google Scholar]
- 4.Klitzman R, Appelbaum PS, Chung W. Return of secondary genomic findings vs patient autonomy: implications for medical care. JAMA. 2013;310:369–70. doi: 10.1001/jama.2013.41709. [DOI] [PMC free article] [PubMed] [Google Scholar]
- 5.McGuire AL, Joffe S, Koenig BA, Biesecker BB, Mc-Cullough LB, Blumenthal-Barby JS, et al. Point-counterpoint. Ethics and genomic incidental findings. Science. 2013;340:1047–8. doi: 10.1126/science.1240156. [DOI] [PMC free article] [PubMed] [Google Scholar]
- 6.Ross LF, Rothstein MA, Clayton EW. Mandatory extended searches in all genome sequencing: ‘incidental findings,’ patient autonomy, and shared decision making. JAMA. 2013;310:367–8. doi: 10.1001/jama.2013.41700. [DOI] [PubMed] [Google Scholar]
- 7.Wolf SM, Annas GJ, Elias S. Point-counterpoint. Patient autonomy and incidental findings in clinical genomics. Science. 2013;340:1049–50. doi: 10.1126/science.1239119. [DOI] [PMC free article] [PubMed] [Google Scholar]
- 8.Asan, Xu Y, Jiang H, Tyler-Smith C, Xue Y, Jiang T, et al. Comprehensive comparison of three commercial human whole-exome capture platforms. Genome Biol. 2011;12:R95. doi: 10.1186/gb-2011-12-9-r95. [DOI] [PMC free article] [PubMed] [Google Scholar]
- 9.Clark MJ, Chen R, Lam HY, Karczewski KJ, Euskirchen G, Butte AJ, Snyder M. Performance comparison of exome DNA sequencing technologies. Nat Biotechnol. 2011;29:908–14. doi: 10.1038/nbt.1975. [DOI] [PMC free article] [PubMed] [Google Scholar]
- 10.Parla JS, Iossifov I, Grabill I, Spector MS, Kramer M, McCombie WR. A comparative analysis of exome capture. Genome Biol. 2011;12:R97. doi: 10.1186/gb-2011-12-9-r97. [DOI] [PMC free article] [PubMed] [Google Scholar]
- 11.Sulonen AM, Ellonen P, Almusa H, Lepisto M, Eldfors S, Hannula S, et al. Comparison of solution-based exome capture methods for next generation sequencing. Genome Biol. 2011;12:R94. doi: 10.1186/gb-2011-12-9-r94. [DOI] [PMC free article] [PubMed] [Google Scholar]
- 12.University of California–Santa Cruz. [Accessed October 2014];UCSC genome bioinformatics. http://genome.ucsc.edu/
- 13.Rumble SM, Lacroute P, Dalca AV, Fiume M, Sidow A, Brudno M. Shrimp: accurate mapping of short color-space reads. PLoS Comput Biol. 2009;5:e1000386. doi: 10.1371/journal.pcbi.1000386. [DOI] [PMC free article] [PubMed] [Google Scholar]
- 14.Martin M. Cutadapt removes adapter sequences from high-throughput sequencing reads. EMBnetjournal. 2011;17:10–2. [Google Scholar]
- 15.Li H, Handsaker B, Wysoker A, Fennell T, Ruan J, Homer N, et al. The sequence alignment/map format and SAM-tools. Bioinformatics. 2009;25:2078–9. doi: 10.1093/bioinformatics/btp352. [DOI] [PMC free article] [PubMed] [Google Scholar]
- 16.Quinlan AR, Hall IM. Bedtools: a flexible suite of utilities for comparing genomic features. Bioinformatics. 2010;26:841–2. doi: 10.1093/bioinformatics/btq033. [DOI] [PMC free article] [PubMed] [Google Scholar]
- 17.Jamal SM, Yu JH, Chong JX, Dent KM, Conta JH, Tabor HK, Bamshad MJ. Practices and policies of clinical exome sequencing providers: analysis and implications. Am J Med Genet A. 2013;161A:935–50. doi: 10.1002/ajmg.a.35942. [DOI] [PMC free article] [PubMed] [Google Scholar]
- 18.Rehm HL, Bale SJ, Bayrak-Toydemir P, Berg JS, Brown KK, Deignan JL, et al. ACMG clinical laboratory standards for next-generation sequencing. Genet Med. 2013;15:733–47. doi: 10.1038/gim.2013.92. [DOI] [PMC free article] [PubMed] [Google Scholar]
- 19.Dohm JC, Lottaz C, Borodina T, Himmelbauer H. Substantial biases in ultra-short read data sets from high-throughput DNA sequencing. Nucleic Acids Res. 2008;36:e105. doi: 10.1093/nar/gkn425. [DOI] [PMC free article] [PubMed] [Google Scholar]
- 20.Chin EL, da Silva C, Hegde M. Assessment of clinical analytical sensitivity and specificity of next-generation sequencing for detection of simple and complex mutations. BMC Genet. 2013;14:6. doi: 10.1186/1471-2156-14-6. [DOI] [PMC free article] [PubMed] [Google Scholar]
- 21.Meynert AM, Bicknell LS, Hurles ME, Jackson AP, Taylor MS. Quantifying single nucleotide variant detection sensitivity in exome sequencing. BMC Bioinformatics. 2013;14:195. doi: 10.1186/1471-2105-14-195. [DOI] [PMC free article] [PubMed] [Google Scholar]
- 22.Berg JS, Adams M, Nassar N, Bizon C, Lee K, Schmitt CP, et al. An informatics approach to analyzing the incidentalome. Genet Med. 2013;15:36–44. doi: 10.1038/gim.2012.112. [DOI] [PMC free article] [PubMed] [Google Scholar]
- 23.O’Rawe J, Jiang T, Sun G, Wu Y, Wang W, Hu J, et al. Low concordance of multiple variant-calling pipelines: practical implications for exome and genome sequencing. Genome Med. 2013;5:28. doi: 10.1186/gm432. [DOI] [PMC free article] [PubMed] [Google Scholar]
- 24.Dewey FE, Grove ME, Pan C, Goldstein BA, Bernstein JA, Chaib H, et al. Clinical interpretation and implications of whole-genome sequencing. JAMA. 2014;311:1035–45. doi: 10.1001/jama.2014.1717. [DOI] [PMC free article] [PubMed] [Google Scholar]
- 25.Ross MG, Russ C, Costello M, Hollinger A, Lennon NJ, Hegarty R, et al. Characterizing and measuring bias in sequence data. Genome Biol. 2013;14:R51. doi: 10.1186/gb-2013-14-5-r51. [DOI] [PMC free article] [PubMed] [Google Scholar]
- 26.Aird D, Ross MG, Chen WS, Danielsson M, Fennell T, Russ C, et al. Analyzing and minimizing PCR amplification bias in Illumina sequencing libraries. Genome Biol. 2011;12:R18. doi: 10.1186/gb-2011-12-2-r18. [DOI] [PMC free article] [PubMed] [Google Scholar]
- 27.Oyola SO, Otto TD, Gu Y, Maslen G, Manske M, Campino S, et al. Optimizing Illumina next-generation sequencing library preparation for extremely AT-biased genomes. BMC Genomics. 2012;13:1. doi: 10.1186/1471-2164-13-1. [DOI] [PMC free article] [PubMed] [Google Scholar]
- 28.Buhay C, Wang Q, Sangvhi R, Hu J, Ding Y, Wang M, et al. The BCM-HGSC clinical exome: from concept to implementation. Presented at: 9th Annual Sequencing, Finishing, Analysis in the Future Meeting; 2014 May 28–30; Santa Fe, NM. [Google Scholar]
- 29.Muzny D, Buhay C, Hu J, Wang M, Han Y, Dinh H, et al. Advancing clinical diagnostics using whole exome sequencing. Poster session presented at: 64th Annual Meeting of the American Society of Human Genetics; 2014 Oct 18–22; San Diego, CA. [Google Scholar]