Abstract
Transmural variations in the relationship between structural and fluid transport properties of myocardial capillary networks are determined via continuum modelling approaches using recent three-dimensional (3D) data on the microvascular structure. Specifically, the permeability tensor, which quantifies the inverse of the blood flow resistivity of the capillary network, is computed by volume-averaging flow solutions in synthetic networks with geometrical and topological properties derived from an anatomically-detailed microvascular data set extracted from the rat myocardium. Results show that the permeability is approximately ten times higher in the principal direction of capillary alignment (the ‘longitudinal’ direction) than perpendicular to this direction, reflecting the strong anisotropy of the microvascular network. Additionally, a 30% increase in capillary diameter from subepicardium to subendocardium is shown to translate to a 130% transmural rise in permeability in the longitudinal capillary direction. This result supports the hypothesis that perfusion is preferentially facilitated during diastole in the subendocardial microvasculature to compensate for the severely-reduced systolic perfusion in the subendocardium.
Keywords: Myocardial blood flow, Microvascular networks, Transmural functional differences, Homogenization, Darcy flow, Flow conductivity
1 Introduction
During systole, myocardial contractions and high left-ventricular pressure produced by cardiac pump function induce significant compression of the subendocardial capillaries. This increased flow resistivity reduces perfusion8 which, combined with a higher metabolic demand, leads to a higher risk of ischaemia in the subendocardium than in subepicardial tissue9. However, the exact link between transmural variations in microvascular structure and flow have not yet been resolved experimentally at the capillary scale31. In this paper, we seek to bypass these experimental limitations by exploiting theoretical techniques to predict the transmural gradient in tissue-scale flow properties directly from microvascular network geometry. This is achieved by simulating flow in synthetic networks with geometrical properties derived from 3D anatomical data extracted from the rat myocardium.
Detailed information on the 3D spatial arrangement of the coronary microvasculature has recently been obtained via ex vivo vascular casting, high-resolution imaging and automated post-processing technologies12;17. However, since these methods are currently only possible for small tissue sections, many vessels (more than 104 in the data set of Lee et al.17) are bisected at the sample borders. Thus meaningful blood flow simulations within these microvascular networks require prior knowledge of suitable boundary conditions (BCs). The definition of these boundary values is hindered by the limits of in vivo imaging and measurement techniques, with capillary flow measurements restricted to the endocardial surface15 and pressures recorded only in vessels >100μm in diameter4.
The strong influence of capillary BCs on network-scale flow properties was recently demonstrated by Lorthois et al.18, who conducted Poiseuille flow simulations in a reconstructed 3D cerebral microvascular network. Enforcing zero-flux BCs at boundary capillaries, effectively assuming the network was independent of neighboring arteriolar supply regions, minimized the total blood flow entering the network. Uniform pressure capillary BCs, chosen to satisfy zero net flux out of the capillaries and thus requiring that network outflow was balanced by inflow from neighboring regions, maximized the total inflow (0.33 vs. 2.36 mL min−1 g−1 with a discharge hematocrit of HD = 0.4 at the main arterioles). Hence the link between microvascular network geometry and effective fluid transport continues to be difficult to elucidate.
Continuum-based mathematical modelling approaches which are independent of the choice of BCs seek to address this issue. Applying this approach, Shipley and Chapman25 employed mathematical averaging techniques to derive a macroscopic Darcy flow model, which ensures computational tractability whilst capturing the key capillary-scale fluid dynamics within the microscopic network geometry. In this paper, we define permeability as the inverse of flow resistivity through the microvascular network (analogous to electrical conductivity), rather than referring to the leakage of fluid through capillary walls. Under this definition, the permeability tensor is a tissue-scale metric which links the pressure gradient and the averaged fluid velocity. The permeability tensor is calculated by volume-averaging the flow solution to a periodic boundary value problem defined on sub-units which represent the microvascular network.
The formulation of this mathematical averaging method requires these sub-units to be spatially-periodic. Although microvascular networks in living organisms are unlikely to have a precisely self-repeating structure, we hypothesize that capillary networks in the myocardium are approximately periodic. This is justified by observations of significant spatial organization in these networks, which are composed of long, parallel (‘longitudinal’) capillaries connected by shorter anastomoses1;13. In this study, the theoretical modelling framework developed by Shipley and Chapman25 is employed to compute a physiologically-meaningful permeability tensor for the 3D microvascular data set of Lee et al.17. This is achieved by parameterizing synthetic networks (which are spatially periodic to comply with the modelling framework) with geometrical statistics from the discrete data.
The distinctive anisotropy of the coronary capillaries, which is hypothesized to play a key role in microvascular function within the rhythmically-contracting myocardium in vivo14;17, is incorporated into this model through an anisotropic permeability tensor, which is calculated via a principal component analysis on discrete sections of the network data. The calculated principal values quantify the degree of microstructural anisotropy. Capillaries in the data set are grouped into three types (longitudinal, or in-sheet/sheet-normal cross-connecting) according to their alignment with the principal axes, and the distributions of lengths and diameters for each capillary type are used as inputs for generating the synthetic networks.
Finally, calculation of the permeability tensor for discrete sections of the data enables quantification of the degree of transmural gradient in tissue-scale flow properties as a result of anatomical variation, which is important in the context of the increased risk of ischaemia in the subendocardium. It is predicted that diastolic permeability is higher in the subendocardium than the subepicardium, which is hypothesized to compensate in part for the strong reduction in subendocardial perfusion during systole as a result of increased microvascular resistance produced by compression of the embedded coronary vasculature during cardiac contraction.
2 Materials and methods
2.1 Structural properties of the coronary capillaries
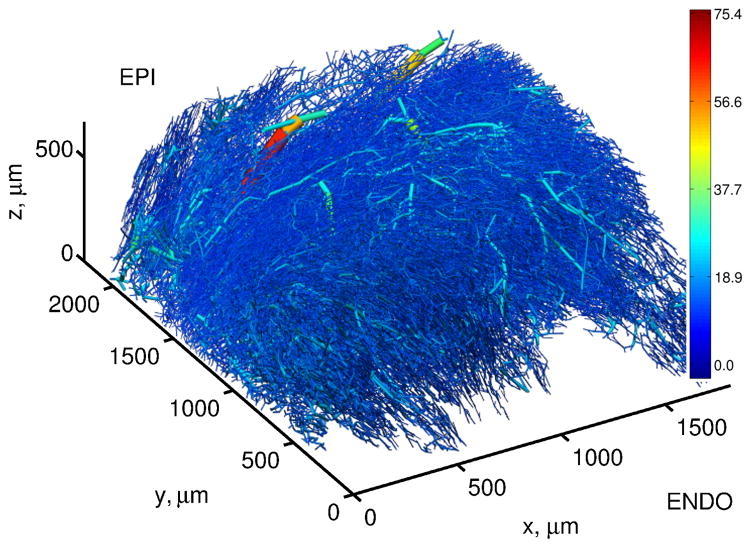
The methods presented in this study, summarized in Figure 1, were implemented in MATLAB R2013a and applied to the rat microvascular data set, which was obtained ex vivo by perfusing the adenosine-dilated vasculature of the rat myocardium with a corrosion casting mixture at a perfusion pressure of 80 mmHg. Confocal laser scanning microscopy, high-precision sectioning and automated image processing techniques were employed by Lee et al.17 to digitally reconstruct a ≈ 2mm3 section of the vasculature at sub-micron resolution (see Figure 2). In this data set, the x, y and z-axes correspond to the circumferential, transmural (endocardium to epicardium) and apex–base directions. The region below y = 600μm was neglected because of large regions absent of vessels, likely due to the uneven surface typical of the endocardium.
Figure 1.
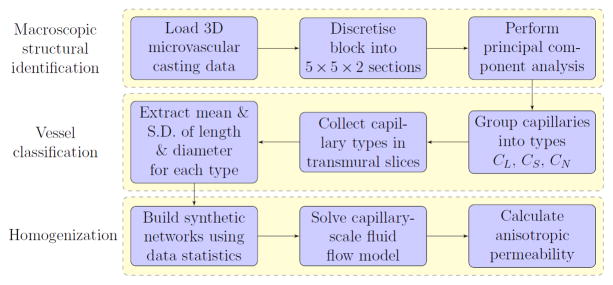
Workflow diagram of the methods applied in this paper.
Figure 2.
The 3D rat coronary microvascular block of Lee et al.17, colored by diameter (μm). This figure was produced using CMGUI, a 3D visualization software package available to download via http://www.cmiss.org/cmgui/.
Since a gold-standard reference data set for the radius-detection algorithm was unavailable and the extracted diameters were found to be significantly larger than those reported previously in the rat21;22;29, the approach of Secomb et al.24 was applied to the network data. Specifically, a scaling factor was applied to all diameters to match the mean of diameters reported for the rat myocardium (5.1μm)21;22;29, obtaining a standard deviation (S.D.) of 2.1μm. After this scaling, the capillary volume fraction was 5.7%, similar to measurements in the dog myocardium19.
Firstly, the main arterioles and venules were excluded from subsequent analysis by employing a geometry-based vessel classification method (see Smith26). In brief, this algorithm distinguishes branching trees from an interconnected capillary mesh by stepping through the network in a sequence that depends on both branching order and vessel diameter, and then identifying loops within the network. A principal component analysis (PCA) weighted by vessel length was performed on the remaining capillaries to quantify the anisotropy in capillary orientation and identify the axes best describing this alignment5. The Cartesian components of the covariance matrix were computed for the set of vectors from the start node to the end node of each capillary segment (unbranched section of capillary). The normalized eigenvalues of this covariance matrix, sorted in order of descending magnitude, are the principal values {λ1, λ2, λ3} which indicate the proportion of the variance in capillary orientation accounted for by each axis. The corresponding eigenvectors of the covariance matrix are the principal axes {e1, e2, e3}, giving the principal directions of capillary alignment. To capture the gradually-varying capillary alignment, the data was discretized into 5 sections transmurally, 5 sections in the circumferential direction and 2 sections in the apex—base direction, to yield sub-blocks of dimension 363×329×336μm3. The principal axes and corresponding principal values were computed for the capillaries within each section.
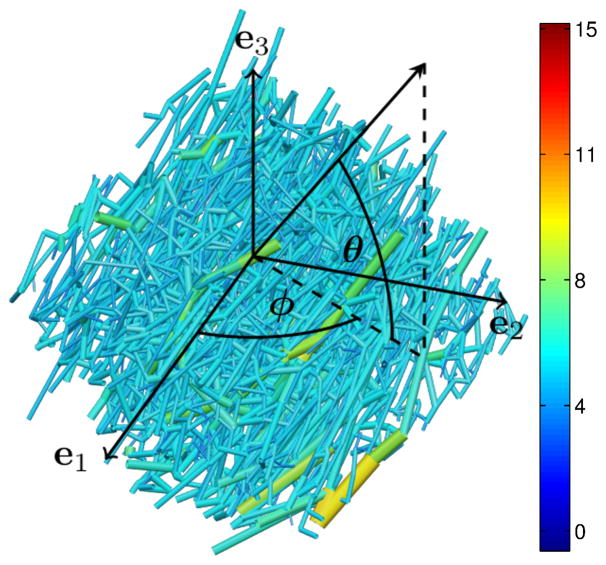
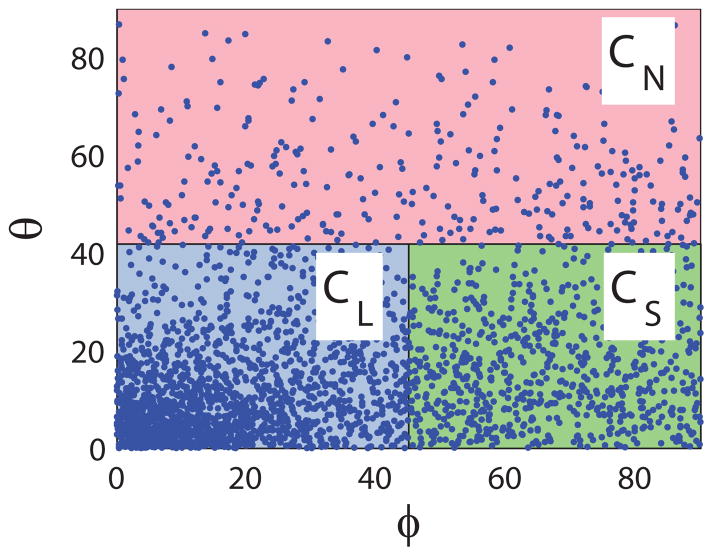
Capillaries were grouped into three types according to their spherical polar angles (φ, θ) with respect to the local principal axes (see Figure 3). The regions occupied by each capillary type were specified by critical angles φc and θc: longitudinal capillaries (CL) satisfied |θ| ≤ θc and |φ| ≤ φc; cross-connecting capillaries were sub-categorized into in-sheet (CS) capillaries (|θ| ≤ θc and |φ| >φc) or sheet-normal (CN) capillaries (|θ| > θc). The mean and S.D. of lengths and diameters for each capillary type were recorded, and the sensitivity of these metrics to φc and θc was investigated.
Figure 3.
Definition of spherical polar angles φ and θ with respect to the principal axes {e1, e2, e3} for a sub-section of the microvascular block. Vessels are colored by diameter (μm).
2.2 Calculation of the permeability tensor
Mathematical averaging (‘homogenization’) techniques were employed to predict tissue-scale flow properties following the approach of Shipley and Chapman25, who derived equations for effective fluid and drug transport in vascular networks. In the current study it was assumed that vessels were healthy i.e. non-leaky, so that there was no interstitial flow, and a no-slip, no-flux boundary condition was applied for the blood velocity at capillary walls. Assuming well-separated capillary (micro) and tissue (macro) length-scales and starting with viscous-dominated Stokes flow at the capillary scale, an asymptotic expansion was performed for the blood velocity and pressure in terms of the ratio of length scales. In brief, it was deduced that the flow solution was given by a linear superposition of contributions proportional to the tissue-scale pressure gradient in each of the principal directions ej. The weightings of these contributions were calculated by solving a periodic boundary value problem in terms of the capillary-scale variations in pressure, Pj, and velocity, wj, defined on periodic sub-units (‘micro-cells’) of the capillary network.
An analytical solution to this micro-cell problem was found by assuming that capillary diameters were typically much less than the length of the micro-cell (lubrication scalings) and by assuming that the flow in each capillary was radially-symmetric. In 2D (which is justified later) this led to the following expression for the micro-cell flux qjm, defined as wj integrated over the cross-section of capillary m:
| (1) |
where Dm, Lm, and μm are the diameter, length and viscosity respectively, is the drop in micro-cell pressure Pj along the vessel length, and em is the unit vector directed down the center-line of capillary m. This is a modified Poiseuille law, with an extra forcing term ej · em due to the tissue-scale pressure gradient. To account for the non-Newtonian rheology at this scale, the in vivo viscosity law of Pries and Secomb23 was used with a constant discharge hematocrit of HD = 0.45 to give μm as a function of Dm. Conservation of micro-cell flux at nodes and periodicity of micro-cell flux and pressure at boundary nodes were enforced. To obtain a unique solution, the volume average of the micro-cell pressure was defined to be zero. Together these conditions led to two (for j = 1, 2) linear systems of equations in terms of the micro-cell pressure Pj at each node, which was solved using standard linear solvers.
The permeability tensor K, defined as the volume-average of micro-cell velocity wj, transmits capillary-scale flow properties within specific micro-cell networks to the tissue-scale fluid transport equation (Darcy’s Law):
| (2) |
where u is the volume-averaged tissue-scale blood velocity and ∇p is the tissue-scale pressure gradient (note that u and ∇p are not calculated in this paper). The permeability tensor K = [K1 K2] was calculated via:
| (3) |
where |Ω| is the micro-cell domain volume, M is the total number of vessel segments, and qjm is obtained in terms of the micro-cell pressure solution Pj via Equation (1). The permeability components K1j and K2j represent the volume-averaged flow in the e1 and e2 directions respectively due to a forcing in the ej-direction.
2.3 Construction of synthetic networks
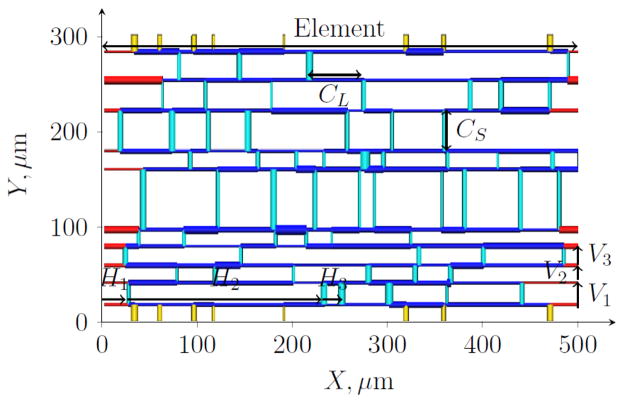
To parameterize physiologically-based micro-cells which are constrained to be spatially periodic as required by the homogenization framework, the inbuilt structural organization of the coronary capillaries was exploited. Specifically, synthetic spatially-periodic micro-cell networks were constructed by sampling from the morphological data (lengths and diameters) collected from the three capillary types. Within these abstracted networks only longitudinal (CL) and in-sheet cross-connecting (CS) capillaries were incorporated into the micro-cell networks, since a large proportion (quantified in the results section) of capillaries lay within a smoothly-varying two-dimensional manifold following the sheet architecture of cardiac muscle16, with longitudinal capillaries preferentially oriented in the direction of the muscle fibers17. Thus the synthetic networks were constructed to be two-dimensional (2D) with coordinates 0<X< Xmax and 0<Y<Ymax, embedded in a 3D domain with thickness given by the mean length of CN capillaries (see Figure 4).
Figure 4.
Example of a stochastically-generated micro-cell network. Here, V1, V2 and V3 indicate the first sampled vertical lengths (see Algorithm 1 in Supplementary Material) while H1, H2 and H3 indicate the first three sampled horizontal lengths on the element at Y = Y1. Cross-connections CS are shown in turquoise (in the interior of the micro-cell) or yellow (crossing the periodic boundary) while CL are colored dark blue (interior segments) or red (boundary segments).
Each individual segment was assumed to be cylindrical with constant diameter along its length19. Longitudinal capillaries running the entire length of the micro-cell, parallel to the X-axis (referred to as ‘elements’) were linked by perpendicular CS segments. The placement of longitudinal elements was determined, followed by the location of CS linking neighboring elements. Each section of longitudinal element between successive nodes (segment junctions) was defined to be a CL segment. A typical micro-cell network is shown in Figure 4.
The separation of longitudinal elements is equivalent to the length of CS linking element i to element i+1, and determined by sampling from a log-normal distribution with mean and S.D. given by CS lengths extracted from the data set (see Algorithm 1 in Supplementary Material). Starting at Y = 0, this procedure was repeated to find the Y-coordinate Yi of element i until the height of the micro-cell Ymax was reached, at which stage a final element was placed at Yn = Ymax.
Following this step, the exact placement of cross-connections CS were determined (see Algorithm 2 in Supplementary Material). Starting at X0 = 0 on element 1, the X-coordinate of the jth CS, Xj, was given by Xj−1 plus sampled length Hj taken from a log-normal distribution with mean m and standard deviation s, so that this segment has start node at (Xj,Y1) and end node at (Xj, Y2). This was repeated until X = Xmax was reached, with the same procedure then iterated for CS starting on the elements at Y = Y2, Y = Y3, etc. until the element at Y = Yn was reached. The periodicity assumption requires that boundary segments align at opposite sides of the micro-cell: CL segments running in parallel across the length of the micro-cell automatically satisfy this condition; however CS segments starting on the final element at Y = Yn must connect to the first element at Y = Y1 (shown in yellow in Figure 4). To avoid the placement of CS segments unrealistically close to each other a minimum separation of 1.41μm (the minimum segment length in the data set) between nodes was enforced.
A connectivity matrix was created recording the start and end nodes of each segment (defining the direction of positive flow in subsequent simulations). The sampled lengths Hj do not translate exactly to the mean and S.D. of CL segment lengths, because nodes on element i mark the junction with CS linking to elements (i−1) and also (i+1). For this reason, Hj were sampled from a log-normal distribution with mean m = 2×37.7μm and S.D. s = 2×28.8μm. The network periodicity was accounted for when recording boundary segment lengths: on each element the CL boundary segments (shown in red in Figure 4) are recorded as one segment, and similarly for the CS boundary segments (shown in yellow). Diameters were assigned to each CL and CS segment by sampling from a log-normal distribution using the corresponding mean and S.D. for each capillary type. The micro-cell problem was then solved (as detailed in Appendix A) on 1000 synthetically-generated networks. The sensitivity of the permeability tensor K to micro-cell length Xmax and height Ymax and to the input geometrical properties of the micro-cell networks was quantified in order to highlight the important parameters in determining tissue-scale flow properties.
2.4 Transmural functional variations
Transmural variations in permeability K were computed by constructing 1000 micro-cell networks using geometrical data collected over discrete x and z sections in terms of the y-coordinate of the mid-point of each discrete slice (corresponding to the transmural distance).
3 Results
3.1 Results of PCA
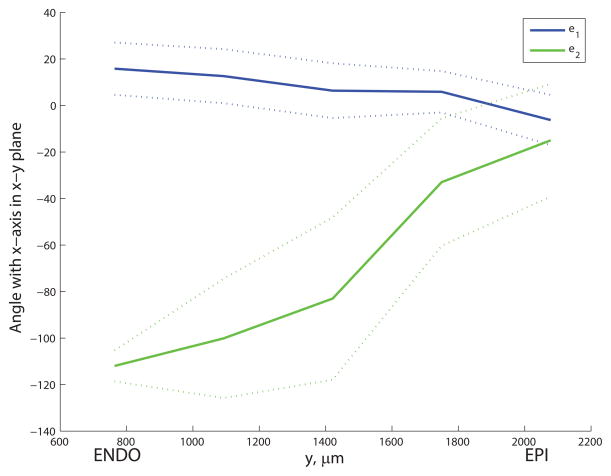
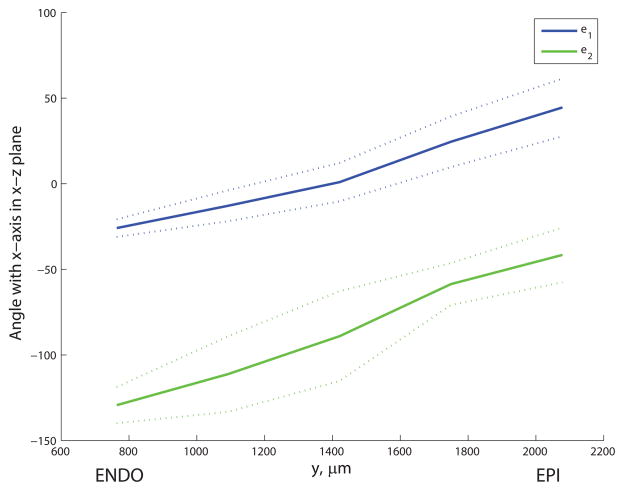
The discretized principal axes e1 and e2 exhibited a smooth variation across the microvascular block (see Figure 5). The first principal axis e1 was oriented roughly parallel to the epicardial surface, angled towards the apex at the endocardium and twisting to point more towards the base near the epicardium. Meanwhile the e2 direction pointed generally towards the apex but, moving from endocardium to epicardium, twisted from pointing towards the endocardium to lying approximately parallel to the epicardial surface. The principal values (mean ± S.D) were λ1 = 0.74 ± 0.05, λ2 = 0.18 ± 0.04 and λ3 = 0.08 ± 0.02. The distribution of angles φ and θ for capillaries in one discrete section of the block is shown in Figure 6. Using critical threshold angles φc = 45° and θc = 41.8° to ensure that each region used to group capillaries had equal volume in parameter space, the resulting geometrical statistics for each capillary type collected over the whole block are summarized in Table 1. These statistics were not significantly sensitive to changes in critical angles φc and θc and there was no clear cut-off between vessel types: a 30% increase in φc led to less than 1% change in the mean diameters of CL and CS segments, while the mean CN length increased by 6.1% in response to a 30% decrease in θc. The assumption of a 2D micro-cell composed of CL and CS only is supported by the data: 91.5% of capillaries were oriented within 41.8° of e1–e2 plane. The distribution of diameters was similar for all capillary types, while the mean length of the longitudinal (CL) segments (38.0μm) was 53% longer than that of the CS segments (and 76% longer than the mean CN length). The distributions of lengths and diameters for all capillary types were approximately log-normal. The mean and S.D. in lengths and diameters of CL and CS capillaries were used as inputs into the micro-cell network construction procedure, and the micro-cell domain thickness was prescribed by the mean length of CN segments (21.6μm).
Figure 5.
Transmural variation in orientation of discretized principal axes e1 and e2 for the microvascular block of Lee et al.17; mean (solid line) ± S.D. (dotted lines) in the angles that each principal axis makes with the x-axis when projected onto (a) the x—y plane and (b) the x—z plane. Values are averaged over x- and z- sections for each transmural slice.
Figure 6.
A scatter plot of the (absolute values of) spherical polar angles φ and θ for each capillary relative to the principal axes. Capillaries are labelled as longitudinal (CL), in-sheet (CS) or sheet-normal (CN) according to their φ and θ values.
Table 1.
Geometrical properties (mean ± S.D.) of capillary types CL, CS and CN, collected over discrete sections of the microvascular block of Lee et al.17. Here, N is the number of capillaries, VF is the percentage of the total capillary volume occupied by each type, L is the length (μm) and D is the diameter (μm).
| CL | CS | CN | |
|---|---|---|---|
| N | 76508 | 29414 | 9839 |
| VF | 71.6 | 21.8 | 6.6 |
| L | 38.0 ± 29.0 | 24.9 ± 15.7 | 21.6 ± 12.3 |
| D | 5.0 ± 1.9 | 5.2 ± 1.9 | 5.3 ± 2.0 |
3.2 Permeability of synthetic networks
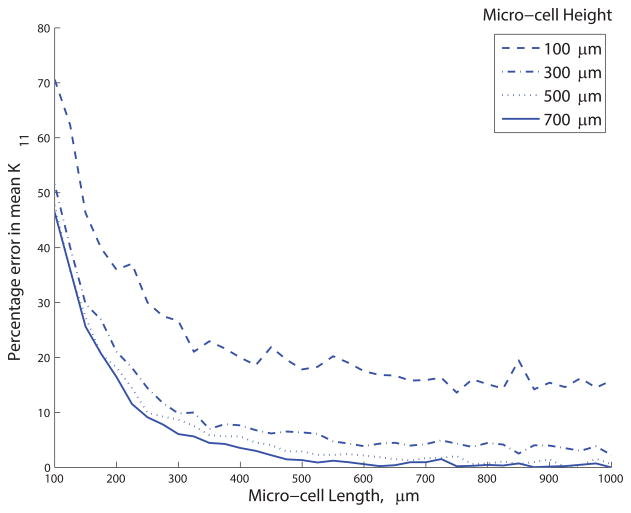
Appropriate micro-cell length Xmax and height Ymax were determined by computing the permeability of 1000 stochastically-generated networks for a range of micro-cell sizes. A large micro-cell size would challenge the assumption of length-scale separation, while a small micro-cell size increases the sensitivity of the extracted permeability values to the stochastically-generated network structure. The mean of the K11 permeability component was more sensitive to micro-cell length than height, and increased sharply for micro-cell lengths <200μm (see Figure 7). A micro-cell of size 450×300×21.6μm3 or greater was needed to obtain mean K11 and K22 values within 10% of the mean values obtained with a 1000×1000×21.6μm3 micro-cell. Subsequent simulations were performed on a micro-cell of size 500×300×21.6μm3, for which K11 = (3.3 ± 0.8) ×10−3 mm3 s kg−1 and K22 = (3.1 ± 1.0) ×10−4 mm3 s kg−1 (K11 was 10.8× K22 on average), reflecting the anisotropic structure of the underlying network. The off-diagonal permeability components K12 and K21 were equal and close to zero ((0.0013 ± 9.0) ×10−5 mm3 s kg−1).
Figure 7.
Percentage error in mean K11, relative to the mean K11 for a micro-cell of dimensions 1000 × 700 × 21.6 μm3. Simulations in this study were performed for micro-cells of 500 × 300 × 21.6 μm3, for which the percentage error was 6.4%.
Due to the constraints imposed during the construction process, the distribution of segment lengths in the stochastically-generated synthetic networks did not exactly match those of the original data set (see Table 2). The mean length of CL segments in the micro-cell networks was 5.4% higher than in the data set (with a 5.9% higher S.D.), while the mean CS length was 4.8% lower than in the data set (with 4.7% lower S.D.). These length errors are predicted to lead to a 6.4% overestimate in the mean K11 (6.3% overestimate in the S.D. of K11) combined with a 10.0% underestimate in the mean of K22 (11.0% underestimate in S.D.).
Table 2.
Mean and S.D. of length and diameter of CL and CS segments, averaged over 1000 stochastically-generated micro-cell networks.
| Capillary Type | CL | CS |
|---|---|---|
| Length (μm) | 40.0 ± 30.7 | 23.7 ± 14.9 |
| Diameter (μm) | 5.0 ± 4.2 | 5.2 ± 4.3 |
The permeability tensor was highly sensitive to changes in segment diameters: see Table 3. A 10% increase in the mean CL diameter led to 54.3% increase in mean K11 (combined with 43.9% increase in S.D.) and 26.6% increase in mean K22 (21.3% increase in S.D.). This strong effect on K22 occurs because flow forced in the e2 direction (i.e. when j=2 in Equation (1)) is diverted along CL as well as CS due to the off-set cross-connections, and is thus strongly affected by diameters of both capillary types. A 10% rise in the mean CS diameter had a similar effect on K22 (21.9% increase in the mean and 23.8% increase in S.D.), while less than 10% change was found for the mean or S.D. in K11. Changing the S.D. of CL or CS diameters by 10% led to less than 10% change in either the mean or S.D. of K11 and K22, demonstrating that the variance in diameters was much less important than the mean. Increasing the input mean horizontal length (m) by 10% resulted in an 11.7% decrease in K22 (see Table 4), while a 10% rise in the mean CS length led to an 8.7% drop in the mean K11.
Table 3.
Sensitivity of permeability components K11 and K22 to ± 10% changes in the mean and S.D. of diameter for CL and CS segments with N=105.
| % change in diameter | % change in permeability | |||||
|---|---|---|---|---|---|---|
| K11 | K22 | |||||
| Mean | S.D. | Mean | S.D. | |||
| CL | Mean | −10 | −34.5 | −33.3 | −24.6 | −22.0 |
| +10 | +52.4 | +46.0 | +30.6 | +25.5 | ||
| S.D. | −10 | +5.2 | +1.7 | +4.2 | +2.5 | |
| +10 | −5.1 | −1.9 | −4.0 | −1.9 | ||
| CS | Mean | −10 | −5.0 | −4.7 | −19.7 | −22.1 |
| +10 | +4.5 | +4.4 | +22.0 | +25.7 | ||
| S.D. | −10 | +0.8 | +0.5 | +3.9 | +3.3 | |
| +10 | −1.1 | −1.0 | −3.7 | −2.4 | ||
Table 4.
Sensitivity of permeability components K11 and K22 to ± 10% changes in the mean and S.D. of length for CL and CS segments with N=105.
| % change in length | % change in permeability | |||||
|---|---|---|---|---|---|---|
| K11 | K22 | |||||
| Mean | S.D. | Mean | S.D. | |||
| CL | Mean | −10 | −1.8 | −3.9 | +10.1 | +12.3 |
| +10 | +1.6 | +3.4 | −9.4 | −10.0 | ||
| S.D. | −10 | +0.1 | −0.6 | +5.9 | −0.8 | |
| +10 | −0.3 | +0.1 | −5.2 | +0.3 | ||
| CS | Mean | −10 | +11.9 | +12.4 | −6.4 | −7.6 |
| +10 | −9.9 | −9.9 | +5.7 | +6.3 | ||
| S.D. | −10 | −0.7 | −5.7 | −0.6 | −3.0 | |
| +10 | +0.3 | +4.9 | +0.2 | +4.1 | ||
Across all results the permeability was consistently much less sensitive to changes in segment length than to changes in the mean diameter. This is to be expected since the permeability is proportional to the fourth power of diameters, but inversely proportional to capillary length (see Equation 1). This relationship combined with the effect of a non-Newtonian viscosity directly explains the impact of CL diameter changes to the mean K11; however, K22 was affected by diameters of both CL and CS segments whilst also experiencing a more subtle dependence on the anisotropic network topology.
3.3 Transmural variations
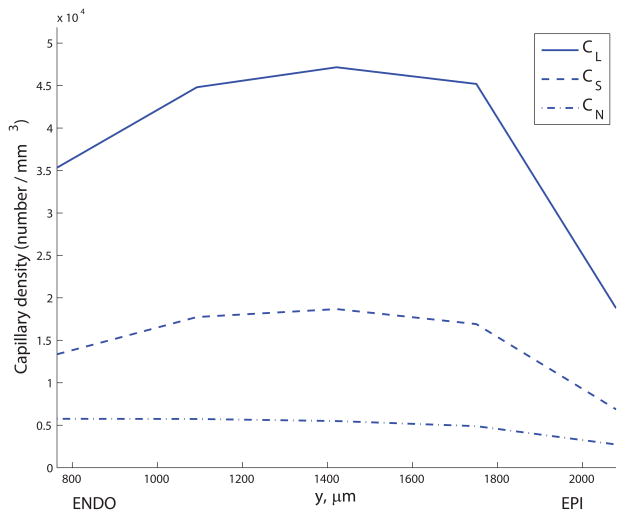
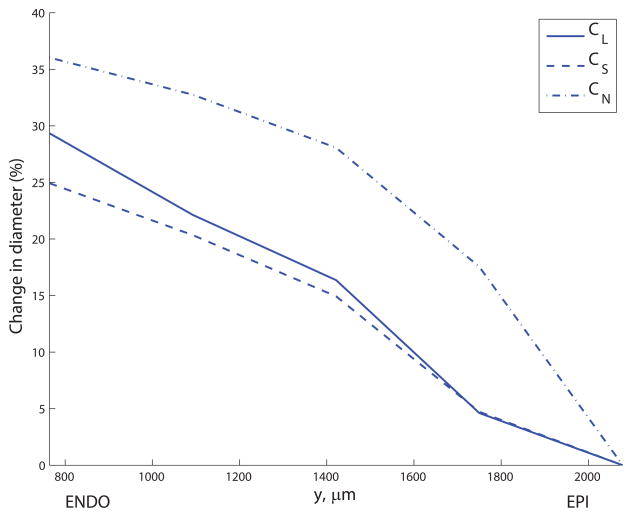
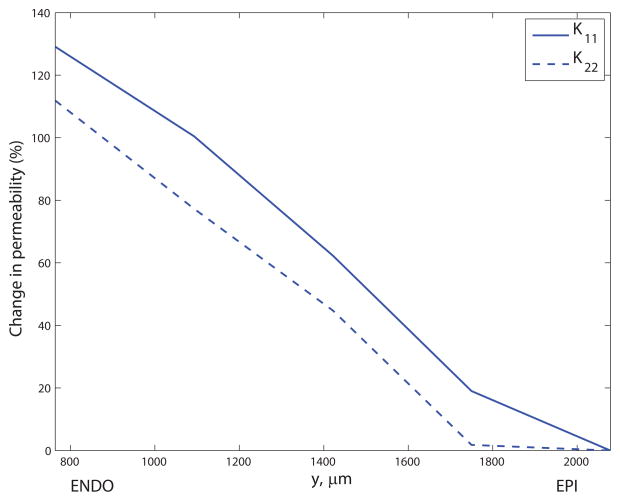
The principal values did not exhibit a correlation with transmural distance, indicating that the level of structural anisotropy does not vary from the subendocardium (ENDO) to the subepicardium (EPI). The capillary density (number of capillaries per mm3) was 100.2% higher in ENDO than EPI on average over all capillary types, though most significantly the density of capillaries was 131.5% higher in the mid-myocardium in comparison to the EPI (see Figure 8a). Figure 8b) shows the significant increase in mean diameter from EPI to ENDO (a 30.1% rise averaged over the three capillary types), confirming the findings of May-Newman et al.19. Mean CL lengths increased slightly with transmural depth (a 10.6% rise from 36.2μm to 40.0μm); the length of CS segments was slightly lower in the mid-myocardium (24.2μm) than peripheral regions (26.1μm in the EPI); the mean CN length increased 33.3% from EPI to ENDO. Using these results as inputs to the micro-cell networks revealed the strong dependence of the permeability on transmural location (see Figure 8c). The mean of K11 increased 130% from EPI (2.0×10⁻³mm3s kg−1) to ENDO (4.6×10⁻³mm3s kg−1); similarly, the mean of K22 ranged from 2.3×10⁻⁴mm3s kg−1 up to 4.9×10⁻⁴mm3s kg−1 (an increase of 117%).
Figure 8.
Transmural variation in (a) capillary density (capillaries per mm3) for CL, CS and CN segments; (b) mean diameter (percentage change relative to subepicardial values) for CL, CS and CN segments; and (c) permeability components K11 and K22 (percentage change relative to subepicardial values). The y- coordinate corresponds to the mid-point of the discrete section of capillaries in the data set used to compute the principal axes.
4 Discussion
The principal component analysis conducted in this paper confirmed that the 3D structure of the coronary capillary network is highly anisotropic. Data extracted from this analysis was used to compute the network permeability tensor via flow solutions in microvascular sub-units (‘micro-cells’). In this way the link between this structural anisotropy and tissue-scale fluid transport properties was quantified, showing that the permeability in the direction of longitudinal capillaries was 10.8× larger than in the direction of cross-connecting capillaries. The distribution of capillary diameters was a crucial determinant of tissue-scale perfusion, with changes to the mean diameter of longitudinal segments having the strongest effect on the permeability tensor.
Previously, Wieringa et al.34, Beard and Bassingthwaighte2, and Goldman and Popel7 studied similar spatially-periodic synthetic networks composed of long, parallel capillaries with cross-connections; however, capillaries were assigned uniform diameters. The synthetic networks developed here had large S.D. in capillary diameters, and although a 10% change to the diameter S.D. had little effect, if the S.D. of diameters were set to zero (i.e. imposing uniform diameters in CL and CS segments), the mean K11 and K22 would be 60.6% and 95.8% higher respectively. Non-zero diameter variance reduces the permeability due to local pressure gradients which force flow to deviate along the cross-connections rather than following the shortest path across the micro-cell, hence increasing the total network resistance. Note that an approximate estimate of K can be obtained via a simple calculation using the capillary density and mean capillary diameter and length, which predicts similar values but with a larger transmural range (K11 = (0.9—6.1) ×10−3 mm3 s kg−1, K22 = (2.9—16.2) ×10−4 mm3 s kg−1) most likely because this does not account for the non-zero diameter S.D. which is a feature of the micro-cell networks.
One limitation to this model is that a persistence in diameters between neighboring CL capillaries in the data set was not replicated in the micro-cell networks. The ratio of diameters at bifurcations was 1.05 ± 0.36 in the data, compared with 1.14 ± 0.63 in the micro-cells. To investigate the effect of this error, new micro-cells were generated with the first CL segment diameter on each longitudinal element was sampled as before, but subsequent CL segment diameters were a specified ratio (sampled from a distribution obtained from the data) of the previous neighboring segment’s diameter. Output CL diameters were 5.0 ± 3.0 μm (with S.D. significantly higher than 1.9 expected from the data), while K11 was (4.46 ± 1.73) ×10−3 mm3 s kg−1. For comparison, micro-cells were generated without diameter correlation but with CL diameters sampled from the distribution obtained above, yielding a larger diameter ratio of 1.41 ± 1.41 and K11 = (2.41 ± 0.73) ×10−3 mm3 s kg−1. The mean K11 was 54.0% of the value obtained with diameter correlation, indicating that by neglecting diameter correlation in the micro-cell networks we may have been underestimating K11 (although this difference may be exaggerated by the high diameter S.D.). However, incorporating this feature in a manner which is also consistent with the expected S.D. of diameters appears far from straightforward but would be an interesting and potentially important extension to this work.
The simple, 2D micro-cell construct assumed in this paper with cross-connections at 90° to the longitudinal elements agrees with the ‘H’-type of branching, which was the most common capillary branching type observed by Kassab and Fung13. A clear extension to the model which is beyond the scope of this paper would be to construct 3D micro-cell networks including CN segments. Since CN had similar geometrical properties to CS but approximately one third the capillary density, it is predicted that the permeability in the sheet-normal direction (K33) could be approximately 10−4 mm3 s kg−1, which while small could contribute to tissue-scale flow if there were a large pressure gradient in this direction.
Due to experimental limitations, there is very little quantitative information about tissue-level pressure gradients within the myocardium in any of the coordinate directions. A non-negligible transmural pressure difference (corresponding roughly to the sheet-normal direction) in vessels of diameter >100μm was reported by Chilian4, though this may be due in part to the spatial location of terminal arterioles supplying the capillary network. A key advantage of the approach presented here is that K is de-coupled from tissue-scale pressure gradients (which are implicit in coarse-scale experimental measurements of myocardial blood perfusion) and so could be used in poroelastic models to describe the potential flow capacity of the capillary network.
In this study, variations in the geometrical properties of the capillary network were related to transmural functional differences. The mean capillary diameter was ≈30% larger in the subendocardium than the subepicardium, contributing to a significant transmural increase in the computed permeability (≈130% in the longitudinal direction). The method presented here provides a novel technique for combining sophisticated modelling techniques with microstructural statistics to predict flow properties from anatomical data. The permeability tensor in itself provides fundamental information about (the inverse of) network flow resistivity. In addition, these permeability results could be used to parameterize tissue-scale models of volume-averaged flow in the myocardium3; 10; 11; 27.
Since the data used in this paper was obtained ex vivo with relaxed cardiac muscle and fully-dilated vessels, the reconstructed vasculature is most representative of the diastolic phase of the cardiac cycle. The results of this study support the hypothesis that subendocardial network permeability is significantly higher than subepicardial permeability during diastole, most likely in order to compensate (to some extent) for the reduced systolic perfusion, and the associated higher risk of ischaemia, in the subendocardium30. The permeability was shown here to be strongly dependent on capillary diameters, and so would be expected to reduce significantly in the subendocardium in response to increased microvascular constriction as a result of systolic myocardial contraction. The methods developed in this paper could be used in future to quantify the microvascular contribution to systolic flow impediment in the context of active myocardial contraction27.
Although capillaries cannot actively dilate or constrict, flow across the capillary network in the living myocardium depends strongly on driving pressures of upstream terminal arterioles, which respond to vasoregulatory signals. However in microvascular disease, coronary flow reserve is impaired and arterioles are almost fully dilated at rest20. In this context, K represents an important metric of passive flow conductivity once the vasoactive response is exhausted. This framework provides a tool which could in future be used to quantify the effects of structural changes induced by microvascular diseases such as diabetes27, which are important for understanding whole-organ coronary flow in the clinic.
These permeability calculations can be validated using experimental quantifications of myocardial blood flow (MBF). The perfusion (μm3s−1) into a given region of the myocardium is obtained by integrating the Darcy velocity over a cross-sectional area A (μm2):
| (4) |
where n is the unit vector normal to A. If n is parallel to the principal axis e1 and the pressure gradient is given by a uniform pressure drop4 of Δp = 15 mmHg over an arteriolar–venular path length28 of l = 310μm, then
| (5) |
where the factor 0.133 × 10⁻³ converts from mmHg to kg μm−1 s−2, and K11 is in μm3s kg−1. Alternatively,
| (6) |
where the factor of 60 converts from min to s, and ρ = 1.053 g mL−1 is the myocardial density32. Substituting Equation (6) into (5) yielded an estimated MBF in the range 2.4–5.5 mL min−1 g−1 depending on transmural depth. Using magnetic resonance imaging via a spin-labelling technique, Waller et al. 33 measured a MBF of 3.5 mL min−1 g−1 in the rat, which is within this predicted range.
This study has revealed the transmural variation in the orientation of the myocardial capillary network, which can be characterized by capillaries aligned with the longitudinal, sheet or sheet-normal directions. Combining mathematical averaging techniques with detailed anatomical data enabled the extraction of a permeability tensor, which is a physiologically relevant metric for characterizing myocardial perfusion. This permeability tensor was shown to be highly sensitive to capillary diameters, which exhibit a strong dependence on transmural location. Future research will involve comparing a continuum-based Darcy flow model parameterized by these permeability values to a flow solution within the discrete vascular network estimated via the optimization procedure of Fry et al.6, which constrains capillary shear stress and pressure to within a physiological range.
Supplementary Material
Acknowledgments
The authors acknowledge support from the Virtual Physiological Rat Project (NIH1 P50 GM094503-1), the EPSRC (Engineering and Physical Sciences Research Council) under grant numbers EP/F043929/1 and EP/G007527/2, and Award No. KUK-C1-013-04 made by King Abdullah University of Science and Technology (KAUST). The authors would also like to thank Prof. Timothy W. Secomb (University of Arizona) for helpful scientific discussions.
References
- 1.Bassingthwaighte JB, Yipintsoi T, Harvey RB. Microvasculature of the dog left ventricular myocardium. Microvasc Res. 1974;7:229–249. doi: 10.1016/0026-2862(74)90008-9. [DOI] [PMC free article] [PubMed] [Google Scholar]
- 2.Beard DA, Bassingthwaighte JB. Advection and diffusion of substances in biological tissues with complex vascular networks. Ann Biomed Eng. 2000;28:253–268. doi: 10.1114/1.273. [DOI] [PMC free article] [PubMed] [Google Scholar]
- 3.Chapelle D, Gerbeau J-F, Sainte-Marie J, Vignon-Clementel IE. A poroelastic model valid in large strains with applications to perfusion in cardiac modeling. Comput Mech. 2010;46:91–101. [Google Scholar]
- 4.Chilian WM, Layne SM, Klausner EC, Eastham CL, Marcus ML. Redistribution of coronary microvascular resistance produced by dipyridamole. Am J Physiol Heart Circ Physiol. 1989;256:H383–H390. doi: 10.1152/ajpheart.1989.256.2.H383. [DOI] [PubMed] [Google Scholar]
- 5.Cookson AN, Lee J, Michler C, Chabiniok R, Hyde E, Nordsletten DA, Sinclair M, Siebes M, Smith NP. A novel porous mechanical framework for modelling the interaction between coronary perfusion and myocardial mechanics. J Biomech. 2012;45:850–855. doi: 10.1016/j.jbiomech.2011.11.026. [DOI] [PMC free article] [PubMed] [Google Scholar]
- 6.Fry BC, Lee J, Smith NP, Secomb TW. Estimation of blood flow rates in large microvascular networks. Microcirculation. 2012;19:530–538. doi: 10.1111/j.1549-8719.2012.00184.x. [DOI] [PMC free article] [PubMed] [Google Scholar]
- 7.Goldman D, Popel AS. A computational study of the effect of capillary network anastomoses and tortuosity on oxygen transport. J Theor Biol. 2000;206:181–194. doi: 10.1006/jtbi.2000.2113. [DOI] [PubMed] [Google Scholar]
- 8.Goto M, Flynn AE, Doucette JW, Jansen CM, Stork MM, Coggins DL, Muehrcke DD, Husseini WK, Hoffman JI. Cardiac contraction affects deep myocardial vessels predominantly. Am J Physiol Heart Circ Physiol. 1991;261:H1417–H1429. doi: 10.1152/ajpheart.1991.261.5.H1417. [DOI] [PubMed] [Google Scholar]
- 9.Hoffman JIE. Transmural myocardial perfusion. Prog Cardiovasc Dis. 1987;29:429–464. doi: 10.1016/0033-0620(87)90016-8. [DOI] [PubMed] [Google Scholar]
- 10.Hyde ER, Chabiniok R, Nordsletten DA, Smith NP. Parameterisation of multiscale continuum perfusion models from discrete vascular networks. Med Biol Eng Comput. 2013;51:557–70. doi: 10.1007/s11517-012-1025-2. [DOI] [PMC free article] [PubMed] [Google Scholar]
- 11.Hyde ER, Cookson AN, Lee J, Michler C, Goyal A, Sochi T, Chabiniok R, Sinclair M, Nordsletten D, Spaan J, van den Wijngaard JP, Siebes M, Smith NP. Multiscale parameterisation of a myocardial perfusion model using whole-organ arterial networks. Ann Biomed Eng. 2014;42:797–811. doi: 10.1007/s10439-013-0951-y. [DOI] [PubMed] [Google Scholar]
- 12.Kaneko N, Matsuda R, Toda M, Shimamoto K. Three-dimensional reconstruction of the human capillary network and the intramyocardial micronecrosis. Am J Physiol Heart Circ Physiol. 2011;300:H754–H761. doi: 10.1152/ajpheart.00486.2010. [DOI] [PubMed] [Google Scholar]
- 13.Kassab GS, Fung YCB. Topology and dimensions of pig coronary capillary network. Am J Physiol Heart Circ Physiol. 1994;267:H319–H325. doi: 10.1152/ajpheart.1994.267.1.H319. [DOI] [PubMed] [Google Scholar]
- 14.Kassab GS, Le KN, Fung YCB. A hemodynamic analysis of coronary capillary blood flow based on anatomic and distensibility data. Am J Physiol Heart Circ Physiol. 1999;277:H2158–H2166. doi: 10.1152/ajpheart.1999.277.6.H2158. [DOI] [PubMed] [Google Scholar]
- 15.Kiyooka T, Hiramatsu O, Shigeto F, Nakamoto H, Tachibana H, Yada T, Ogasawara Y, Kajiya M, Morimoto T, Morizane Y, Mohri S, Shimizu J, Ohe T, Kajiya F. Direct observation of epicardial coronary capillary hemodynamics during reactive hyperemia and during adenosine administration by intravital video microscopy. Am J Physiol Heart Circ Physiol. 2005;288:1437–1443. doi: 10.1152/ajpheart.00088.2004. [DOI] [PubMed] [Google Scholar]
- 16.Le Grice IJ, Smaill BH, Chai LZ, Edgar SG, Gavin JB, Hunter PJ. Laminar structure of the heart: Ventricular myocyte arrangement and connective tissue architecture in the dog. Am J Physiol Heart Circ Physiol. 1995;269:H571–H582. doi: 10.1152/ajpheart.1995.269.2.H571. [DOI] [PubMed] [Google Scholar]
- 17.Lee J, Niederer S, Nordsletten D, Le Grice I, Smaill B, Kay D, Smith N. Coupling contraction, excitation, ventricular and coronary blood flow across scale and physics in the heart. Phil Trans R Soc A. 2009;367:2311–2331. doi: 10.1098/rsta.2008.0311. [DOI] [PubMed] [Google Scholar]
- 18.Lorthois S, Cassot F, Lauwers F. Simulation study of brain blood flow regulation by intra-cortical arterioles in an anatomically accurate large human vascular network: Part I: Methodology and baseline flow. NeuroImage. 2011;54:1031–1042. doi: 10.1016/j.neuroimage.2010.09.032. [DOI] [PubMed] [Google Scholar]
- 19.May-Newman K, Mathieu-Costello O, Omens JH, Klumb K, McCulloch AD. Transmural distribution of capillary morphology as a function of coronary perfusion pressure in the resting canine heart. Microvasc Res. 1995;50:381–396. doi: 10.1006/mvre.1995.1066. [DOI] [PubMed] [Google Scholar]
- 20.McDonagh P, Hokama JY. Microvascular perfusion and transport in the diabetic heart. Microcirculation. 2000;7:163–181. [PubMed] [Google Scholar]
- 21.Poole DC, Batra S, Mathieu-Costello O, Rakusan K. Capillary geometrical changes with fiber shortening in rat myocardium. Circulation Research. 1992;70:697–706. doi: 10.1161/01.res.70.4.697. [DOI] [PubMed] [Google Scholar]
- 22.Potter R, Groom A. Capillary diameter and geometry in cardiac and skeletal muscle studied by means of corrosion casts. Microvasc Res. 1983;25:68–84. doi: 10.1016/0026-2862(83)90044-4. [DOI] [PubMed] [Google Scholar]
- 23.Pries AR, Secomb TW. Microvascular blood viscosity in vivo and the endothelial surface layer. Am J Physiol Heart Circ Physiol. 2005;289:H2657–H2664. doi: 10.1152/ajpheart.00297.2005. [DOI] [PubMed] [Google Scholar]
- 24.Secomb T, Hsu R, Beamer N, Coull B. Theoretical simulation of oxygen transport to brain by networks of microvessels: Effects of oxygen supply and demand on tissue hypoxia. Microcirculation. 2000;7:237–247. [PubMed] [Google Scholar]
- 25.Shipley RJ, Chapman SJ. Multiscale modelling of fluid and drug transport in vascular tumours. Bull Math Bio. 2010;72:1464–1491. doi: 10.1007/s11538-010-9504-9. [DOI] [PubMed] [Google Scholar]
- 26.Smith AF. DPhil Thesis. University of Oxford; 2013. Multi-scale modelling of blood flow in the coronary microcirculation. [Google Scholar]
- 27.Smith NP, Kassab GS. Analysis of coronary blood flow interaction with myocardial mechanics based on anatomical models. Phil Trans R Soc A. 2001;359:1251–1262. [Google Scholar]
- 28.Toborg M. The microcirculatory bed in the myocardium of the rat and the cat. Z Zellforsch. 1972;123:369–394. [PubMed] [Google Scholar]
- 29.Tomanek RJ, Searls JC, Lachenbruch PA. Quantitative changes in the capillary bed during developing, peak, and stabilized cardiac hypertrophy in the spontaneously hypertensive rat. Circ Res. 1982;51:295–304. doi: 10.1161/01.res.51.3.295. [DOI] [PubMed] [Google Scholar]
- 30.van de Hoef TP, Nolte F, Rolandi MC, Piek JJ, van den Wijngaard JP, Spaan JA, Siebes M. Coronary pressure-flow relations as basis for the understanding of coronary physiology. J Mol Cell Cardiol. 2012;52: 786–793. doi: 10.1016/j.yjmcc.2011.07.025. [DOI] [PubMed] [Google Scholar]
- 31.van den Wijngaard JPHM, Schwarz JCV, van Horssen P, van Lier MGJTB, Dobbe JGG, Spaan JAE, Siebes M. 3D imaging of vascular networks for biophysical modeling of perfusion distribution within the heart. Journal of Biomechanics. 2013;46:229–239. doi: 10.1016/j.jbiomech.2012.11.027. [DOI] [PubMed] [Google Scholar]
- 32.Vinnakota KC, Bassingthwaighte JB. Myocardial density and composition: a basis for calculating intracellular metabolite concentrations. Am J Physiol Heart Circ Physiol. 2004;286:1742–1749. doi: 10.1152/ajpheart.00478.2003. [DOI] [PubMed] [Google Scholar]
- 33.Waller C, Kahler E, Hiller KH, Hu K, Nahrendorf M, Voll S, Haase A, Ertl G, Bauer WR. Myocardial perfusion and intracapillary blood volume in rats at rest and with coronary dilatation: MR imaging in vivo with use of a spin-labeling technique. Radiology. 2000;215:189–197. doi: 10.1148/radiology.215.1.r00ap07189. [DOI] [PubMed] [Google Scholar]
- 34.Wieringa PA, Spaan JAE, Stassen HG, Laird JD. Heterogeneous flow distribution in a three dimensional network simulation of the myocardial microcirculation - A hypothesis. Microcirculation. 1982;2:195–216. [Google Scholar]
Associated Data
This section collects any data citations, data availability statements, or supplementary materials included in this article.


