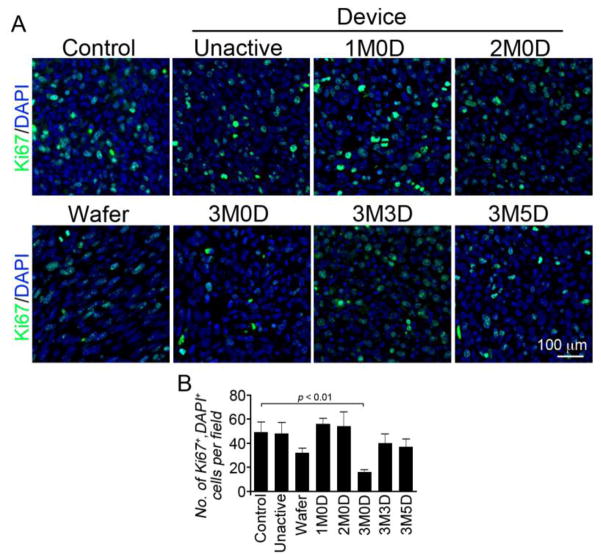
Figure 5. Immunohistological results of Ki67 staining.
(A) Ki67 positive cells are green and cell nuclei are blue. Each panel is a representative image from each efficacy study group. The 3M0D (3 membranes activated on day 0) panel contains the fewest number of Ki67 positive cells. (B) Quantitative results obtained by averaging 3 representative images from each group. The two longest surviving groups, wafer and 3M0D, have the lowest levels of Ki67 positive cells.

