Abstract
Craniosynostosis is a condition defined by premature closure of cranial vault sutures, which is associated with abnormalities of the brain and skull. Many causal relationships between discovered mutations and premature suture closure have been proposed but an understanding of the precise mechanisms remains elusive. This article describes a computational framework of biological processes underlying cranial growth that will enable a hypothesis driven investigation of craniosynostosis phenotypes using reaction-diffusion-advection methods and the finite element method. Primary centers of ossification in cranial vault are found using activator-substrate model that represents the behavior of key molecules for bone formation. Biomechanical effects due to the interaction between growing bone and soft tissue is investigated to elucidate the mechanism of growth of cranial vault.
INTRODUCTION
Craniosynostosis is a condition defined by premature closure of cranial vault sutures. The human vault is composed of several bones and the spaces between the bones are called as sutures. As humans develop the sutures become closed but in some cases the closure occurs prematurely so that it interrupts growth of brain and causes abnormalities of the head shape (Tubbs et al., 2012). The condition is caused by direct effects of missense mutations that cause changes in processes such as differentiation of osteoblast lineage cells (OLCs), which contribute to bone morphogenesis, but also indirect effects associated with the biomechanics of growing tissues.
In general, it has been found that biological morphogenesis comes from pattern formation due to some interactions of molecules. Turing (1952) has shown that two interacting molecules can form an inhomogeneous pattern of distribution under certain conditions. Mathematical models for some kinds of relations between the two interacting molecules have been established by Gierer et al. (1972) and Koch et al. (1994). The models are based on a reaction-diffusion system of molecules which regulate each other. The models can be classified by the activator-inhibitor model and the activator-substrate model based on types of the regulation. In activator-inhibitor model one molecule (activator) promote a production rate of the other molecule (inhibitor) while the inhibitor plays a role of antagonist of the activator restricting the production of it. In activator-substrate model the production of activator molecule is enhanced by consuming its antagonist molecule (substrate) so that the substrate inhibits the production of the activator by its depletion. In this paper, we assume these type of reaction-diffusion system is also responsible for the formation of the cranial vault. Some previous studies show that the expression of various proteins contribute to the differentiation of osteoblast cells from undifferentiated mesenchymal precursor cells in the formation of bone (Marie et al., 2002, Gordeladze et al., 2009, Tubbs et al., 2012). Among the proteins associated with bone formation, bone morphogenetic protein 2 (BMP-2) plays a key role for differentiation of mesenchymal cells into osteoblast cells (Wan et al., 2005, Marie et al., 2002) and are regulated by its antagonist, Noggin (Gazzerro et al., 1998, Groppe et al., 2003, Warren et al., 2003, Zhu et al., 2006). Based on these studies we used finite element method to solve the reaction-diffusion model of BMP-2 and Noggin, to find the primary centers of ossification.
In addition to the effects of missense mutations in molecular level, the biomechanical force on the growing bone and tissue in continuum level may also affect to morphogenesis of cranial vault. The effects of biomechanical loading on bone growth has been discussed by Lin et al. (2009) and biomechanical analysis of craniosynostosis correction has been introduced by Wolanski et al. (2013). The computational framework developed here attempts to couple reaction-diffusion models with continuum mechanics to account for biomechanical forces and their relationship with molecular and cellular dynamics and the growth of skull. At the continuum level, adaptive remeshing is used to capture varying growth dynamics and suture patency patterns which are compared to experimental results.
Our goal is to develop a multiscale computational model to help elucidate mechanisms associated with the growth of cranial vault so that the condition of craniosynostosis from cell activity to skull shape can be better understood. Effects of imbalance of the composition of proteins on abnormal ossification and effect of compensatory growth of the bones due to early closed suture on the morphogenesis are investigated.
MATERIALS AND METHODS
Formation of primary centers of ossification in cranial vault
In the very early stage of development of human head, there are some cells surrounding brain, which are called mesenchymal cells. The mesenchymal cells express various kinds of molecules. Then through some actions of the molecules, the mesenchymal cells differentiate into osteoblasts cells, which eventually become calcified and form an initial bone (Gordeladze et al., 2009). Among the molecules which are expressed from mesenchymal cells some kinds of molecules play the role of activator, which activate the differentiation of mesenchymal cells while some other molecules play the role of antagonist of activator.
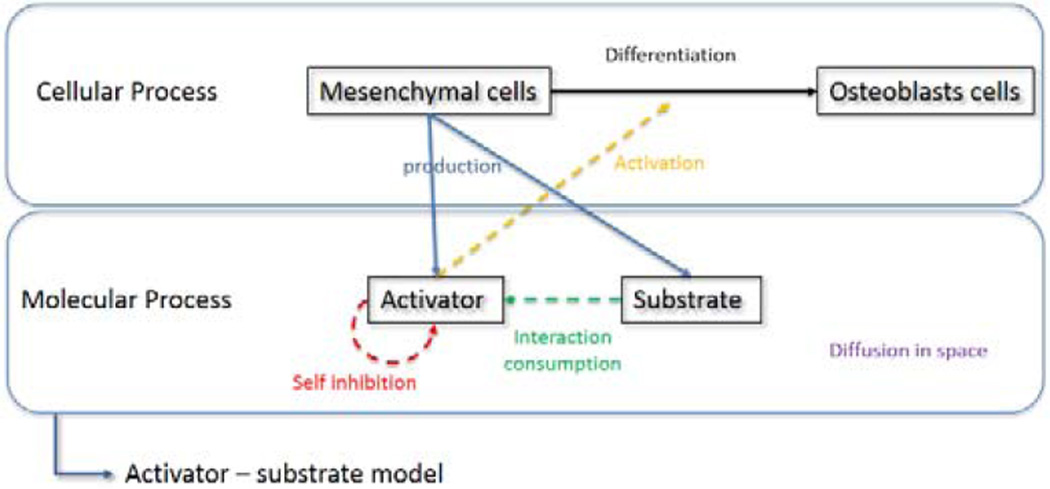
In nature, most biological pattern is formed by this kind of interaction between two or more molecules (Turing et al., 1952). And this regulatory action between molecules can be represented by some mathematical models (Gierer et al., 1972 Koch et al., 1994). In this paper we assume that BMP-2 and Noggin are the two key molecules that act as activator and its antagonist for differentiation of mesenchymal cells in cranial vault (Groppe et al., 2002, Warren et al., 2003). The regulatory relation between BMP-2 and Noggin can be modeled by activator-substrate model (Garzon-Alvarado et al., 2013). Figure 1 is a schematic diagram of the activator-substrate model in molecular process and related cell differentiation process. In the model, the activator molecules are self-inhibited by their excess. The activator and its antagonist interact with each other. The activator molecules are enhanced by consuming their antagonist molecules which are depleted by the interaction with the activator at the same time. In other words, the activator molecules can be regulated by the depletion of the antagonist molecule, which can be interpreted as a substrate. Both activator and substrate molecules diffuse out in space with different speed. The model can be represented using following equations.
| (1a) |
| (1b) |
Fig. 1.
schematic diagram of control system of molecular and cellular process
In these equations a and s represent the concentration of activator (BMP-2) and substrate molecules (Noggin) respectively. C is concentration of mesenchymal cells that release activator and substrate. The terms αa and αs quantify the production of each molecule. The variable μ is a constant that quantifies the self-inhibition of activator by its excess. The variable γ is a constant associated with interaction between two molecules. Da and Ds are diffusion coefficients of each molecule and operator ∇2 is the Laplace operator which describes diffusion of variables in space. The hypothesis in this article is that through the regulatory process of reaction and diffusion, the distribution of two factors form a certain pattern in space and primary centers of ossification starts at the points where the concentration of activator is high. Model parameters in Eq. (1) should meet some constraints for the molecules to make a certain inhomogeneous pattern in space. The restrictions can be determined by linear stability analysis (Koch et al., 1994). Steady-state, homogeneous concentration of two molecules (a0 for activator and s0 for substrate) can be obtained by letting time derivative term and diffusion term in Eq. (1) be zero as shown in Eq. (2).
| (2) |
By giving small perturbations on this steady-state homogeneous solution using Eq. (3), linear stability analysis can give the region of combination of parameters where small perturbation at the initial time grows and develops an inhomogeneous spatial pattern.
| (3a) |
| (3b) |
In the Eq. (3b) k represents eigen value associated with frequency of perturbation ω. The region can be represented by Eq. (4). Details of the analysis can be found in Koch et al. (1994).
| (4) |
Currently we are using parameters from literature but in the future these parameters will be determined from experimental data with mice (Martinez-Abadias et al., 2010 and 2013). At this step, several sets of parameters are used to investigate the effect of variation of parameters. The parameters used are arranged in Table 1. Parameters of case 1 (shown in Table 1; diffusion coefficient of substrate is small) are out of the suitable region for pattern formation. Parameters in case 2 and 3 (shown in Table 1; diffusion coefficient of substrate is medium and large respectively) meet the restrictions for forming a spatial pattern by increasing diffusion coefficient of substrate but in the latter case difference between diffusion coefficients of activator and substrate is larger than in the former case.
Table 1.
Parameters for the reaction-diffusion model.
| Parameters | Value | Units | |
|---|---|---|---|
| C | 4.0×10⁹ | cell / mm3 | |
| αa | 4.5×10⁻¹⁶ | ng / (cell × s) | |
| αs | 4.0×10⁻¹⁵ | ng / (cell × s) | |
| μ | 4.5×10⁻¹⁵ | mm3 / (cell × s) | |
| γ | 4.5×10⁻¹⁵ | mm9 / (cell × s × ng2) | |
| Da | 7.3×10⁻⁵ | mm2 / s | |
| Ds | Case1 | 6.3×10⁻⁶ | mm2 / s |
| Case2 | 6.3×10⁻⁴ | ||
| Case3 | 6.3×10⁻³ | ||
Numerical implementation
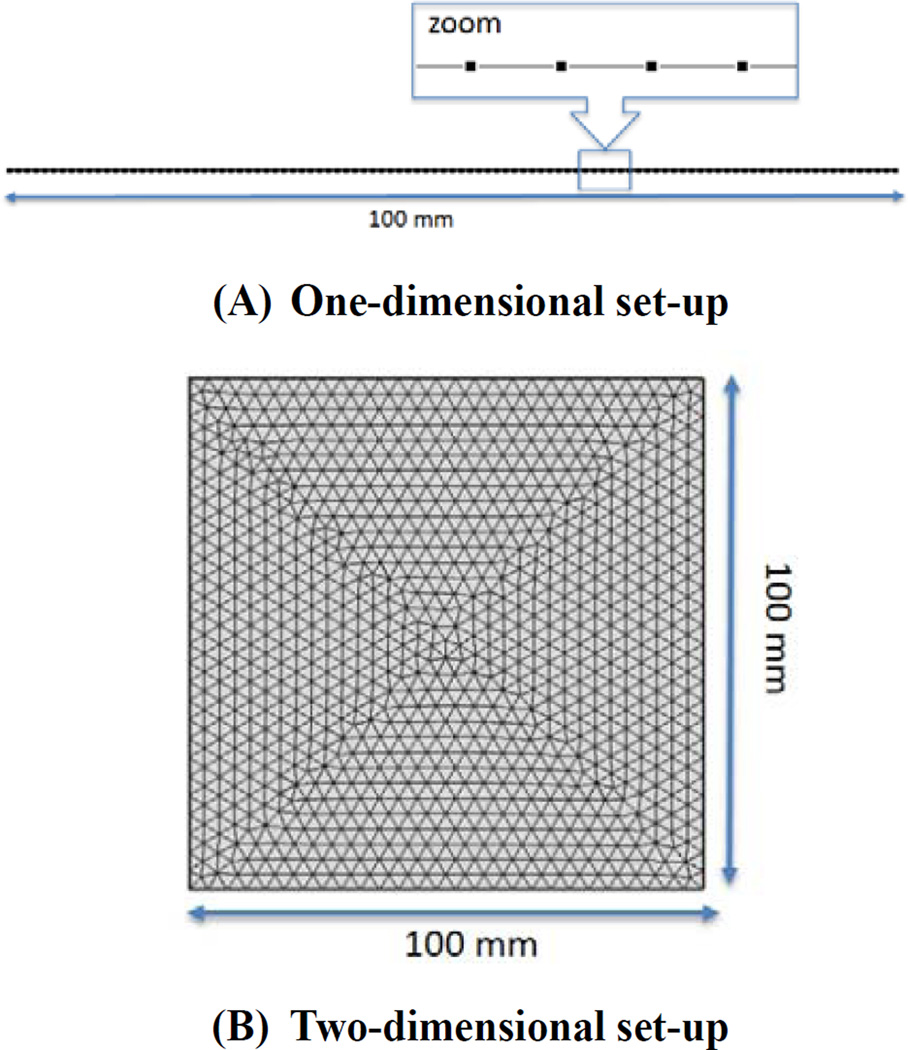
The reaction-diffusion equations (Eq. (1)) are numerically solved with parameters in three cases using the finite element method. Commercial software Comsol Multiphysics 4.3 was used for its solution. Analysis was conducted on one-dimensional domain first to understand the interaction process of key molecules more easily, and was then expanded to two-dimensional domain. Figure 2 shows the calculation domain for 1D and 2D analysis. Randomly distributed concentrations of activator and substrate were given as initial condition with a disturbance of 0.05% on the steady-state concentrations obtained from Eq. (2) (a0 = 0.9889 ng/mm3 s0 = 0.9090 ng/mm3). Time interval for numerical analysis was selected as 10 hours.
Fig. 2.
Calculation domain for (A)1D and (B)2D analysis
RESULTS
Formation of primary centers of ossification in cranial vault
Temporal and spatial changes of distribution of activator and substrate molecule are examined from the numerical solution of the Eq. (1).
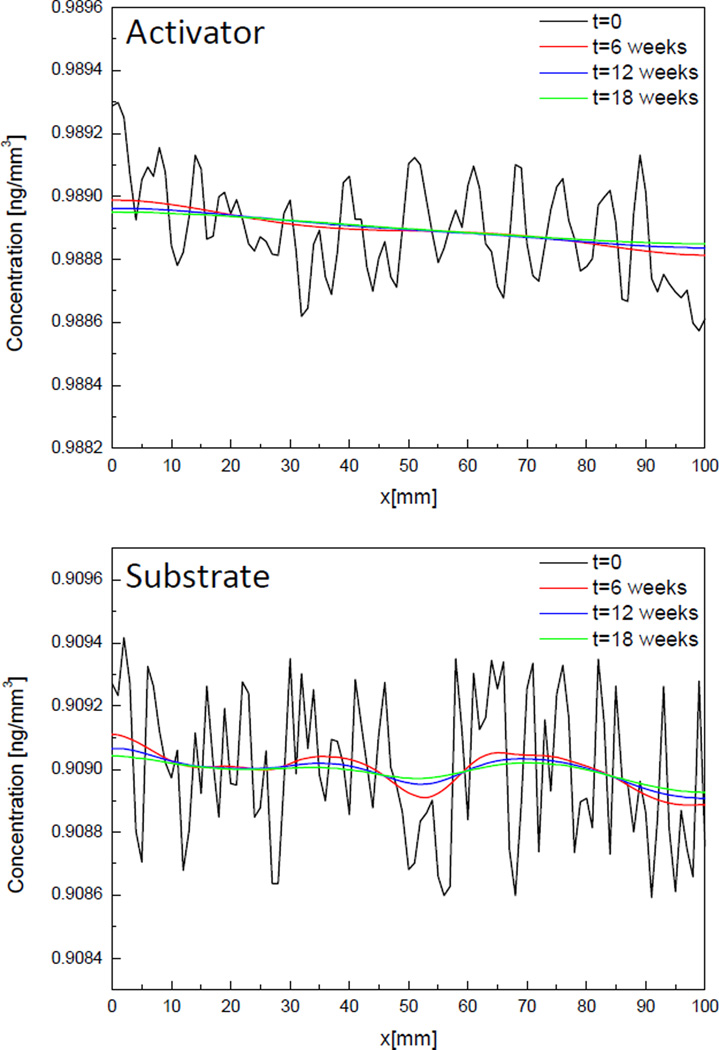
Figure 3 shows the variation of concentrations of activator and substrate over time in case 1 where diffusion coefficient of substrate is small than that of activator. The black line represents the distribution of molecules at initial time. The molecules are distributed randomly in the domain with some perturbations on steady state value (a0 = 0.9889 ng/mm3 s0 = 0.9090 ng/mm3). The distribution after 6 weeks (red, blue and green lines) show that the initial perturbation diminishes over time. It means that small perturbations at initial time don’t grow to form a certain spatial pattern but just diffuse out to go homogeneous state in space.
Fig. 3.
Change of concentration of activator and substrate molecules over time in 1D, Case 1.
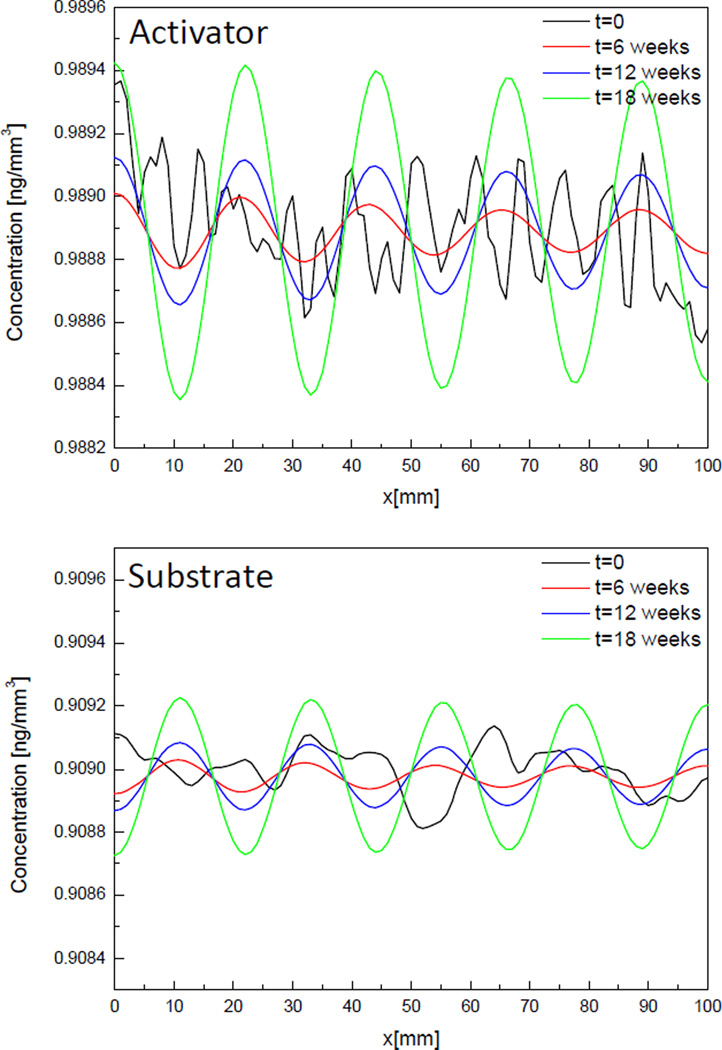
Results of case 2 where the diffusion rate of substrate increases to become larger than that of activator and so that all parameters satisfy the Eq. (4) are shown in Fig. 4. The main difference between Fig. 3 and Fig. 4 is that while the distribution of molecules goes flat after a few weeks in Fig 3, a spatial pattern of distribution of molecules is shown after 6 weeks in Fig. 4. Looking at the change of concentration of activator in Fig. 4, initial distribution (black line) looks random in space but after 6 weeks and more (red, blue and green line) distribution of molecules form a specific pattern showing 5 peaks in the domain. Initial small perturbation makes distribution of molecules unstable in space so that they form a specific spatial pattern after a few weeks. The amplitude of the pattern grows as time goes while the locations of peaks don’t change. The maximum and minimum concentration of activator are in the range of 1% of the steady-state concentration (a0 = 0.9889 ng/mm3). These results are same for substrate but activator and substrate have the opposite phase from each other because generation of activator molecules is enhanced by consuming substrate based on the activator-substrate model.
Fig. 4.
Change of concentration of activator and substrate molecules over time in 1D, Case 2.
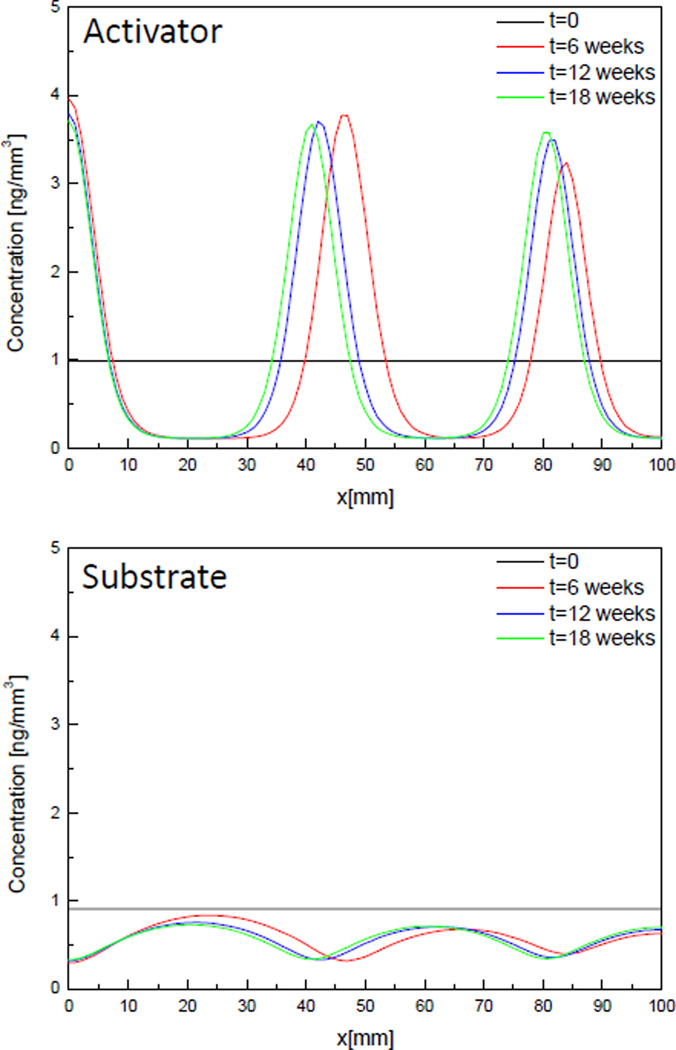
Results of case 3 where the difference between diffusion coefficients of activator and substrate is large (Ds>>Da) are shown in Fig. 5. Similarly to the results in case 2, small perturbation on concentration of molecules at initial time (black line; perturbation cannot be seen because of the scale of graph) grows to form a spatial pattern after 6 weeks (red, blue and green line). In case 3 the pattern hardly grows and become stable in time after 6 weeks that is much faster than in case 2 where the pattern keeps growing after 18 weeks. The maximum concentration of activator in Fig. 5 reaches near 400% of the steady-state concentration while that in case 2 is in 1% of steady-state condition (Fig. 4). It means that pattern formation of molecules is much more active in case 3 than in case 2, that is, molecules are much more highly concentrated in some specific locations in a shorter time when substrate diffuses out in space much faster than activator does. There are the less number of peaks of concentration in case 3 (Fig. 5) compared to case 2 (Fig. 4). As a result, a faster diffusion of substrate compared to that of activator result in active pattern formation in space and small number of highly concentrated points that leads to a larger distance between the concentrated points. Based on the fact that activator molecules activate differentiation of mesenchymal cells to osteoblast cells which contribute to formation of bone, the points where concentration of activator is high can be considered as primary centers of ossification.
Fig. 5.
Change of concentration of activator and substrate molecules over time in 1D, Case 3.
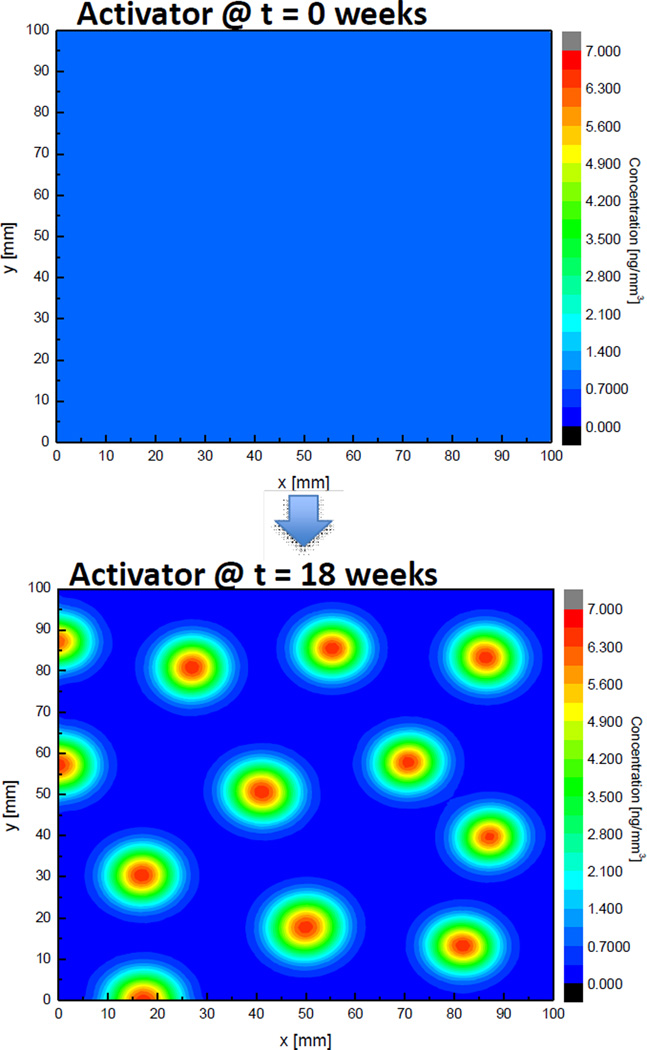
Result of two-dimensional analysis with parameters in case 3 is shown in Fig 6. It shows a similar result with the result of 1D analysis; small initial disturbance of concentrations develops to form a spatial pattern. Activator molecules are concentrated at some specific points showing “island”-like shape with peaks in red. Currently we are exploring if these “islands” can be considered that primary centers of ossification for making cranial bone initiate at the points where the concentration of activator molecule is dense.
Fig. 6.
Change of concentration of activator molecule over time in 2D, Case 3.
DISCUSSION AND CONCLUSIONS
A mathematical model of activator-substrate molecules which contribute to differentiation of mesenchymal cells into osteoblasts cells is solved by finite element method to find primary centers of ossification in the cranial vault. Initial small disturbance on steady-state concentration of the molecules grows in time and forms a certain spatial pattern in 1D and 2D analysis when model parameters used are in the unstable region determined by linear stability analysis. It is found that faster diffusion of substrate molecules in space than that of activator leads to more intense pattern forming with smaller number of highly concentrated points. Primary centers of ossification in cranial vault can be found at the points where the concentration of activator molecules is high.
At this step the model parameters are used based on the previous study (Garzon-Alvarado et al., 2013) but it will be examined more and finally determined with help of experimental study with mice which is going on with our research project. Considering the fact that the size of mouse head at early stage of bone formation is much smaller than 100 mm which is the length of domain used in this study, the effect of length scale should be considered when the parameters are determined using experimental data. Combining those biological investigation and computational model introduced in this paper will give more realistic results which can predict real bone formation in human cranial vault.
Next step of this research will include effects of biomechanical forces between the bone and soft tissue underlying the bone as skull grows on the morphogenesis of cranial vault. We hope this multiscale computational model will help elucidate mechanisms associated with the growth of cranial vault so that the condition of craniosynostosis from cell activities to continuum behavior can be discovered.
NOMENCLATURE
- C
concentration of mesenchymal cells [cell/mm3]
- D
diffusion coefficient [mm2/cell]
- a
concentration of activator molecules [ng/mm3]
- s
concentration of substrate molecules [ng/mm3]
- α
production rate of molecules [ng/(cell· s)]
- μ
constant quantifying self-inhibition of a factor [mm3/(cell·s)]
- γ
constant quantifying interaction between two factors [mm9/(cell·s·ng2)]
- ()a
value associated to activator
- ()s
value associated to substrate
- ()0
value at initial time
Contributor Information
Chanyoung Lee, The Pennsylvania State University, State College, PA, USA.
Joan T. Richtsmeier, The Pennsylvania State University, State College, PA, USA
Reuben H. Kraft, The Pennsylvania State University, State College, PA, USA
REFERENCES
- Garzόn-Alvarado DA, Gonzélez A, Gutiérrez ML. Growth of the flat bones of the membranous neurocranium: A Computational Model. Computer Methods and Programs in Biomedicine. 2013;112:655–664. doi: 10.1016/j.cmpb.2013.07.027. [DOI] [PubMed] [Google Scholar]
- Gazzerro E, Gangji V, Canalis E. Bone Morphgenetic Proteins Induce the Expression of Noggin, Which Limits Their Activity in Cultured Rat Osteoblasts. Journal of Clinical Investigation. 1998;102:2106–2114. doi: 10.1172/JCI3459. [DOI] [PMC free article] [PubMed] [Google Scholar]
- Gierer A, Meinhardt H. A Theory of Biological Pattern Formation. Kibernetik. 1972;12:30–39. doi: 10.1007/BF00289234. [DOI] [PubMed] [Google Scholar]
- Gordeladze JO, Reseland JE, Duroux-Richard I, Apparailly F, Jorgensen C. From Stem Cells to Bone: Phenotype Acquisition, Stabilization and Tissue Engineering in Animal Models. ILAR Journal. 2009;51:42–61. doi: 10.1093/ilar.51.1.42. [DOI] [PubMed] [Google Scholar]
- Groppe J, Greenwald J, Wiater E, Rodriguez-Leon J, Economides AN, Kwiatkowski W, Baban K, Affolter M, Vale WW, Izpisua Belmonte JC, Choe S. Structural Basis of BMP Signaling Inhibition by Noggin, a Novel Twelve-Membered Cystine Knot Protein. The Journal of Bone and Joint Surgery. 2002;85:52–58. doi: 10.2106/00004623-200300003-00010. [DOI] [PubMed] [Google Scholar]
- Koch AJ, Meinhardt H. Biological Pattern Formation: From Basic Mechanisms to Complex Structures. Reviews of Modern Physics. 1994;66:1481–1507. [Google Scholar]
- Lin H, Aubin C, Parent S, Villemure I. Mechanobiological Bone Growth: Comparative Analysis of Two Biomechanical Modeling Approaches. Medical & Biological Engineering & Computing. 2009;47:357–366. doi: 10.1007/s11517-008-0425-9. [DOI] [PubMed] [Google Scholar]
- Marie PJ, Debiais F, Haÿ E. Regulation of Human Cranial Osteoblast Phenotype by FGF-2, FGFR-2 and BMP-2 Signaling. Histol Histopathol. 2002;17:877–885. doi: 10.14670/HH-17.877. [DOI] [PubMed] [Google Scholar]
- Martínez-Abadías N, Percival C, Aldridge K, Hill C, Ryan T, Sirivunnabood S, Wang YL, Jabs EW, Richtsmeier JT. Beyond the closed suture in Apert syndrome mouse models: evidence of primary effects of FGFR2 signaling on facial shpe at birth. Developmental Dynamics. 2010;239:3058–3071. doi: 10.1002/dvdy.22414. [DOI] [PMC free article] [PubMed] [Google Scholar]
- Martínez-Abadías N, Motch S, Pankratz T, Wang YL, Aldridge K, Jabs EW, Richtsmeier JT. Tissue specific response to aberrant Fgf signaling in complex head phenotypes. Developmental Dynamics. 2013;242:80–94. doi: 10.1002/dvdy.23903. [DOI] [PMC free article] [PubMed] [Google Scholar]
- Tubbs RS, Bosmia AN, Cohen-Gadol AA. The human calvaria: a Review of Embryology, Anatomy, Pathology, and Molecular Development. Child’s Nervous System. 2012;28:23–31. doi: 10.1007/s00381-011-1637-0. [DOI] [PubMed] [Google Scholar]
- Turing AM. The Chemical Basis of Morphogenesis. Philosophical Transactions of the Royal Society of London. 1952;237:37–72. [Google Scholar]
- Warren SM, Brunet LJ, Harland RM, Economides AN, Longaker MT. The BMP Antagonist Noggin Regulates Cranial Suture Fusion. Nature. 2003;422:625–629. doi: 10.1038/nature01545. [DOI] [PubMed] [Google Scholar]
- Wolański W, Larysz D, Gzik M, Kawlewska E. Computational Methods for Biomedical Image Processing and Analysis: Modeling and Biomechanical Analysis of Craniosynostosis Correction with the Use of Finite Element Method. International Journal for Numerical Methods in Biomedical Engineering. 2013;29:916–925. doi: 10.1002/cnm.2506. [DOI] [PubMed] [Google Scholar]
- Zhu W, Kim J, Cheng C, Rawlins BA, Boachie-Adjei O, Crystal RG, Hidaka C. Noggin Regulation of Bone Morphogenetic Protein (BMP) 2/7 Heterodimer Activity in Vitro. Bone. 2006;39:61–71. doi: 10.1016/j.bone.2005.12.018. [DOI] [PMC free article] [PubMed] [Google Scholar]


