

Abstract
Osteosarcoma is the most common primary bone tumor characterized by juvenile onset, tumor heterogeneity, and early pulmonary metastasis. Therapeutic improvement stagnates since more than two decades. Unlike major malignancies, biomarkers as prognostic factors at time of diagnosis are missing. Disease rareness hampers study recruitment of patient numbers sufficient to outweigh tumor heterogeneity. Here, we analyzed in a multicenter cohort the osteosarcoma microenvironment to reduce effects of tumor cell heterogeneity. We hypothesized that quantitative ratios of intratumoral CD8+T-cells to FOXP3+T-cells (CD8+/FOXP3+-ratios) provide strong prognostic information when analyzed by whole-slide imaging in diagnostic biopsies. We followed recommendations-for-tumor-marker-prognostic-studies (REMARK). From 150 included cases, patients with complete treatment were identified and assigned to the discovery (diagnosis before 2004) or the validation cohort (diagnosis 2004–2012). Highly standardized immunohistochemistry of CD8+ and FOXP3+, which was validated by methylation-specific gene analysis, was performed followed by whole-slide analysis and clinical outcome correlations. We observed improved estimated survival in patients with CD8+/FOXP3+-ratios above the median (3.08) compared to patients with lower CD8+/FOXP3+-ratios (p = 0.000001). No patients with a CD8+/FOXP3+-ratio above the third quartile died within the observation period (median follow-up 69 mo). Multivariate analysis demonstrated independence from current prognostic factors including metastasis and response to neoadjuvant chemotherapy. Data from an independent validation cohort confirmed improved survival (p = 0.001) in patients with CD8+/FOXP3+-ratios above 3.08. Multivariate analysis proofed that this observation was also independent from prognostic factors at diagnosis within the validation cohort. Intratumoral CD8+/FOXP3+-ratio in pretreatment biopsies separates patients with prolonged survival from non-survivors in osteosarcoma.
Keywords: CD8+ T cells, CD8/FOXP3-ratio, immunoscore, osteosarcoma, regulatory T cells, tumor microenvironment
Abbreviations: CONSORT, consolidated standard of reporting trials; COSS, Cooperative German–Austrian–Swiss Osteosarcoma Study Group; EORTC, the European Organization for Research and Treatment of Cancer; FFPE, formalin-fixed and paraffin embedded; IDO, Indoleamine 2, 3-dioxygenase; MAP, methotrexate-cisplatin-doxorubicin; PD-L1, Programmed-death-Ligand-1; REMARK, reporting recommendations for tumor marker prognostic studies; TIL, tumor infiltrating lymphocyte; TNFα, tumornecrosis factor-α; TNM-I, tumor, nodes, metastases-immuno; Treg, regulatory Tcell.
Introduction
Osteosarcoma is characterized by high vascularization, early metastasis mostly into the lung and poor prognosis. Since introduction of neo-adjuvant chemotherapy 30 y ago little further progress has been achieved.1 In fact, uniform neo-adjuvant chemotherapy is applied to all patients, although some patient subgroups might not benefit from chemotherapy.2 Prognostic biomarkers for risk stratification at the time of diagnosis are missing and are a major drawback in clinical testing of novel therapeutic agents.3 Candidate biomarkers derived from osteosarcoma tumor cells have been suggested, but clinical translation has been hampered by several factors including demanding methodology of promising prognostic parameters.4,5 Heterogeneity of tumor cells with various osteosarcoma subentities further complicates identification of robust biomarkers with broad clinical application. Alternatively, analysis of the tumor microenvironment for osteosarcoma outcome related biomarkers might be less dependent from the osteosarcoma subtype. It has been suggested in other tumors that intensity of tumor microenvironment infiltration with T-cells, especially cytotoxic tumor-infiltrating CD8+T-cells (CD8+TILs) allows more powerful prognostic staging than traditional staging and this is currently tested for some tumors in a multicenter study.6,7 The results from validation of intratumoral immune cells called “immunoscore” are considered as a new component for the classification of cancer, designated TNM-I (TNM-Immune).6 Furthermore, the segregation of tumors based on the presence or absence of T-cells in the microenvironment is important since novel drugs are available to boost the T-cell antitumor response.8 Whereas some drugs directly activate cytotoxic T-cells, several antibody-based drugs are now available to inhibit immunosuppressive pathways in the tumor microenvironment, i.e. by reduction of FOXP3+ regulatory T-cells (Tregs).8 Intratumoral accumulation of FOXP3+Tregs has been shown as a major immune escape mechanism of many tumors.9,10 In contrast to most tumors, presence of FOXP3+Tregs in osteosarcoma tumor lesions is completely unknown since data about FOXP3+Tregs in osteosarcoma are lacking. Only little quantitative information is available for the quantity of intratumoral CD8+TILs in osteosarcoma, and whether their frequency can predict osteosarcoma disease outcome.11–13 These short-comings might be largely explained by difficulties to perform sensitive and specific immunohistochemistry in bone tumor tissue. We have recently established standardized detection of FOXP3+cells and CD8+TILs in osteosarcoma by systematic optimization of antigen detection and demonstrated whole-slide imaging as superior quantification method compared to conventional spot based analysis in osteosarcoma.14 Here, we analyzed in a multicenter cohort of 150 osteosarcoma patients if CD8+TILs and FOXP3+ Tregs are substantially present in the osteosarcoma microenvironment and evaluated if these biomarkers alone or their ratio could be used as prognostic factors to predict osteosarcoma outcome at time of diagnosis previous to neoadjuvant chemotherapy. Furthermore, we validated our findings in an independent cohort of osteosarcoma patients.
Results
Patient characteristics
Biopsies from 150 treatment-naive patients were included in the study cohort. Of these samples, 95% showed more than 10 FOXP3+cells in the whole section. Similarly, 95% of investigated patients showed more than 30 CD8+cells. Representative immunostainings for CD8+ and FOXP3+ are shown in Figs. 1 A and B. For comparison of clinical outcome, 48 patients were excluded as required by the study design (see CONSORT flow diagram and study design, suppl. Fig. 1). 102 patients were further assessed in a discovery and validation cohort. Patient characteristics are shown in Table 1. The cohort showed representative correlations of major clinicopathological predictors to previously described osteosarcoma cohorts.15–19
Figure 1.

Estimated overall survival of the discovery cohort grouped for CD8+TIL- densities and correlation of CD8+TIL- densities with FOXP+-cell densities in pretreatment biopsies. (A) Representative FFPE osteosarcoma samples immunostained for FOXP3. Positive stained cells are shown in red and sections were counterstained by hematoxylin. (B) FFPE osteosarcoma samples immunostained for CD8. (C) Kaplan–Meier estimated overall survival of typically vascularized osteosarcoma patients of the discovery cohort with high (above third quartile), medium (between first and third quartile) and low (below first quartile) CD8+TIL-densities within whole slides of pretreatment biopsies. Narrow dotted line: patients with CD8+TIL-densities above the third quartile (n = 12) .Wide dotted line: Patients with CD8+TIL-densities between the first and third quartile (n = 31). Dashed line: Patients with CD8+TIL-densities below the first quartile (n = 15). Overall survival indicated in months. Cumulative survival indicated in percent. Patients at risk are indicated per year in the table below corresponding Kaplan–Meier Plot. Statistical significances as p-values by log- rank test. (D) Kaplan–Meier estimated overall survival of all patients of the discovery cohort with high (above third quartile), medium (between first and third quartile), and low (below first quartile) CD8+TIL-densities within whole slides of pretreatment biopsies. Narrow dotted line: patients with CD8+TIL-densities above the third quartile (n = 18).Wide dotted line: Patients with CD8+TIL-densities between the first and third quartile (n = 38). Dashed line: Patients with CD8+TIL-densities below the first quartile (n = 19). Overall survival indicated in months. Cumulative survival indicated in percent. Patients at risk are indicated per year in the table below corresponding Kaplan–Meier Plot. Statistical significances as p-values by log- rank test. (E) Distribution and correlation of CD8+TIL-densities and FOXP3+cell-densities in whole slides of pretreatment osteosarcoma biopsies of the discovery group (n = 75). Each dot represents one osteosarcoma sample. CD8+TIL- and FOXP3+cell-densities are indicated in positive stained cells per 0.1mm2 analyzed tumor area. Upper and lower lines indicate the 95% confidence interval. Statistical significance as two sided p-value by Pearson correlation, r indicates correlation coefficient.
Table 1.
Patient characteristics
| n = 102 | |
|---|---|
| Median age in years (range) | 15.5 (6–70) |
| Follow-up time in months (range) | 69.1 (3–252) |
| Gender | |
| Male | 61 |
| Female | 41 |
| Tumor site | |
| Femur | 54 |
| Tibia | 33 |
| Humerus | 5 |
| Fibula | 2 |
| Radius | 2 |
| Trunk | 6 |
| Primary metastasis | |
| Absent | 74 |
| Detected | 15 |
| NA | 13 |
| Primary or secondary osteosarcoma | |
| Primary | 102 |
| Secondary | 0 |
| Grade | |
| High-grade central osteosarcoma | 102 |
| Histological subtype | |
| Osteoblastic | 74 |
| Fibroblastic | 14 |
| Mixed chondro-/osteobalstic | 4 |
| Teleangiectatic | 7 |
| Sclerotic | 2 |
| Small cell | 1 |
| Tumor response to chemotherapy | |
| Good response | 56 |
| Poor response | 22 |
| NA | 24 |
| Surgical remission | |
| Good (wide/amputation/radical) | 89 |
| Bad (marginal/intralesional) | 5 |
| NA | 8 |
| Chemotherapy | 102 |
| NA: data not available |
Whole-slide analysis of CD8+TILs and FOXP3+cells in osteosarcoma tissue and relation to survival
We have previously demonstrated that a subpopulation of patients with atypical low osteosarcoma vascularization (below first quartile CD31-expression) showed a much better survival than osteosarcoma patients with normal or high vascularization.20 However, quantification of tumor vascularization in the majority of osteosarcoma patients with typical tumor vascularization could not add substantial information for outcome prediction at the time of diagnosis. Therefore, we asked at first, if whole-slide CD8+TIL-densities correlated with patient survival in those samples from the discovery cohort, which exhibited a typical vascularization for osteosarcoma. Indeed patients with increasing CD8+TIL-densities showed significant better estimated survival in univariate cox regression analysis (p = 0.032). Furthermore, multivariate Cox-regression analysis showed that this observation was independent from major clinicopathological variables at time of diagnosis including age, gender, and tumor location (p = 0.028). Accordingly patients with high (above third quartile) or intermediate (between first and third quartile) CD8+TIL-densities had a significant better estimated survival compared to patients with low (below first quartile) CD8+TIL-densities (p = 0.006; log-rank) (Fig. 1C). Improved survival with increasing CD8+TIL-densities could still be observed when the complete discovery group was analyzed (Fig. 1D).
Next, intratumoral whole-slide FOXP3+cell-densities were assessed as prognostic factor in the discovery cohort. Since characteristic FOXP3 gene demethylation is currently considered as the most specific regulatory T cell marker, we performed side-by-side comparison of immunohistochemistry-based FOXP3+cell quantification with frequencies of cells with Treg-specific demethylation pattern in 20 randomly selected osteosarcoma samples. We observed a significant correlation between number of cells positive for scurfin, the FOXP3-endoced protein by immunohistochemistry, and frequencies of T cells with demethylated FOXP3 gene locus (p = 0.018, Pearson).
Determination of intratumoral whole-slide FOXP3+cell-densities in the discovery cohort revealed an improved survival for patients with decreasing FOXP3+cell-densities, which was not dependent on low vascularized samples (Fig. S3). However, this observation held only true, when osteosarcoma samples with very high CD8+cell-densities (above third quartile) were excluded. In this case, univariate Cox-regression analysis revealed a significant better estimated survival (p = 0.006) and multivariate Cox-regression analysis showed that this effect was independent from major clinicopathological prognostic factors at time of diagnosis including primary metastasis, age, gender, and tumor location (p = 0.001). When patients were assigned to subgroups with low, intermediate or high FOXP3+cell-densities, estimated survival was significantly better in low and intermediate groups (p = 0.008; log rank) (Fig. S3).
Collectively, increasing CD8+TIL-densities but decreasing FOXP3+cell-densities in pretreatment biopsies indicated improved estimated survival rates. Given a strong correlation of CD8+TIL-densities with FOXP3+cell-densities in osteosarcoma biopsies (p = 5.17 × 1027; Pearson) (Fig.1 E), but opposing effects of both cell types on clinical outcome and biological function, further information might be gained, when CD8+TIL-densities were analyzed in relation to FOXP3+cell-densities (CD8+/FOXP3+-ratios).
CD8+/FOXP3+-ratios correlate with survival independent of primary metastasis and response to chemotherapy
Determination of intratumoral CD8+/FOXP3+-ratios revealed extensive variation of CD8+TILs in relation to FOXP3+cells in the discovery cohort (Fig. 2A). Decreasing CD8+/FOXP3+-ratios in the pretreatment biopsy was a highly significant prognostic factor for poor patient survival in univariate Cox-regression (p = 0.0001). Multivariate Cox-regression confirmed that this observation was independent of major clinicopathological prognostic factors at diagnosis including primary metastasis, age, gender, and tumor site (p = 0.002) (Table 2). To test if intratumoral CD8+/FOXP3+-ratios separate survivors from non-survivors in the discovery cohort, we determined estimated survival of patients with CD8+/FOXP3+-ratios above the median vs. patients with CD8+/FOXP3+-ratios below the median (Fig. 2B). Almost all non-survivors during the observation period (median follow-up 69 mo) had CD8+/FOXP3+-ratios below the median (95%). Vice versa, 98% of patients with CD8+/FOXP3+-ratios above the median survived the observation period. Estimated survival of patients with CD8+/FOXP3+-ratios above the median was significantly increased compared to patients with CD8+/FOXP3+-ratios below the median (p = 0.00001; log-rank) (Fig. 2B). We retrieved similar results (p = 0.00001; log-rank) when we excluded all patients with CD31 expression below the first quartile. Since we observed some correlation of CD8+/FOXP3+-ratios at diagnosis with primary metastasis (p = 0.01), although this could not explain the independent predictive power of CD8+/FOXP3+-ratios as determined by multivariate Cox-regression (p = 0.002), we compared estimated survival only in patients without primary metastasis. Again, patients in this subgroup with CD8+/FOXP3+-ratios below the median had a significant shorter estimated survival than patients with CD8+/FOXP3+-ratios above the median (p = 0.00007; log-rank).
Figure 2.
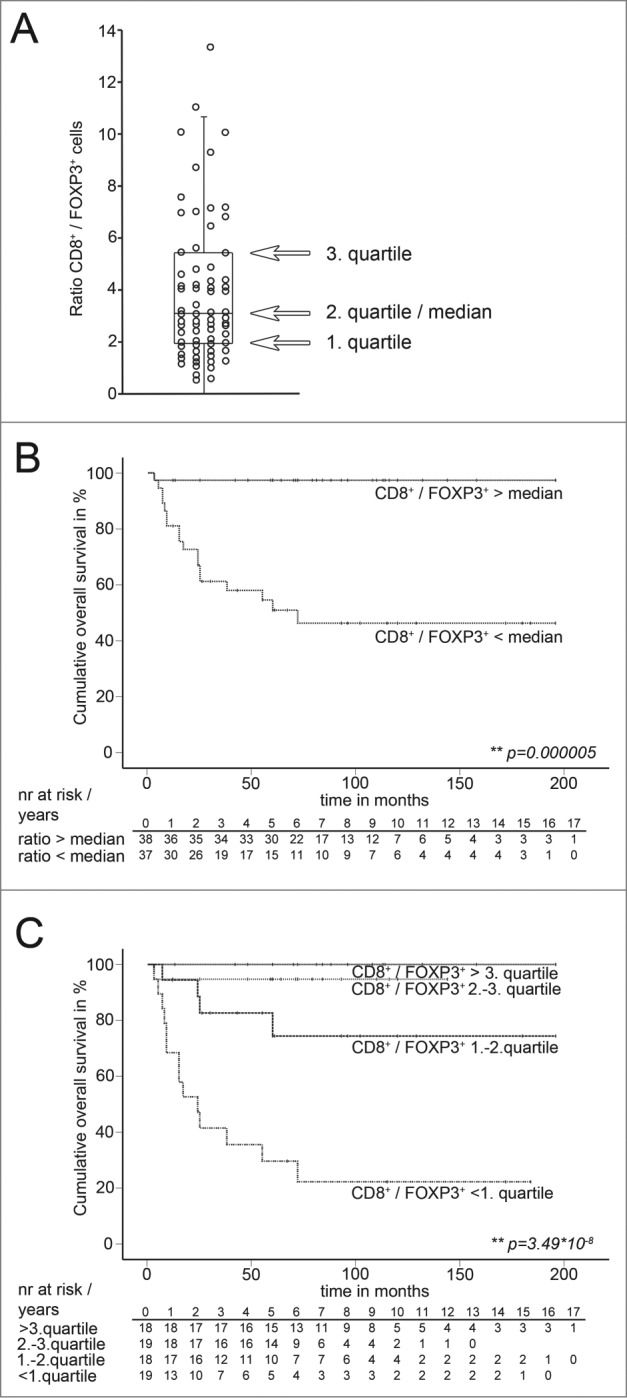
Distribution of the CD8+ / FOXP3+-ratios and estimated overall survival of the discovery cohort grouped for median and quartiles of CD8+ / FOXP3+-ratios. (A) Distribution of CD8+/FOXP3+-ratios of the discovery cohort in whole slides of pretreatment osteosarcoma biopsies. Each dot represents one osteosarcoma sample. Overlaid black box indicates first and third quartile and interquartile range. Median is indicated by black line within the box. Whisker hairs represent the 1.5-fold interquartile distance above the upper quartile and below the lower quartile. Four samples with ratios above a value of 14 are not indicated (ratios: 18.4; 19.2; 29.4; 68.9). (B) Kaplan–Meier estimated overall survival of patients of the discovery cohort with CD8+/FOXP3+-ratios above the median and below the median. Narrow dotted line: patients with CD8+/FOXP3+-ratios above the median (n = 37). Wide dotted line: Patients with CD8+/FOXP3+-ratios below the median (n = 38). Overall survival indicated in months. Cumulative survival indicated in percent. Patients at risk are indicated per year in the corresponding tables below Kaplan–Meier Plots. Statistical significances as p-values by log- rank test. (C) Kaplan–Meier estimated overall survival of patients of the discovery cohort with CD8+/FOXP3+-ratios above the third quartile, between second and third quartile, between first and second quartile and below the first quartile in pretreatment biopsies. Narrow dotted line: patients with CD8+/FOXP3+-ratios above the third quartile (n = 18). Wide dotted line: Patients with CD8+/FOXP3+-ratios between second and third quartile (n = 19). Dashed line: Patients with CD8+/FOXP3+-ratios between the between first and second quartile (n = 18). Dotted and dashed line: Patients with CD8+/FOXP3+-ratios below the first quartile (n = 19). Overall survival indicated in months. Cumulative survival indicated in percent. Patients at risk are indicated per year in the corresponding tables below Kaplan–Meier Plots. Statistical significances as p-values by log-rank test.
Table 2.
Multivariate Cox-regression analysis of CD8+/FOXP3+-ratio within whole slides and variables known at time of diagnosis and response to neoadjuvant chemotherapy for overall survival of osteosarcoma patients.
| Multivariate values | ||||
|---|---|---|---|---|
| Model | Variable | Hazard ratio | 95%CI | p |
| 1 | CD8+/ FOXP3+ -ratio | 0.461a | 0.334–0.846 | 0.002** |
| Age | 1.020 | 0.971–1.072 | 0.420 | |
| Gender | 1.047 | 0.277–3.962 | 0.946 | |
| female vs. male | ||||
| Tumor site | 0.623 | 0.480–0.623 | 0.480 | |
| Trunk vs. extremity | ||||
| Metastasis at diag. | 0.168 | 0.038–0.736 | 0.018* | |
| detected vs. abscent | ||||
| 2 | CD8 / FOXP3 ratio | 0.413 | 0.229–0.745 | 0.003** |
| Resp. to chemotherapy | 0.136 | 0.028–0.660 | 0.013* | |
| non resp. vs. resp. | ||||
acontinuous variable; Hazard ratio for CD8+/ FOXP3+- ratio below vs. above the median: 25.4
Next, CD8+/FOXP3+-ratios were tested against response to neoadjuvant chemotherapy. Again, CD8+/FOXP3+-ratio was an independent prognostic factor (p = 0.003, Cox-regression) (Table 2). Similar observations as reported for metastasis could be made for the subgroup of patients with good response to neoadjuvant chemotherapy: Patients with good chemoresponse but CD8+/FOXP3+-ratios below the median value of the discovery cohort showed significantly reduced estimated survival than patients with CD8+/FOXP3+-ratios above the median (p = 0.045; log-rank) (data not shown). Among patients with poor chemoresponse estimated survival behaved accordingly (p = 0.016; log-rank) (data not shown).
Low CD8+/FOXP3+-ratios identify osteosarcoma patients with poor prognosis
Clinical translation of novel outcome prognostic factors largely depends on their discriminatory power. Therefore, we asked if estimated survival of patients with low (below first quartile) intratumoral CD8+/FOXP3+ratio could clearly be separated from estimated survival of patients with high (above third quartile) CD8+/FOXP3+ratio in the discovery cohort. Kaplan–Meier estimated survival varied highly significant (p = 0.000000035; log-rank) when patients were grouped by quartiles of CD8+/FOXP3+-ratios (Fig. 2C). Accordingly, no patients with a CD8+/FOXP3+ratio above the third quartile, but 79 % of the patients with CD8+/FOXP3+-ratios below the first quartile died within the observation period. Of note, discriminatory power to intermediate groups was also substantial, since patients with low CD8+/FOXP3+-ratios had a significant worse estimated survival when compared to patients with intermediate low or intermediate high CD8+/FOXP3+-ratios (p = 0.002 / p = 0.00003; log rank).
Validation of intratumoral CD8+/FOXP3+-ratios of pretreatment biopsies as prognostic factor
Intratumoral CD8+/FOXP3+ratio as an independent prognostic factor was validated in an independent validation cohort that was defined previous to sample retrieval and included patients with current state of the art diagnosis and therapy (see CONSORT Fig. S1). Patients of the validation cohort with CD8+/FOXP3+-ratios above 3.075 (= median of the discovery cohort) showed a significant longer estimated survival than patients with CD8+/FOXP3+-ratios below 3.075 (p = 0.001; log-rank) (Fig. 3A) consistent with findings in the discovery group (Fig. 2B). Similar results were retrieved when other statistical validation strategies were applied post-hoc (i.e., cross validation with discovery group as validation cohort, split-sampling validation). The CD8+/FOXP3+-ratio median value of discovery and validation together was 3.074. Multivariate Cox-regression analysis confirmed that this observation in the validation group was independent of major clinicopathological prognostic factors at diagnosis including primary metastasis, age, gender, and tumor site (p = 0.04). Furthermore, estimated survival of patients in the validation cohort without primary metastasis was longer in patients with CD8+/FOXP3+-ratios above 3.075 (p = 0.014; log-rank) (Fig. 3B) consistent with discovery group data. Similarly, patients of the validation cohort with good response to neoadjuvant chemotherapy could be separated by CD8+/FOXP3+-ratios in two groups with different estimated survival. Whereas patients with CD8+/FOXP3+-ratios above 3.075 showed indeed good estimated survival, patients with CD8+/FOXP3+-ratios below 3.075 had exhibited less favorable estimated survival although the response to chemotherapy was good (p = 0.008; log-rank) (Fig. 3C) as indicated above for the discovery group.
Figure 3.
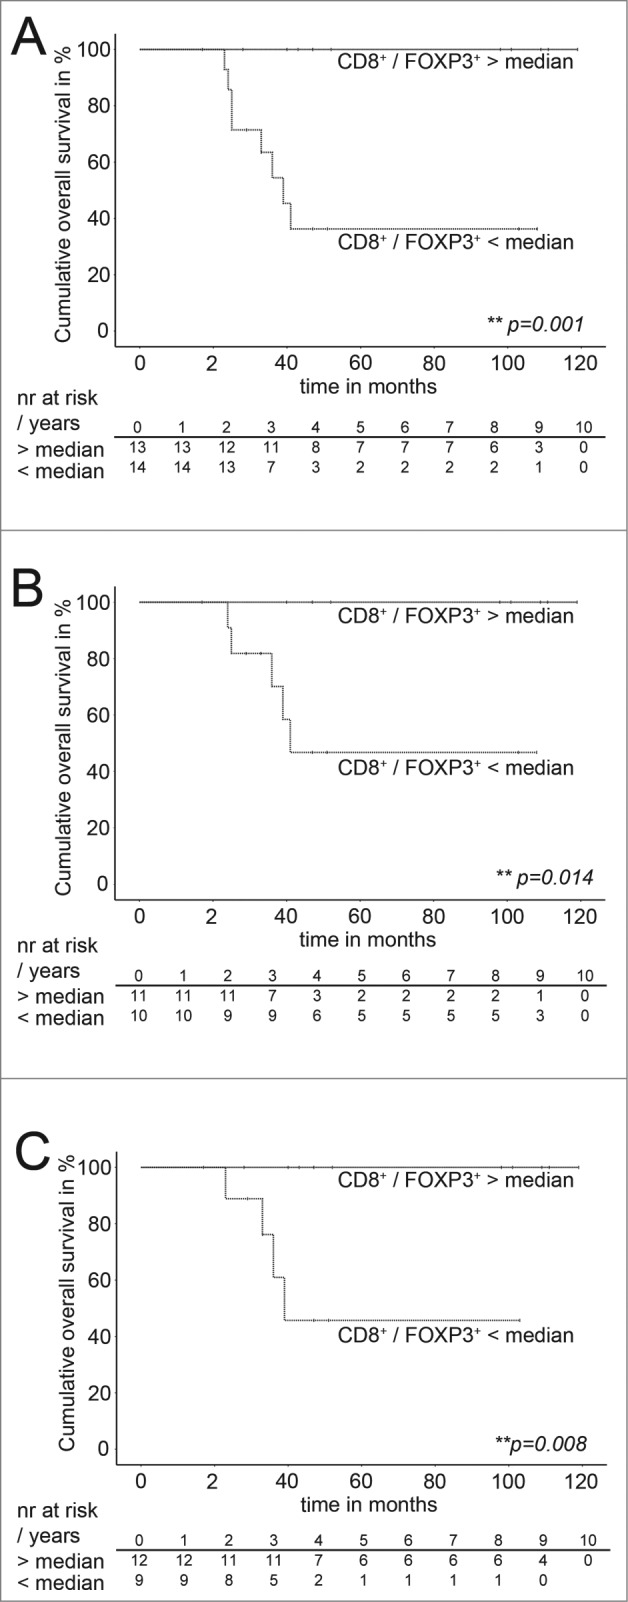
Estimated overall survival of the validation cohort grouped for the median of the CD8+/ FOXP3+-ratios. (A–C) Kaplan–Meier estimated overall survival of patients of the validation cohort with CD8+/FOXP3+-ratios above the median and below the median. (A) All patients, narrow dotted lines: patients with a CD8+/FOXP3+-ratios above the median (n = 13), wide dotted line: patients with a CD8+/FOXP3+-ratios below the median (n = 14). Overall survival indicated in months. Cumulative survival indicated in percent. Patients at risk are indicated per year in the corresponding tables below Meier Plots. Statistical significances as p-values by log- rank test. (B) Patients without primary metastasis, narrow dotted lines: patients with a CD8+/ FOXP3+-ratios above the median (n = 11), wide dotted line: patients with a CD8+/FOXP3+-ratios below the median (n = 10). Overall survival indicated in months. Cumulative survival indicated in percent. Patients at risk are indicated per year in the corresponding tables below Kaplan–Meier Plots. Statistical significances as p-values by log-rank test. (C) Patients with good response to neoadjuvant chemotherapy. Narrow dotted lines: patients with a CD8+/ FOXP3+-ratios above the median (n = 12) (C). Wide dotted line: Patients with a CD8+ / FOXP3+- ratio below the median n = 9 (C). Overall survival indicated in months. Cumulative survival indicated in percent. Patients at risk are indicated per year in the corresponding tables below Meier Plots. Statistical significances as p-values by log-rank test.
Discussion
Progress in cancer treatment proceeds not in equal measures for all tumor entities. Therapy of major hematologic and solid malignancies has already entered precision or stratified medicine. Homogeneous patient groups can be defined by specific biomarkers that are likely to benefit from a specific therapy. In contrast, all osteosarcoma patients get uniform neoadjuvant chemotherapy with no significant improvement in survival over 20–30 y. Given the high inter- and intra-tumoral heterogeneity in osteosarcoma, individualized cancer therapy has been claimed to be essential for further progress in osteosarcoma.21 Along these lines, most effective targeted drugs require response prediction biomarkers, but in osteosarcoma no reliable molecular prognostic markers are available so far.22 With less than five new patients in a million suffering from osteosarcoma, research is largely academic driven and not by pharmaceutical companies23 with many osteosarcoma studies being statistically under powered. Furthermore, most outcome-related biomarker studies have included not only too little patient numbers to detect homogeneous subgroups (n < 100 ), but are also hampered by major difficulties in reliable work-up of bone material. Third, independent patient groups for validation of candidate outcome prediction biomarkers are mostly missing.
In the present study, we addressed these issues and included pretreatment biopsies from a multicenter cohort of 150 osteosarcoma patients with validation of our finding in an independent patient group. To overcome tumor heterogeneity we explored the tumor microenvironment instead of tumor cells and introduced whole-slide immunohistochemical analysis instead of analysis of small spots.14 Furthermore, we have previously optimized antigen detection to allow reliable detection of tumor infiltrating immune cells in bone tissue.14 Although, we had expertise to detect FOXP3+cells in diseases including other malignancies24–27, sufficient conditions for successful immunohistochemical FOXP3+cell detection in osteosarcoma turned out to be largely different from conventional protocols14 and might explain the lack of reports demonstrating FOXP3+cells in human osteosarcoma.
Here, we show that osteosarcoma patients with higher (above median) intratumoral CD8+/FOXP3+-ratios at time of diagnosis have a much better outcome than patients with lower (below median) CD8+/FOXP3+-ratios (Fig. 2B and Table 2). Previous reports on CD8+TILs in osteosarcoma are limited to case reports28 and to semi-quantitative studies of small patient series.11–13 The largest study included pretreatment biopsies from 35 osteosarcoma patients and performed semi-quantitative analysis of CD8+TILs 16 y ago.12 At that time, human Tregs were unknown and not included in the study, which did not detect any correlation of TILs with osteosarcoma outcome. However, a few years later, data by Théoleyre and colleagues supported the notion of Treg presence in osteosarcoma: TILs isolated from osteosarcoma exhibited lytic activity in vitro but obviously not in vivo.29 Nowadays, having the knowledge that intratumoral Treg can suppress antitumoral CD8+TILs, quantitative assessment of CD8+TILs should include assessment of Tregs. Accordingly, recent studies from other malignancies focus on CD8+/FOXP3+-ratios30–33 as one step forward from using CD8+TIL numbers34 or intratumoral Treg numbers alone as predictive markers.
Caution is advised, when considering all lymphocytes with FOXP3 expression as Treg. Recent studies have demonstrated that also conventional T cells (Tconv) can upregulate FOXP3 in vitro.35–42 If this observation holds true for human TILs in vivo as shown for mice in vivo43 awaits further confirmation. Treg can be either thymus-derived or are induced in the periphery from a pool of potential Tregs.44,45 As a characteristic feature both Treg populations exhibit a specific demethylation pattern within the FOXP3 gene locus in contrast to activated Tconv.42,43 Therefore, we performed side-by-side analysis of demethylated FOXP3 DNA content from the whole FFPE section in parallel with whole-slide FOXP3 immunohistochemistry. Although, we could demonstrate a significant correlation (p = 0,018), we cannot rule out that some conventional TILs upregulated FOXP3.
Given the well-established paradigm of Treg-accumulation in other tumor9,10 and the strong outcome-related data presented here, we consider most FOXP3+cells to exert Treg function in the osteosarcoma microenvironment. In general, assigning osteosarcoma to a T-cell-inflamed phenotype is encouraging since novel immunotherapeutic interventions have entered cancer therapy for this phenotype.8 Tumor escape by accumulating intratumoral Treg, expression of Programmed-death-Ligand-1 (PD-L-1) or Indoleamine 2,3-dioxygenase (IDO) are not only emerging mechanisms which explain suppression of antitumor immunity in the tumor microenvironment, but they can already be interfered by novel drugs.8 Interestingly, Treg, PD-L-1, and IDO upregulation might be all driven by infiltrating CD8+T-cells46, which is consistent with the observed correlation of CD8+TILs and FOXP3+cells in our study (Fig. 1C). Though present on osteosarcoma tumor cells, semi-quantitative analysis of PD-L-147 or IDO48 were of no or only limited suitability to predict osteosarcoma outcome. In contrast, determination of CD8+/FOXP3+-ratios showed strong correlation with survival. Collectively, cytokine-driven activation of CD8+TILs together with antibody-based Treg depletion could represent a potential novel strategy in osteosarcoma since appropriate drugs have already entered clinical trials in other malignancies.8 Activation of antitumor T-cell responses might also shed new light on the observed beneficial effect of infection in osteosarcoma progression beyond TNFα-mediated mechanisms.21 Even conventional MAP neoadjuvant osteosarcoma chemotherapy might act partially by activating antitumor TILs and decreasing Treg numbers in some patients, i.e. via doxorubicin.49
In summary, we report for the first time CD8+/FOXP3+-ratio as strong prognostic factor at time of osteosarcoma diagnosis. Multivariate analysis showed that this novel parameter was independent from tumor metastasis and response to neoadjuvant chemotherapy and could be validated in an independent patient cohort with current state of the art diagnosis and treatment of osteosarcoma. Furthermore, whole-slide CD8+/FOXP3+-ratios can be determined by standardized immunohistochemistry protocols in a time-efficient manner.14 In future, patient prognosis in osteosarcoma might be estimated not only by the assessment of tumor criteria (TNM classification) and clinical parameters, but also by the immune component of the tumor microenvironment similar to “immunoscores” in other tumors.50 Improved outcome prediction by CD8+/FOXP3+-ratios at time of diagnosis would not only allow improved treatment stratification of high-risk patients in osteosarcoma: Previously, administration of novel drugs like IFN-α without any biomarker for potential responders was challenged by the vast heterogeneity in osteosarcoma.21,51 CD8+/FOXP3+-ratios might be helpful to define patients groups that are likely to benefit from specific immunomodulatory therapy.
Patients and Methods
Patients
Patients with pretreatment open biopsies from primary high-grade central osteosarcoma registered in the bone tumor banks of the University Hospitals of Heidelberg, Budapest and Valencia with available formalin-fixed paraffin embedded (FFPE)-material and registered in corresponding tumor patient registers were eligible and randomly selected. Optimal sampling location was identified by respecting the future (mostly limb-salvage) tumor resection approach and by using MRI/ CT scans (PET if available). Patient`s exclusion criteria are shown in a consolidated standard of reporting trials (CONSORT) flow diagram (Fig. S1).52,53 Patients assigned to complete treatment protocols with neoadjuvant chemotherapy, resection, and adjuvant chemotherapy based on high-dose methotrexate (according to major treatment protocols of the Cooperative German–Austrian–Swiss Osteosarcoma Study Group (COSS) (more than 95%), the European Organization for Research and Treatment of Cancer (EORTC) or a Rosen protocol) were differed from patients with incomplete treatment protocols. All included patients were stage Enneking II or III. This study was approved by the Ethical committee of the University of Heidelberg (No.312/2006) according to the Declaration of Helsinki.
Immunohistochemical staining and quantification of CD8+TILs and FOXP3+TILs
We have recently described an optimized immunohistochemical detection of immunovascular antigens in FFPE osteosarcoma samples, including CD8+ and FOXP3+ and identified whole-slide analysis of CD8+TILs and FOXP3+cells as most reliable method to quantify TILs in osteosarcoma biopsies.14 CD8+- and FOXP3+-cells were detected using FOXP3 mAb (clone236A/E7, eBioscience) and CD8 mAb (clone C8/144B, Dako) within serial whole sections. For optimization we have evaluated over 200 staining modalities and optimized CD8+ and FOXP3+ antigen detection was performed as follows: After deparaffinization and rehydration antigen retrieval was performed in a CertoClav EL pressure cooker (Certoclav) at 127° for 15 min in EDTA buffer with pH 7.0 for FOXP3 or pH 8.0 for CD8+. After three times washing in PBS and blocking with 10% human serum in PBS, osteosarcoma cross sections were covered by cover plates and transferred to slide racks (Thermo Shandon Limited). FOXP3 mAb (clone236A/E7, eBioscience) and CD8 mAb (clone C8/144B, Dako) were diluted 1:50 in 10% human serum and incubated at 4° overnight. Alkaline phosphatase labeling was performed by polymer linked secondary antibody (UltraVision LP, Thermo Fisher Scientific) and liquid fast red (Thermo Fisher Scientific) was used as chromogen. After staining, sections were washed in PBS, and counterstained with hematoxylin. Immunostained sections were digitalized using an Aperio Scanscope CS slide scanner.
Tumor areas on digitalized immunostained sections were annotated by an experienced bone pathologist, avascular, and non-infiltrated chondroblastic areas were excluded. Due to inconsistent results by computer assisted positive cell counts caused by known heterogeneous staining properties14, CD8+TILs and FOXP3+cells were manually counted throughout digitalized serial whole sections for highest accuracy and reproducibility. Investigators were blinded for the presented clinical outcome.
Study design
Study design for this multicenter retrospective study includes discovery and validation cohorts and was defined previous to recruitment of samples. It is shown in a CONSORT flow diagram52,53 (Fig. S1) and follows reporting recommendations for tumor marker prognostic studies (REMARK)54 (Fig. S2). Sample size estimation was based on expected event (death) rates from published15,17,18 and own data20 and following the modified “rule of ten”55,56 for multivariate analysis. Following random patient selection, 160 patients were assessed eligible for this study. Abiding to an “honest broker” concept57, samples for the validation cohort were not accessed before completion of discovery cohort analysis.
Out of the included 150 patients, 48 had to be excluded for comparison of clinical outcome parameters. Out of these patients, 30 patients were assigned to incomplete treatment cycles, immunohistochemistry was insufficient in samples of 4 patients, clinical follow-up data was missing in 9 cases and 6 cases were primarily chondroblastic tumors without relevant vascularization and TIL infiltration. Criteria are also listed in detail in the CONSORT diagram (Fig. S1). 102 patients with assignment to complete treatment protocols were identified. To allow long term follow up with overall survival as major clinical end point instead of desease free survival (REMARK), patients with time of diagnosis from 1982 until 2003 were assigned to the discovery group. To validate the observed effects in a cohort with state of the art diagnosis and treatment patients with diagnosis between 2004 and 2012 were assigned to the validation cohort. Discovery and validation cohort sample sizes were determined by frequencies of patients with diagnosis before or after 2004 in the random patient selection process.
Statistical analysis
Statistical analyses were conducted in collaboration with the Department of Medical Biometry and Informatics, University of Heidelberg, using the SPSS software (IBM, Armonk, USA). Univariate and multivariate Cox-regression analysis were applied to determine the prognostic values on survival of osteosarcoma patients. Kaplan–Meier estimated survival curves and log-rank testing were used to determine differences in survival within grouped osteosarcoma patients. Correlation of response to chemotherapy and CD8+/FOXP3+-ratios was analyzed by Mann–Whitney-U-test. Reported p-values are two-sided.
Supplementary Material
Acknowledgment
Thanks to Heiner Sähr, Katrin Goetzke, and Birgitta Maurer for their excellent technical assistance.
Disclosure of Potential Conflicts of Interest
No potential conflicts of interest were disclosed.
Supplemental Material
Supplemental data for this article can be accessed on the publisher's website.
References
- 1. Khanna C, Fan TM, Gorlick R, Helman LJ, Kleinerman ES, Adamson PC, Houghton PJ, Tap WD, Welch DR, Steeg PS, et al. Toward a drug development path that targets metastatic progression in osteosarcoma. Clin Cancer Res 2014; 20:4200-9; PMID:; http://dx.doi.org/ 10.1158/1078-0432.CCR-13-2574 [DOI] [PMC free article] [PubMed] [Google Scholar]
- 2. Iwata S, Ishii T, Kawai A, Hiruma T, Yonemoto T, Kamoda H, Asano N, Takeyama M. Prognostic factors in elderly osteosarcoma patients: a multi-institutional retrospective study of 86 cases. Ann Surg Oncol 2014; 21:263-8; PMID:; http://dx.doi.org/ 10.1245/s10434-013-3210-4 [DOI] [PubMed] [Google Scholar]
- 3. Bakhshi S, Radhakrishnan V. Prognostic markers in osteosarcoma. Expert Rev Anticancer Ther 2010; 10:271-87; PMID:; http://dx.doi.org/ 10.1586/era.09.186 [DOI] [PubMed] [Google Scholar]
- 4. Poos K, Smida J, Nathrath M, Maugg D, Baumhoer D, Neumann A, Korsching E. Structuring osteosarcoma knowledge: an osteosarcoma-gene association database based on literature mining and manual annotation. Database 2014; PMID:; http://dx.doi.org/10.1093/database/bau042 [DOI] [PMC free article] [PubMed] [Google Scholar]
- 5. Smida J, Baumhoer D, Rosemann M, Walch A, Bielack S, Poremba C, Remberger K, Korsching E, Scheurlen W, Dierkes C, et al. Genomic alterations and allelic imbalances are strong prognostic predictors in osteosarcoma. Clin Cancer Res 2010; 16:4256-67; PMID:; http://dx.doi.org/ 10.1158/1078-0432.CCR-10-0284 [DOI] [PubMed] [Google Scholar]
- 6. Galon J, Pages F, Marincola FM, Angell HK, Thurin M, Lugli A, Zlobec I, Berger A, Bifulco C, Botti G, et al. Cancer classification using the Immunoscore: a worldwide task force. J Transl Med 2012; 10:205; PMID:; http://dx.doi.org/ 10.1186/1479-5876-10-205 [DOI] [PMC free article] [PubMed] [Google Scholar]
- 7. Mlecnik B, Tosolini M, Kirilovsky A, Berger A, Bindea G, Meatchi T, Bruneval P, Trajanoski Z, Fridman WH, Pages F, et al. Histopathologic-based prognostic factors of colorectal cancers are associated with the state of the local immune reaction. J Clin Oncol 2011; 29:610-8; PMID:; http://dx.doi.org/ 10.1200/JCO.2010.30.5425 [DOI] [PubMed] [Google Scholar]
- 8. Gajewski TF, Schreiber H, Fu YX. Innate and adaptive immune cells in the tumor microenvironment. Nat Immunol 2013; 14:1014-22; PMID:; http://dx.doi.org/ 10.1038/ni.2703 [DOI] [PMC free article] [PubMed] [Google Scholar]
- 9. Oleinika K, Nibbs RJ, Graham GJ, Fraser AR. Suppression, subversion and escape: the role of regulatory T cells in cancer progression. Clin Exp Immunol 2013; 171:36-45; PMID:; http://dx.doi.org/ 10.1111/j.1365-2249.2012.04657.x [DOI] [PMC free article] [PubMed] [Google Scholar]
- 10. Wang HY, Wang RF. Regulatory T cells and cancer. Curr Opin Immunol 2007; 19:217-23; PMID:; http://dx.doi.org/ 10.1016/j.coi.2007.02.004 [DOI] [PubMed] [Google Scholar]
- 11. Rivoltini L, Arienti F, Orazi A, Cefalo G, Gasparini M, Gambacorti-Passerini C, Fossati-Bellani F, Parmiani G. Phenotypic and functional analysis of lymphocytes infiltrating paediatric tumours, with a characterization of the tumour phenotype. Cancer Immunol Immunother 1992; 34:241-51; PMID:; http://dx.doi.org/ 10.1007/BF01741792 [DOI] [PMC free article] [PubMed] [Google Scholar]
- 12. Trieb K, Lechleitner T, Lang S, Windhager R, Kotz R, Dirnhofer S. Evaluation of HLA-DR expression and T-lymphocyte infiltration in osteosarcoma. Pathol Res Pract 1998; 194:679-84; PMID:; http://dx.doi.org/ 10.1016/S0344-0338(98)80126-X [DOI] [PubMed] [Google Scholar]
- 13. Wang L, Zhang Q, Chen W, Shan B, Ding Y, Zhang G, Cao N, Liu L, Zhang Y. B7-H3 is overexpressed in patients suffering osteosarcoma and associated with tumor aggressiveness and metastasis. PloS One 2013; 8:e70689; PMID:; http://dx.doi.org/ 10.1371/journal.pone.0070689 [DOI] [PMC free article] [PubMed] [Google Scholar]
- 14. Kunz P, Fellenberg J, Moskovszky L, Sapi Z, Krenacs T, Poeschl J, Lehner B, Szendroi M, Ewerbeck V, Kinscherf R, et al. Osteosarcoma microenvironment: whole-slide imaging and optimized antigen detection overcome major limitations in immunohistochemical quantification. PloS One 2014; 9:e90727; PMID:; http://dx.doi.org/ 10.1371/journal.pone.0090727 [DOI] [PMC free article] [PubMed] [Google Scholar]
- 15. Bielack SS, Kempf-Bielack B, Delling G, Exner GU, Flege S, Helmke K, Kotz R, Salzer-Kuntschik M, Werner M, Winkelmann W, et al. Prognostic factors in high-grade osteosarcoma of the extremities or trunk: an analysis of 1,702 patients treated on neoadjuvant cooperative osteosarcoma study group protocols. J Clin Oncol 2002; 20:776-90; PMID:; http://dx.doi.org/ 10.1200/JCO.20.3.776 [DOI] [PubMed] [Google Scholar]
- 16. Collins M, Wilhelm M, Conyers R, Herschtal A, Whelan J, Bielack S, Kager L, Kuhne T, Sydes M, Gelderblom H, et al. Benefits and adverse events in younger versus older patients receiving neoadjuvant chemotherapy for osteosarcoma: findings from a meta-analysis. J Clin Oncol 2013; 31:2303-12; PMID:; http://dx.doi.org/ 10.1200/JCO.2012.43.8598 [DOI] [PubMed] [Google Scholar]
- 17. Nathan SS, Healey JH. Demographic determinants of survival in osteosarcoma. Ann Acad Med Singapore 2012; 41:390-9; PMID: [PubMed] [Google Scholar]
- 18. Bacci G, Longhi A, Versari M, Mercuri M, Briccoli A, Picci P. Prognostic factors for osteosarcoma of the extremity treated with neoadjuvant chemotherapy: 15-year experience in 789 patients treated at a single institution. Cancer 2006; 106:1154-61; PMID:; http://dx.doi.org/ 10.1002/cncr.21724 [DOI] [PubMed] [Google Scholar]
- 19. Mankin HJ, Hornicek FJ, Rosenberg AE, Harmon DC, Gebhardt MC. Survival data for 648 patients with osteosarcoma treated at one institution. Clin Orthop Relat Res 2004:286-91; PMID:; http://dx.doi.org/ 10.1097/01.blo.0000145991.65770.e6 [DOI] [PubMed] [Google Scholar]
- 20. Kunz P, Fellenberg J, Moskovszky L, Sapi Z, Krenacs T, Machado I, Poeschl J, Lehner B, Szendroi M, Ruef P, et al. Improved survival in osteosarcoma patients with atypical low vascularization. Ann Surg Oncol 2014; 22(2):489-96; http://dx.doi.org/.1245/s10434-014-4001-2 [DOI] [PubMed] [Google Scholar]
- 21. Botter SM, Neri D, Fuchs B. Recent advances in osteosarcoma. Curr Opin Pharmacol 2014; 16:15-23; PMID:; http://dx.doi.org/ 10.1016/j.coph.2014.02.002 [DOI] [PubMed] [Google Scholar]
- 22. Luetke A, Meyers PA, Lewis I, Juergens H. Osteosarcoma treatment – where do we stand? A state of the art review. Cancer Treat Rev 2014; 40:523-32; PMID:; http://dx.doi.org/ 10.1016/j.ctrv.2013.11.006 [DOI] [PubMed] [Google Scholar]
- 23. Allison DC, Carney SC, Ahlmann ER, Hendifar A, Chawla S, Fedenko A, Angeles C, Menendez LR. A meta-analysis of osteosarcoma outcomes in the modern medical era. Sarcoma 2012; 2012:704872; PMID:; http://dx.doi.org/ 10.1155/2012/704872 [DOI] [PMC free article] [PubMed] [Google Scholar]
- 24. Franz B, Fritzsching B, Riehl A, Oberle N, Klemke CD, Sykora J, Quick S, Stumpf C, Hartmann M, Enk A, et al. Low number of regulatory T cells in skin lesions of patients with cutaneous lupus erythematosus. Arthritis Rheum 2007; 56:1910-20; PMID:; http://dx.doi.org/ 10.1002/art.22699 [DOI] [PubMed] [Google Scholar]
- 25. Fritzsching B, Haas J, Konig F, Kunz P, Fritzsching E, Poschl J, Krammer PH, Bruck W, Suri-Payer E, Wildemann B. Intracerebral human regulatory T cells: analysis of CD4+ CD25+ FOXP3+ T cells in brain lesions and cerebrospinal fluid of multiple sclerosis patients. PloS One 2011; 6:e17988; PMID: [DOI] [PMC free article] [PubMed] [Google Scholar]
- 26. Fritzsching B, Oberle N, Pauly E, Geffers R, Buer J, Poschl J, Krammer P, Linderkamp O, Suri-Payer E. Naive regulatory T cells: a novel subpopulation defined by resistance toward CD95L-mediated cell death. Blood 2006; 108:3371-8; PMID:; http://dx.doi.org/ 10.1182/blood-2006-02-005660 [DOI] [PubMed] [Google Scholar]
- 27. Klemke CD, Fritzsching B, Franz B, Kleinmann EV, Oberle N, Poenitz N, Sykora J, Banham AH, Roncador G, Kuhn A, et al. Paucity of FOXP3+ cells in skin and peripheral blood distinguishes Sezary syndrome from other cutaneous T-cell lymphomas. Leukemia 2006; 20:1123-9; PMID:; http://dx.doi.org/ 10.1038/sj.leu.2404182 [DOI] [PubMed] [Google Scholar]
- 28. Matsuo T, Shimose S, Kubo T, Mikami Y, Arihiro K, Yasunaga Y, Ochi M. Extraskeletal osteosarcoma with partial spontaneous regression. Anticancer Res 2009; 29:5197-201; PMID: [PubMed] [Google Scholar]
- 29. Theoleyre S, Mori K, Cherrier B, Passuti N, Gouin F, Redini F, Heymann D. Phenotypic and functional analysis of lymphocytes infiltrating osteolytic tumors: use as a possible therapeutic approach of osteosarcoma. BMC Cancer 2005; 5:123; PMID:; http://dx.doi.org/ 10.1186/1471-2407-5-123 [DOI] [PMC free article] [PubMed] [Google Scholar]
- 30. Preston CC, Maurer MJ, Oberg AL, Visscher DW, Kalli KR, Hartmann LC, Goode EL, Knutson KL. The ratios of CD8+ T cells to CD4+CD25+ FOXP3+ and FOXP3- T cells correlate with poor clinical outcome in human serous ovarian cancer. PloS One 2013; 8:e80063; PMID:; http://dx.doi.org/ 10.1371/journal.pone.0080063 [DOI] [PMC free article] [PubMed] [Google Scholar]
- 31. Nasman A, Romanitan M, Nordfors C, Grun N, Johansson H, Hammarstedt L, Marklund L, Munck-Wikland E, Dalianis T, Ramqvist T. Tumor infiltrating CD8+ and Foxp3+ lymphocytes correlate to clinical outcome and human papillomavirus (HPV) status in tonsillar cancer. PloS One 2012; 7:e38711; PMID:; http://dx.doi.org/ 10.1371/journal.pone.0038711 [DOI] [PMC free article] [PubMed] [Google Scholar]
- 32. Sato E, Olson SH, Ahn J, Bundy B, Nishikawa H, Qian F, Jungbluth AA, Frosina D, Gnjatic S, Ambrosone C, et al. Intraepithelial CD8+ tumor-infiltrating lymphocytes and a high CD8+/regulatory T cell ratio are associated with favorable prognosis in ovarian cancer. Proc Natl Acad Sci U S A 2005; 102:18538-43; PMID:; http://dx.doi.org/ 10.1073/pnas.0509182102 [DOI] [PMC free article] [PubMed] [Google Scholar]
- 33. Zeestraten EC, Van Hoesel AQ, Speetjens FM, Menon AG, Putter H, van de Velde CJ, Kuppen PJ. FoxP3- and CD8-positive infiltrating immune cells together determine clinical outcome in colorectal cancer. Cancer Microenviron 2013; 6:31-9; PMID:; http://dx.doi.org/ 10.1007/s12307-011-0071-x [DOI] [PMC free article] [PubMed] [Google Scholar]
- 34. Galon J, Costes A, Sanchez-Cabo F, Kirilovsky A, Mlecnik B, Lagorce-Pages C, Tosolini M, Camus M, Berger A, Wind P, et al. Type, density, and location of immune cells within human colorectal tumors predict clinical outcome. Science 2006; 313:1960-4; PMID:; http://dx.doi.org/ 10.1126/science.1129139 [DOI] [PubMed] [Google Scholar]
- 35. Gavin MA, Torgerson TR, Houston E, DeRoos P, Ho WY, Stray-Pedersen A, Ocheltree EL, Greenberg PD, Ochs HD, Rudensky AY. Single-cell analysis of normal and FOXP3-mutant human T cells: FOXP3 expression without regulatory T cell development. Proc Natl Acad Sci U S A 2006; 103:6659-64; PMID:; http://dx.doi.org/ 10.1073/pnas.0509484103 [DOI] [PMC free article] [PubMed] [Google Scholar]
- 36. Miyara M, Yoshioka Y, Kitoh A, Shima T, Wing K, Niwa A, Parizot C, Taflin C, Heike T, Valeyre D, et al. Functional delineation and differentiation dynamics of human CD4+ T cells expressing the FoxP3 transcription factor. Immunity 2009; 30:899-911; PMID:; http://dx.doi.org/ 10.1016/j.immuni.2009.03.019 [DOI] [PubMed] [Google Scholar]
- 37. Morgan ME, van Bilsen JH, Bakker AM, Heemskerk B, Schilham MW, Hartgers FC, Elferink BG, van der Zanden L, de Vries RR, Huizinga TW, et al. Expression of FOXP3 mRNA is not confined to CD4+CD25+ T regulatory cells in humans. Hum Immunol 2005; 66:13-20; PMID:; http://dx.doi.org/ 10.1016/j.humimm.2004.05.016 [DOI] [PubMed] [Google Scholar]
- 38. Roncador G, Brown PJ, Maestre L, Hue S, Martinez-Torrecuadrada JL, Ling KL, Pratap S, Toms C, Fox BC, Cerundolo V, et al. Analysis of FOXP3 protein expression in human CD4+CD25+ regulatory T cells at the single-cell level. Eur J Immunol 2005; 35:1681-91; PMID:; http://dx.doi.org/ 10.1002/eji.200526189 [DOI] [PubMed] [Google Scholar]
- 39. Walker MR, Kasprowicz DJ, Gersuk VH, Benard A, Van Landeghen M, Buckner JH, Ziegler SF. Induction of FoxP3 and acquisition of T regulatory activity by stimulated human CD4+CD25- T cells. J Clin Invest 2003; 112:1437-43; PMID:; http://dx.doi.org/ 10.1172/JCI19441 [DOI] [PMC free article] [PubMed] [Google Scholar]
- 40. Allan SE, Crome SQ, Crellin NK, Passerini L, Steiner TS, Bacchetta R, Roncarolo MG, Levings MK. Activation-induced FOXP3 in human T effector cells does not suppress proliferation or cytokine production. Int Immunol 2007; 19:345-54; PMID:; http://dx.doi.org/ 10.1093/intimm/dxm014 [DOI] [PubMed] [Google Scholar]
- 41. Pillai V, Ortega SB, Wang CK, Karandikar NJ. Transient regulatory T-cells: a state attained by all activated human T-cells. Clin Immunol 2007; 123:18-29; PMID:; http://dx.doi.org/ 10.1016/j.clim.2006.10.014 [DOI] [PMC free article] [PubMed] [Google Scholar]
- 42. Wang J, Ioan-Facsinay A, van der Voort EI, Huizinga TW, Toes RE. Transient expression of FOXP3 in human activated nonregulatory CD4+ T cells. Eur J Immunol 2007; 37:129-38; PMID:; http://dx.doi.org/ 10.1002/eji.200636435 [DOI] [PubMed] [Google Scholar]
- 43. Bailey-Bucktrout SL, Martinez-Llordella M, Zhou X, Anthony B, Rosenthal W, Luche H, Fehling HJ, Bluestone JA. Self-antigen-driven activation induces instability of regulatory T cells during an inflammatory autoimmune response. Immunity 2013; 39:949-62; PMID:; http://dx.doi.org/ 10.1016/j.immuni.2013.10.016 [DOI] [PMC free article] [PubMed] [Google Scholar]
- 44. Povoleri GA, Scotta C, Nova-Lamperti EA, John S, Lombardi G, Afzali B. Thymic versus induced regulatory T cells – who regulates the regulators? Front Immunol 2013; 4:169; PMID:; http://dx.doi.org/ 10.3389/fimmu.2013.00169 [DOI] [PMC free article] [PubMed] [Google Scholar]
- 45. Sakaguchi S, Vignali DA, Rudensky AY, Niec RE, Waldmann H. The plasticity and stability of regulatory T cells. Nat Rev Immunol 2013; 13:461-7; PMID:; http://dx.doi.org/ 10.1038/nri3464 [DOI] [PubMed] [Google Scholar]
- 46. Spranger S, Spaapen RM, Zha Y, Williams J, Meng Y, Ha TT, Gajewski TF. Up-regulation of PD-L1, IDO, and T(regs) in the melanoma tumor microenvironment is driven by CD8(+) T cells. Sci Transl Med 2013; 5:200ra116; PMID:; http://dx.doi.org/ 10.1126/scitranslmed.3006504 [DOI] [PMC free article] [PubMed] [Google Scholar]
- 47. Shen JK, Cote GM, Choy E, Yang P, Harmon D, Schwab J, Nielsen GP, Chebib I, Ferrone S, Wang X, et al. Programmed cell death ligand 1 expression in osteosarcoma. Cancer Immunol Res 2014; 2:690-8; PMID:; http://dx.doi.org/ 10.1158/2326-6066.CIR-13-0224 [DOI] [PMC free article] [PubMed] [Google Scholar]
- 48. Urakawa H, Nishida Y, Nakashima H, Shimoyama Y, Nakamura S, Ishiguro N. Prognostic value of indoleamine 2,3-dioxygenase expression in high grade osteosarcoma. Clin Exp Metastasis 2009; 26:1005-12; PMID:; http://dx.doi.org/ 10.1007/s10585-009-9290-7 [DOI] [PubMed] [Google Scholar]
- 49. Park JY, Jang MJ, Chung YH, Kim KY, Kim SS, Lee WB, You S, Choi YS, Hur DY, Kim D. Doxorubicin enhances CD4(+) T-cell immune responses by inducing expression of CD40 ligand and 4-1BB. Int Immunopharmacol 2009; 9:1530-9; PMID:; http://dx.doi.org/ 10.1016/j.intimp.2009.09.008 [DOI] [PubMed] [Google Scholar]
- 50. Galon J, Mlecnik B, Bindea G, Angell HK, Berger A, Lagorce C, Lugli A, Zlobec I, Hartmann A, Bifulco C, et al. Towards the introduction of the 'Immunoscore' in the classification of malignant tumours. J Pathol 2014; 232:199-209; PMID:; http://dx.doi.org/ 10.1002/path.4287 [DOI] [PMC free article] [PubMed] [Google Scholar]
- 51. Bielack S, Whelan J, Marina N, Hook J, Jovic G, Krailo MD, Butterfass-Bahloul T, Kühne T, Eriksson M, Teot LA, et al. MAP plus maintenance pegylated interferon α-2b (MAPIfn) versus MAP alone in patients with resectable high-grade osteosarcoma and good histologic response to preoperative MAP: First results of the EURAMOS-1 “good response” randomization. J Clin Oncol 2013; 31 (abstract); PMID: [DOI] [PMC free article] [PubMed] [Google Scholar]
- 52. Moher D, Schulz KF, Altman D. The CONSORT statement: revised recommendations for improving the quality of reports of parallel-group randomized trials. JAMA 2001; 285:1987-91; PMID:; http://dx.doi.org/ 10.1001/jama.285.15.1987 [DOI] [PubMed] [Google Scholar]
- 53. Schulz KF, Altman DG, Moher D. CONSORT 2010 statement: updated guidelines for reporting parallel group randomised trials. PLoS Med 2010; 7:e1000251; PMID:; http://dx.doi.org/ 10.1371/journal.pmed.1000251 [DOI] [PMC free article] [PubMed] [Google Scholar]
- 54. Altman DG, McShane LM, Sauerbrei W, Taube SE. Reporting recommendations for tumor marker prognostic studies (REMARK): explanation and elaboration. PLoS Med 2012; 9:e1001216; PMID:; http://dx.doi.org/ 10.1371/journal.pmed.1001216 [DOI] [PMC free article] [PubMed] [Google Scholar]
- 55. Lin IF, Chang WP, Liao YN. Shrinkage methods enhanced the accuracy of parameter estimation using Cox models with small number of events. J Clin Epidemiol 2013; 66:743-51; PMID:; http://dx.doi.org/ 10.1016/j.jclinepi.2013.02.002 [DOI] [PubMed] [Google Scholar]
- 56. Vittinghoff E, McCulloch CE. Relaxing the rule of ten events per variable in logistic and Cox regression. A J Epidemiol 2007; 165:710-8; PMID:; http://dx.doi.org/ 10.1093/aje/kwk052 [DOI] [PubMed] [Google Scholar]
- 57. Taylor JM, Ankerst DP, Andridge RR. Validation of biomarker-based risk prediction models. Clin Cancer Research 2008; 14:5977-83; PMID:; http://dx.doi.org/ 10.1158/1078-0432.CCR-07-4534 [DOI] [PMC free article] [PubMed] [Google Scholar]
Associated Data
This section collects any data citations, data availability statements, or supplementary materials included in this article.