Abstract
The infiltration of T lymphocytes within tumors is associated with better outcomes in cancer patients, yet current understanding of factors that influence T-lymphocyte infiltration into tumors remains incomplete. In our study, Temozolomide (TMZ), a chemotherapeutic drug used to treat metastatic melanoma, induced T-cell infiltration into transplanted melanoma and into genitourinary (GU) tumors in mice developing spontaneous melanoma. In contrast, TMZ treatment did not increase T-cell infiltration into cutaneous tumors, despite similar increases in the expression of the (C-X-C) chemokines CXCL9 and CXCL10 in all sites after TMZ exposure. Our findings reveal that the matrix architecture of the GU tumor stroma, and its ability to present CXCL9 and CXCL10 after TMZ treatment played a key role in favouring T-cell infiltration. We subsequently demonstrate that modifications of these key elements by combined collagenase and TMZ treatment induced T-cell infiltration into skin tumors. T cells accumulating within GU tumors after TMZ treatment exhibited T helper type-1 effector and cytolytic functional phenotypes, which are important for control of tumor growth. Our findings highlight the importance of the interaction between tumor stroma and chemokines in influencing T-cell migration into tumors, thereby impacting immune control of tumor growth. This knowledge will aid the development of strategies to promote T-cell infiltration into cancerous lesions and has the potential to markedly improve treatment outcomes.
Keywords: chemokines, temozolomide, tumor-infiltrating lymphocytes, tumor stroma
Abbreviations: CXCL, Chemokine (C-X-C motif) ligand; CTL, cytolytic T lymphocyte; GU, genitourinary; GZB, Granzyme B; ECM, extracellular matrix; HSPG, heparan sulphate proteoglycan; IFNγ, interferon γ; TAF, tumor-associated fibroblast; Th, T helper; TILs, tumor-infiltrating lymphocytes; TMZ, Temozolomide; Treg, T regulatory; WT, wild-type
Introduction
The extent of T-cell infiltration into tumors is a known prognostic factor for patient survival and outcome in several cancers 1-3, including melanomas.4,5 Such observations would imply that T-cell immunity induced by therapeutic vaccines or T-cell adoptive transfer should induce melanoma regression, or at least stabilization. However, data from clinical trials indicate otherwise; while these strategies did benefit selected subsets of patients, most individuals did not respond clinically; tumor growth often continues unabated, despite detection of functional antitumor T-cell responses in the peripheral blood. There are several possible explanations for this apparent paradox - a lack of specificity of the T cells, immune suppression within the tumor local environment and/or insufficient recruitment of T cells to the tumor site.6,7 The present study investigates this last factor. Human and murine studies have shown that intratumoral expression of chemokines, including chemokine (C-X-C motif) ligands (CXCL)-9 and CXCL10, correlates with the presence of tumor-infiltrating lymphocytes (TILs) in melanoma lesions.8,9 Therefore, identifying approaches to promote T-cell migration into tumors to improve the outcome of cancer immunotherapy is a priority.10
Most studies examining immune responses in melanoma have been conducted in rodents bearing transplanted tumors. However, tumor cells grafted into mice are distinct from autochthonous tumors originating in situ, and fail to replicate the full complexity of tumor cell-matrix interactions and the barriers to immune cell access imposed by the tumor stroma, which likely contribute to the treatment resistance of cancers in vivo.11 Indeed, transplanted tumors in mouse models often respond readily to chemotherapy, in marked contrast to spontaneous tumors in either mice or humans.12 Immunocompetent RETAAD mice express the human RET oncogene in their melanocytes leading to development of uveal melanomas that metastasize to the skin and viscera, thus providing a unique opportunity to study the spontaneous initiation and progression of cancer recapitulating many features of human disease. Temozolomide (TMZ), a chemotherapeutic drug commonly used in the treatment of metastatic melanoma, has been reported to induce T-cell infiltration into transplanted tumors in immunocompromised mice.9 We therefore asked whether the same effect was evident in RETAAD mice, which recapitulate many of the features of human spontaneous metastatic melanoma 13, and, if so, which factors were governing T-cell infiltration into tumors in these animals.
Our data show that TMZ treatment of RETAAD mice promotes T-cell infiltration into genitourinary (GU) visceral tumors, but not into cutaneous tumors, despite similar increases in abundance of the T cell-attracting chemokines CXCL9 and CXCL10. We found that the matrix architecture of the GU tumor stroma and its ability to present CXCL9 and CXCL10 provided a permissive environment for T-cell infiltration after TMZ exposure, a phenomenon which is not present in the cutaneous tumors. Combining local collagenase with TMZ treatment in cutaneous tumors modified the tumor stromal matrix architecture, increased CXCL9 and CXCL10 presentation and induced T-cell infiltration. TMZ treatment recruited primarily T helper (Th1) type-1 effector and cytolytic T lymphocytes (CTLs) into tumors. Finally, by blocking chemokine signalling to attenuate T-cell infiltration, we showed that these T cells are critical for tumor control after TMZ treatment.
Results
Temozolomide treatment induces T-cell infiltration into transplanted melanoma tumors via CXCR3-signaling
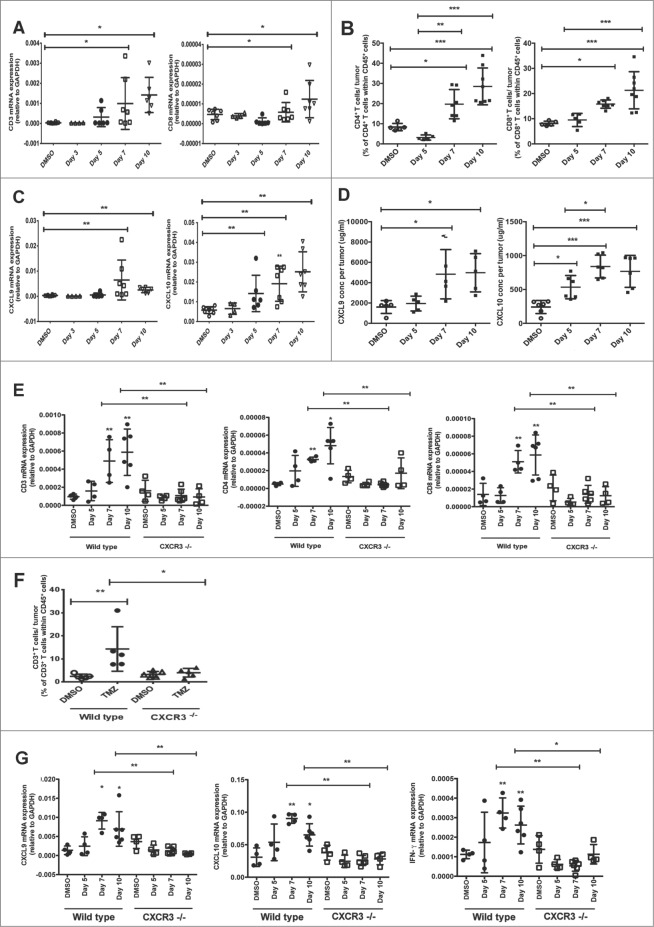
Because our previous work showed treating immunocompromised mice with TMZ induced T-cell infiltration into subcutaneously-implanted Melan-ret tumors 9, we first asked whether similar results would be observed in WT, immunocompetent, mice bearing transplanted melanomas. We detected significantly higher mRNA levels corresponding to the T cell-associated molecules CD3 and CD8 in tumors at 7 and 10 days post-TMZ treatment, compared to tumors from control mice treated with DMSO alone (Fig. 1A), indicative of T-cell infiltration. This was confirmed by flow cytometric analysis in which higher percentages of CD4+ and CD8+ T cells within the CD45+ fraction were detected in the tumors (Fig. 1B). Consistent with our earlier work,9 we detected significantly higher levels of CXCL9 and CXCL10 mRNA transcripts (Fig. 1C) and proteins (Fig. 1D) in the tumors from TMZ treated mice compared to controls, and this coincided with increased T-cell infiltration at 7 and 10 days post-TMZ treatment. In addition, CXCL9 and CXCL10 mRNA expression levels correlated closely with those of CD3 at day 7 post-TMZ treatment (Pearson's r = 0.96 and 0.94 respectively, r2 = 0.91 and 0.87 respectively; both p < 0.01; Fig. S1A).
Figure 1.
Temozolomide treatment induces T-cell infiltration into transplanted Melan-ret tumors in a CXCR3-dependent manner. (A-G) C57/BL6 wild type (WT) and Cxcr3−/− mice were injected subcutaneously in each flank with 106 Melan-ret cells and treated with either 2 mg Temozolomide (TMZ) or vehicle [dimethyl sulfoxide (DMSO)] daily for 3 days once tumors became palpable. Tumors were dissociated and analysed as indicated. (A) qRT-PCR analysis of the gene expression of CD3 and CD8 in transplanted tumors at various time points post- treatment. (B) Flow cytometry analysis of CD4+ and CD8+ T cells in transplanted tumors at various time points post-treatment. (C) Gene expression of CXCL9 and CXCL10 in transplanted tumors at various time points post-treatment. (D) ELISA analysis of CXCL9 and CXCL10 protein levels in transplanted tumors at various time points post-treatment. (E) Gene expression of CD3, CD4 and CD8 in transplanted Melan-ret tumors from WT and Cxcr3−/− mice at various time points posttreatment. (F) Flow cytometry analysis for CD3+ T cells in transplanted Melan-ret tumors from WT and Cxcr3−/− mice at day 7 after treatment. (G) Gene expression of CXCL9, CXCL10 and IFNγ in Melan-ret tumors from WT and Cxcr3−/− mice at various time points post-treatment. Data from panels: (A and C) are pooled from 2 independent experiments with 4-5 mice per group in each experiment (n = 6-8/group); (B and D) consist of 5-7 mice per group; (E-G) are pooled from 2 independent experiments with 3-4 mice per group in each experiment (n = 6-8/group). Bars represent mean ± SD. Statistical analyses were performed using one-way ANOVA test with Bonferroni's post-test analysis; *p<0.05, **p<0.01.
To determine whether T cell infiltration following TMZ treatment was indeed dependent on CXCL9 and CXCL10, we utilized mice lacking the signalling receptor for these chemokines, chemokine (C-X-C motif) receptor 3 (CXCR3). We treated WT and Cxcr3−/− mice bearing transplanted tumors with TMZ or DMSO. Consistent with our earlier experiments, elevated transcript levels of CD3, CD4 and CD8 were detected in tumors of WT mice at days 7 and 10 after TMZ treatment. In contrast, CD3, CD4 and CD8 mRNA levels were significantly lower in tumors from Cxcr3−/− mice at the same time-points (Fig. 1E). Flow cytometry at day 7 after treatment demonstrated a significant increase in the percentage of T cells in tumors from WT but not Cxcr3−/− mice given TMZ (Fig. 1F).
The kinetics of increased T cell infiltration into tumors of WT mice following TMZ treatment coincided with increased gene expression of CXCL9 and CXCL10. Unexpectedly, there was no increase in gene expression of CXCL9 and CXCL10 in tumors from Cxcr3−/− mice (Fig. 1G). As these chemokines are interferon γ (IFNγ) inducible ligands, we examined IFNγ transcript expression in tumors and found that while IFNγ in tumors from WT mice was elevated after TMZ treatment, its expression remained low in tumors from Cxcr3−/− animals (Fig. 1G).
Overall, these data show that TMZ treatment increases T-cell infiltration into transplanted melanomas, dependent on CXCR3-signaling and up-regulation of the CXCR3 ligands, CXCL9 and CXCL10.
Temozolomide treatment induces T-cell infiltration into GU tumors in a model of spontaneous melanoma
Because observations arising from studies in transplanted and spontaneous tumor models have often been discordant, we next asked whether TMZ promoted T cell infiltration into tumors in a model of spontaneous melanoma. To this end, we treated RETAAD mice with either TMZ or DMSO and assessed T-cell infiltration in tumors of the genitourinary system, a site in which immune control has been shown to be particularly important in controlling disease progression and metastasis.
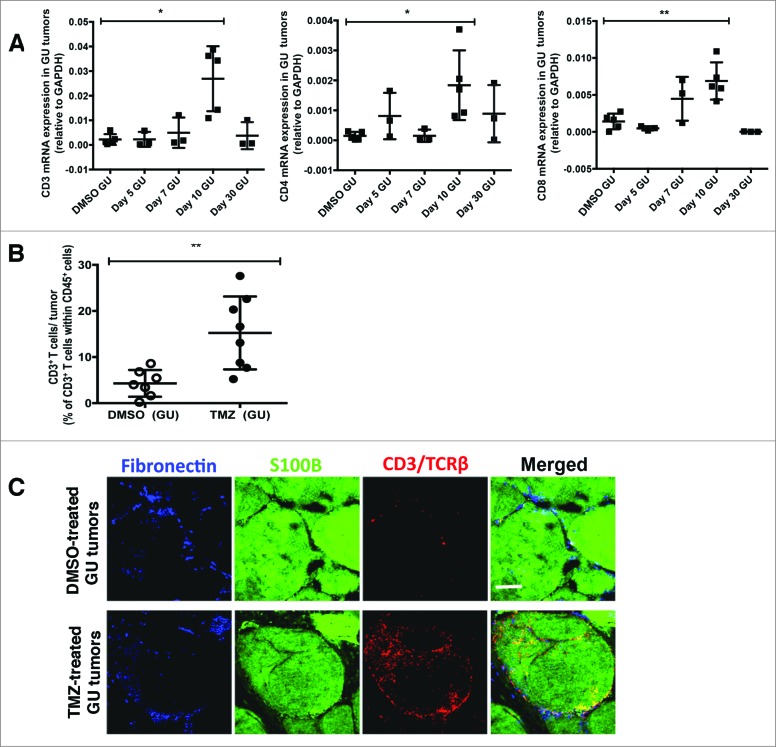
Analysis suggested that in comparison to control (DMSO) treatment, TMZ treatment increased T-cell infiltration into GU tumors by day 10, as evidenced by significantly higher mRNA transcripts of CD3, CD4 and CD8 (Fig. 2A). Flow cytometric analysis of day 10 dissociated GU tumors confirmed that TMZ treatment increased T-cell infiltration by more than >2 fold relative to control (T cells comprising 35.7% versus 15.3% of CD45+ cells, TMZ treatment versus DMSO control, respectively; p < 0.01) (Fig. 2B). Immunofluorescence imaging of sections from the same GU tumors revealed that T cells were abundant in TMZ-treated but not control mice, with T cells found in both the fibronectin+ tumor stroma and S100B+ melanoma antigen-expressing tumor nest (Fig. 2C). Altogether, these data show that TMZ treatment consistently induced recruitment of T cells into GU tumors.
Figure 2.
Temozolomide treatment induces T-cell infiltration into genitourinary tumors in a model of spontaneous melanoma. (A-C) RETAAD mice were treated with Temazolomide (TMZ) only or dimethyl sulfoxide (DMSO) vehicle after they were determined to have developed genitourinary (GU) and cutaneous tumors by clinical examination. (A) qRT-PCR analysis was performed to examine for gene expression of CD3, CD4 and CD8 in GU tumors from RETAAD mice following TMZ treatment. (B) Flow cytometry analysis of T cells in GU tumors from RETAAD mice at day 10 after TMZ treatment. (C) Immunofluorescence imaging to detect T cells in GU tumors from RETAAD mice at day 10 after TMZ treatment. Data from (A) are pooled from 3-5 mice per group and data from (B) are pooled from 2 separate experiments with 3-4 mice per group in each experiment (n = 6-8 in each group). Bars represent mean ± SD. Statistical analyses were performed using one-way ANOVA test with Bonferroni's post-test analysis in (A) and the unpaired two-tailed Student's t-test in (B); *p<0.05, **p<0.01. Images from (C) are representative of 5 independent experiments (n = 5 in each group). Scale bars in (C) represent 200 μm.
Temozolomide treatment of RETAAD mice induces intratumoral upregulation of CXCL9 and CXCL10
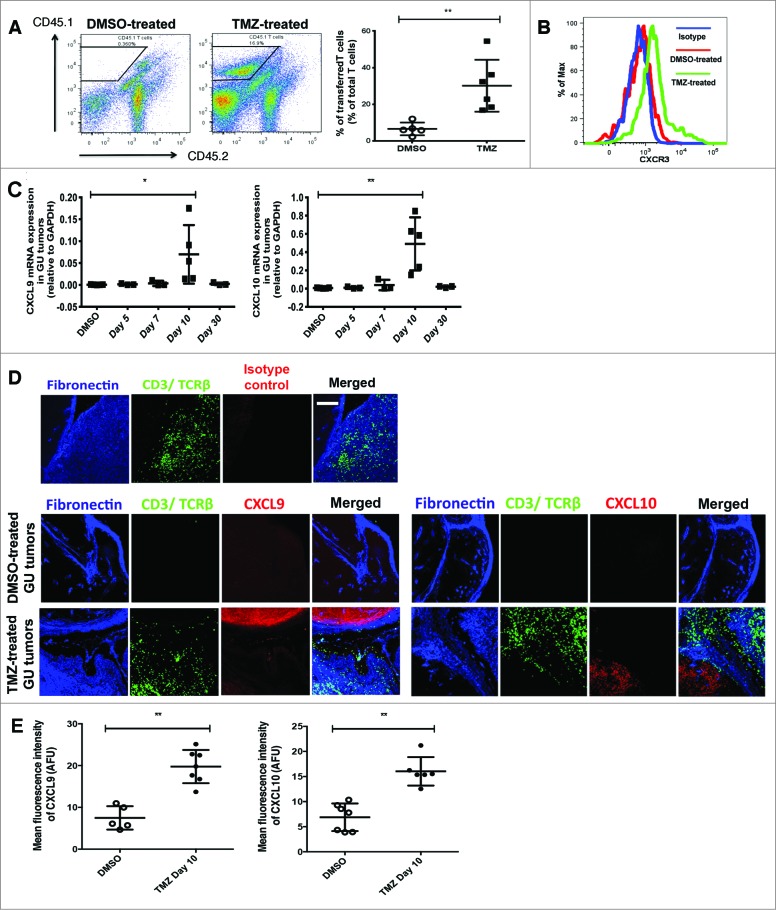
Chemotherapy has been reported to directly activate T cells,15 a process manifesting in an enhancement of both T cell effector functions and tumor-infiltrating abilities. Indeed, activation of T cells in the lymph nodes, spleen and peripheral blood, a response that can be monitored by upregulated CD69, CD28 and CD44 expression, was detected at day 5 following treatment of RETAAD mice with TMZ (Fig. S2). To determine whether increased T-cell entry into GU tumors was due to T-cell activation or changes in the tumor microenvironment, we transferred in vitro anti-CD3 and anti-CD28-activated CD45.1 T cells into RETAAD mice at day 10 following DMSO or TMZ treatment. Recipient mice were sacrificed 5 days after T-cell transfer. We reasoned that if T-cell activation status was a key determinant of its infiltration, the total T-cell population within GU tumors from DMSO and TMZ-treated mice would contain similar percentages of transferred T cells. On the contrary, we observed TMZ treatment promoted the infiltration of transferred T cells into GU tumors, as there was a higher frequency of CD45.1 tumor-infiltrating T cells relative to the control (31.5% versus 8.7% of total T cells in TMZ and DMSO-treated mice, respectively; p<0.01) (Fig. 3A). These findings suggest that TMZ-mediated alterations to the GU tumor microenvironment could contribute substantially to increased T-cell infiltration.
Figure 3.
(See previous page). Temozolomide treatment of RETAAD mice induces intratumoral upregulation of CXCL9 and CXCL10. (A-E) RETAAD mice were treated with Temazolomide (TMZ) or dimethyl sulfoxide (DMSO) vehicle only after they were determined to have developed genitourinary (GU) and cutaneous tumors by clinical examination. (A) In vitro activated CD45.1 T cells were transferred into RETAAD mice at day 10 following DMSO or TMZ treatment. Recipient mice were sacrificed 5 days after T-cell transfer. Dissociated tumor cells were immunostained and flow cytometry was performed to detect transferred CD45.1 T cells in GU tumors. (B) CXCR3 expression on the surface of infiltrating T cells in GU tumors from DMSO or TMZ-treated mice was examined by immunostaining and flow cytometry analysis. (C) qRT-PCR analysis of gene expression of CXCL9 and CXCL10 in GU tumors at various time points after TMZ treatment. (D) Immunofluorescence imaging was performed to examine CXCL9 and CXCL10 protein expression in GU tumors at day 10 after TMZ treatment. (E) Mean fluorescence index (MFI) quantification of CXCL9 and CXCL10 staining in GU tumors at day 10 after TMZ treatment. Data from panel: (A) are pooled from 2 separate experiments with 3 mice per group in each experiment (n = 6/group); (B) is representative of 4 separate experiments (n = 4/group); (C and E) are pooled from 4-6/group. Bars represent mean ± SD. Statistical analyses were performed using the unpaired two-tailed Student's t-test in (A and E) and the one-way ANOVA test with Bonferroni's post-test analysis in (C); *p<0.05, **p<0.01. Images from (D) are representative of 4-6 independent experiments (n = 4-6/group). Scale bars in (D) represent 200 μm.
At day 10 post-treatment, T cells in GU tumors of TMZ-treated mice expressed higher levels of surface and intracellular CXCR3 as compared to control lesion-infiltrating T cells (Fig. 3B). This implied a preferential recruitment of CXCR3+ T cells into GU tumors likely resulting from intratumoral upregulation of CXCR3 ligands after TMZ treatment. Indeed, TMZ treatment induced the up-regulation of CXCL9 and CXCL10 gene expression in GU tumors at day 10 (Fig. 3C), coinciding with increased T-cell infiltration. Immunofluorescence imaging and quantification confirmed that CXCL9 and CXCL10 protein expression was quantitatively higher in GU tumors after TMZ treatment, such that the mean fluorescence intensity (MFI) of CXCL9 was 7.5 versus 19.8 arbitrary fluorescent units (AFU) and that of CXCL10 was 6.8 versus 16.0 AFU in DMSO and TMZ-treated mice, respectively (all p<0.01) (Fig. 3D and E). Moreover, we noted a linear relationship between CD3 and either CXCL9 or CXL10 mRNA expression (Pearson's r = 0.90 and 0.88 respectively, r2 = 0.82 and 0.8 respectively; both p<0.05) (Fig. S1B), suggesting that the extent of T-cell recruitment was determined by the amount of chemokines expressed in the GU tumors.
Overall, the data indicate that treating RETAAD mice with TMZ increased CXCL9 and CXCL10 expression in GU tumors and associated with this, increased T-cell infiltration.
T-cell infiltration varies by tumor site
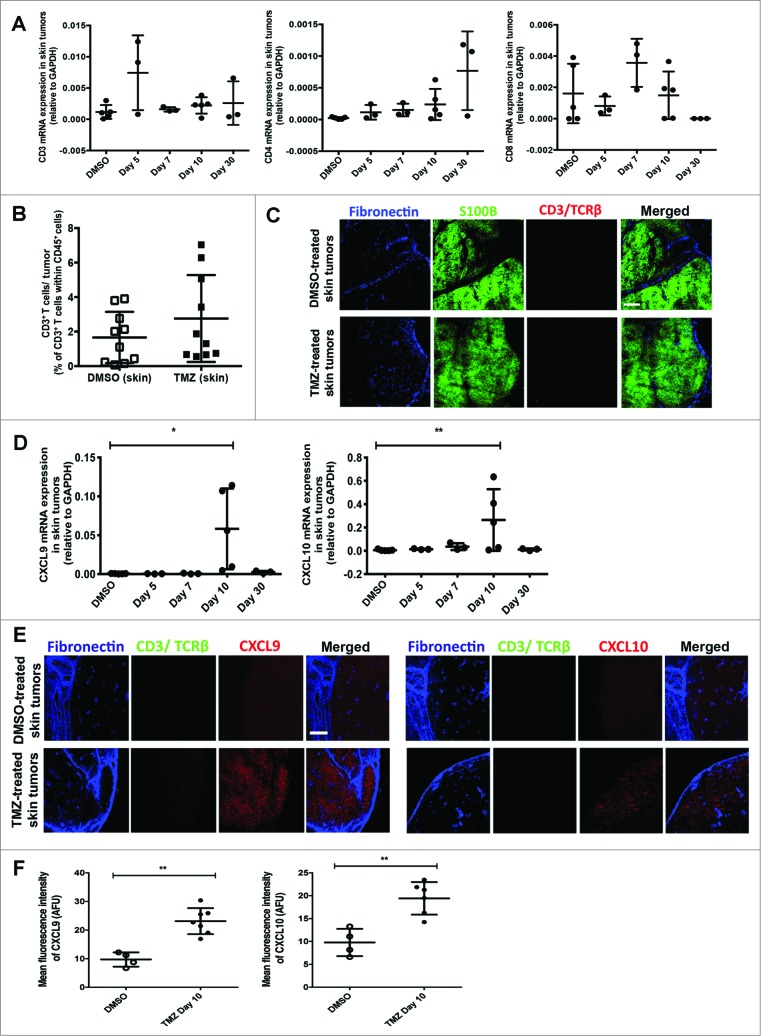
In the RETAAD model, visceral GU tumors and cutaneous tumors are known to display unique responses to anti-tumor T cells. Thus, we asked whether T-cell tumor infiltration differed between the two sites. In contrast to GU tumors, there was no evidence that TMZ treatment affected the RNA transcript levels of CD3, CD4 or CD8 in skin tumors from RETAAD mice, suggesting a lack of T cells in cutaneous tumors (Fig. 4A). The observation that TMZ treatment did not induce T-cell infiltration into skin tumors was confirmed by flow cytometry analysis (Fig. 4B) and immunofluorescence imaging (Fig. 4C), in which T cells in the skin tumors were rarely observed. Altogether, this shows that, unlike GU tumors, TMZ treatment did not promote recruitment of T cells into skin tumors in RETAAD mice. However, as in the GU tumors with abundant T-cell recruitment, both mRNA (Fig. 4D) and protein levels of CXCL9 and CXCL10 in skin tumors were increased after TMZ therapy (CXCL9 MFI of 9.7 versus 23.1 AFU and CXCL10 MFI of 9.8 versus 19.4 AFU in DMSO and TMZ-treated mice, respectively; all p<0.01) (Fig. 4E and F).
Figure 4.
(See previous page). Temozolomide treatment does not induce T-cell infiltration into skin tumors from RETAAD mice despite increased CXCL9 and CXCL10 expression. Cutaneous tumor-bearing RETAAD mice were treated with Temazolomide (TMZ) or dimethyl sulfoxide (DMSO) vehicle. (A) qRT-PCR analysis of gene expression of CD3, CD4 and CD8 in skin tumors following Temozolomide (TMZ) treatment. (B) Flow cytometry analysis of T cells in skin tumors from RETAAD mice at day 10 after TMZ treatment. (C) Immunofluorescence imaging to detect T cells in skin tumors at day 10 after TMZ treatment. (D) CXCL9 and CXCL10 gene expression in skin tumors following TMZ treatment. (E) Immunofluorescence imaging was performed to examine CXCL9 and CXCL10 protein expression in skin tumors at day 10 after TMZ treatment. (F) MFI quantification of CXCL9 and CXCL10 staining in skin tumors at day 10 after TMZ treatment. Data from panels: (A and D) are pooled from 3-5 mice per group; (B) are pooled from 2 separate experiments with 3-4 mice per group in each experiment (n = 6-8/group). Data from (F) are from 4-6 mice per group. Bars represent mean ± SD. Statistical analyses were performed using one-way ANOVA test with Bonferroni's post-test analysis in (A and D) and the unpaired two-tailed Student's t-test in (B and F); *p<0.05, **p<0.01. Images from (C and E) are representative of 5 independent experiments (n = 5 in each group) and scale bars in represent 200 μm.
T-cell infiltration into tumors is determined by both stromal architecture and chemokine presentation
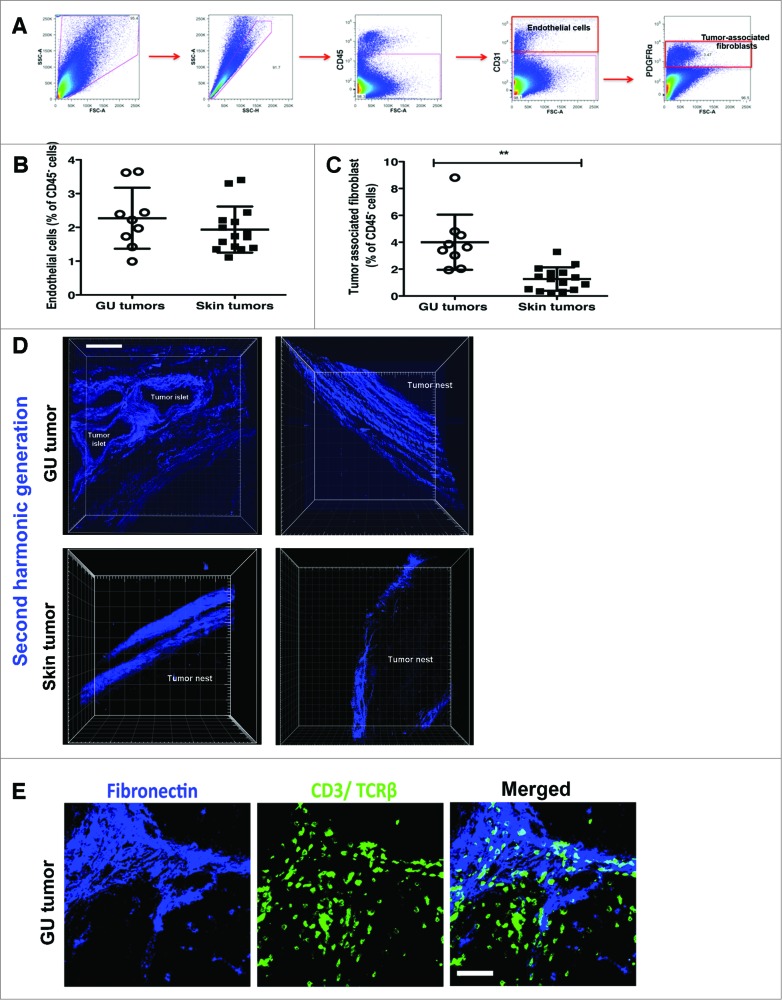
We were intrigued by this stark contrast in T-cell infiltration into GU versus skin tumors after TMZ treatment, particularly given the similar levels of T cell-attracting chemokines. We speculated that poor tumor vascularity or structural barriers posed by the tumor stroma might impede T-cell access to skin tumors. To test this, we assessed the relative composition of tumors from the two sites, using flow cytometry to compare the percentage of endothelial cells and associated-associated fibroblasts (TAFs), which constitute the blood-lymphatic vessels and tumor stroma, respectively. CD45− CD31+ endothelial cells (Fig. 5A) were present in similar proportions in both GU and skin tumors (Fig. 5B), suggesting that vascular access did not account for differences in T-cell infiltration into GU and skin tumors after TMZ treatment. CD45− CD31− platelet derived growth factor receptor (PDGFR)α+ TAFs (Fig. 5A) were considerably enriched in lesions of GU as compared to skin tumors (Fig. 5C), suggesting that the amount of tumor stroma did not act as a biophysical barrier limiting T-cell access after TMZ treatment.
Figure 5.
(See previous page). Matrix architecture of GU and skin tumor stroma is characterized by distinct patterns of collagen deposition. Genitourinary (GU) and cutaneous tumors from RETAAD mice were examined for differences in stromal and matrix composition by immunostaining and fluorescence cytometry (A-C) and high-resolution 2-photon microscopy (D-E). (A) Representative dot plots showing flow cytometry gating strategy for CD45− CD31+ endothelial cells and CD45− CD31− PDGFRα+ tumor-associated fibroblasts (TAFs). Flow cytometry analysis was performed to quantify (B) CD45− CD31+ endothelial cells and (C) CD45− CD31− PDGFRα+ TAFs present in GU and skin tumors. (D) High-resolution images of collagen fibres within the GU and skin tumor stroma were generated by second harmonic generation (SHG) using a 2-photon microscope (E) Immunofluorescence imaging were performed to examine T cells interactions with the GU tumor stroma. Data from panels: (B and C) are pooled from 2 separate experiments with 4-5 mice per group in each experiment (n = 9-15/group). Bars represent mean ± SD. Statistical analyses were performed using the unpaired two-tailed Student's t-test; **p<0.01. Images from (D and E) are representative of 5 independent experiments (n = 5/group). Scale bars in (D) and (E) represent 75 μm and 50 μm, respectively.
Alongside cellular composition of the tumor mass, the structure of the stroma can also be an important factor determining immune cell access. Second harmonic generation (SHG) using a 2-photon microscope was subsequently applied to generate high-resolution images of the collagen fibres within the stroma. These images revealed profound differences in the matrix architecture of GU and skin tumors. In contrast to the dense layers of interwoven collagen fibres in skin tumor stroma, GU tumor stroma typically consisted of a loose network of discrete collagen fibres aligned linearly to tumor islets and nest (Fig. 5D and Supp. Movies 1-4). Closer examination revealed that T cells localized on the GU tumor stroma exhibited an elongated and polarized morphology, characteristic of cells migrating in response to a surface bound gradient of chemoattractant (a process known as haptotaxis). The observation of T cells apparently ‘crawling’ on the GU tumor stroma suggested that these extracellular matrix (ECM) structures were providing contact guidance for T cells as they migrated through the 3 dimension interstitial space (Fig. 5E). On the contrary, T cells in the fibronectin− tumor nest, farther away from the tumor stroma, had a rounded morphology (Fig. 5E).
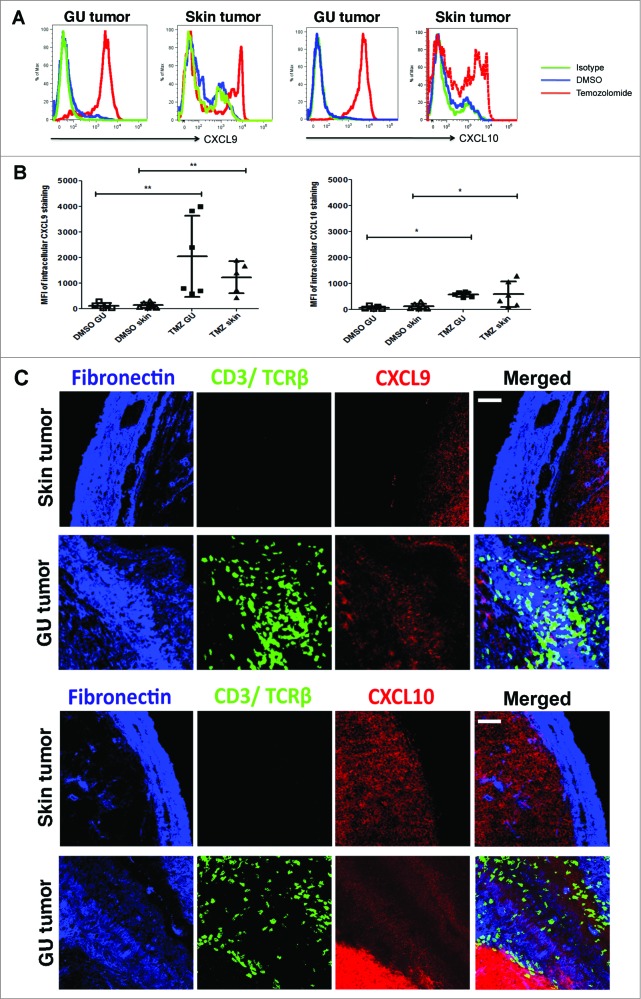
While these observations were interesting, they did not entirely explain the counter-intuitive lack of T cells in the presence of abundant levels of T cell-attracting chemokines. We therefore asked how the CXCL9 and CXCL10 expression induced by TMZ treatment was involved in T-cell localization within the tumor stroma. Assessment of intracellular chemokine protein expression by flow cytometry revealed that TMZ treatment indeed induced TAFs from skin and GU tumors to produce CXCL9 and CXCL10 (Fig. 6A and B). However, MFI and hence levels of CXCL9 and CXCL10 produced by GU and skin TAFs after TMZ exposure were similar (Fig. 6B). This led us to investigate whether there was a difference in the accessibility of the CXCL9 and 10 produced in the GU versus skin tumor stroma after TMZ treatment. While abundant CXCL9 and CXCL10 were detected on the fibronectin+ GU tumor stroma by immunofluorescence imaging, expression of these chemokines on skin tumor stroma was surprisingly weak (Fig. 6C). Supporting the significance of this observation, T cells were observed in close contact with the CXCL9 and CXCL10-coated GU tumor stroma (Fig. 6C). Thus, on the basis of flow cytometry and immunofluorescence imaging, our observations suggest that, although TMZ treatment induces both GU and skin TAFs to produce CXCL9 and CXCL10, these chemokines are only efficiently presented and retained by the GU tumor stroma.
Figure 6.
Chemokine presentation on GU tumor stroma differs from that in skin tumor stroma. Genitourinary (GU) and cutaneous tumor-bearing RETAAD mice were treated with Temazolomide (TMZ) or dimethyl sulfoxide (DMSO) vehicle. (A) Flow cytometry analysis to evaluate intracellular CXCL9 and CXCL10 expression by GU and skin tumor-associated fibroblasts (TAFs) at day 10 after DMSO or TMZ treatment. (B) Flow cytometry assessment of CXCL9 and CXCL10 expression by TAFs from skin and GU tumors after DMSO or TMZ treatment. (C) High magnification immunofluorescence images were obtained to examine CXCL9 and CXCL10 protein expression on GU and skin tumor stroma. Data from (A) and (B) are representative of and pooled from 2 separate experiments with 3 mice per group in each experiment (n = 6/group). Images from (C) are representative of 5 independent experiments (n = 5/group). Scale bars in (C) represent 50 μm.
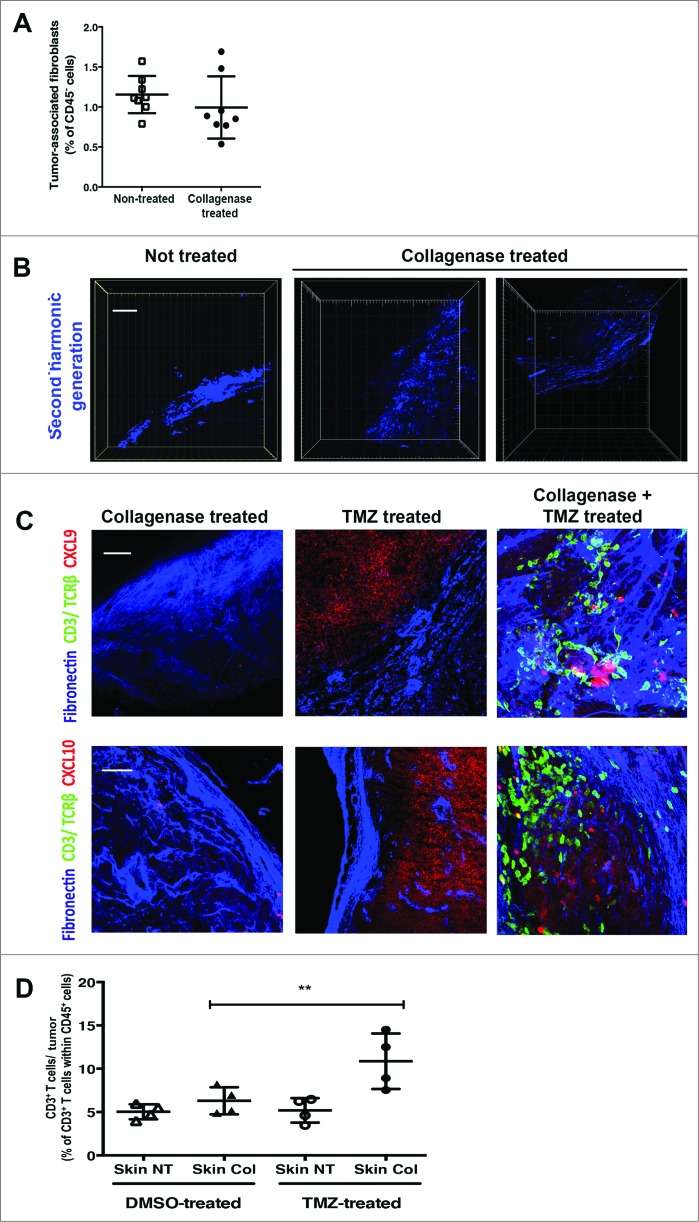
To test our hypothesis that the matrix architecture of skin tumors inhibits CXCL9 and CXCL10 presentation on the stroma, we treated select skin tumors on RETAAD mice with topical collagenase in addition to DMSO or TMZ systemic treatment. We observed that treatment with collagenase did not result in ablation of the TAFs, evidenced by similar populations of TAFs in both arms (1.15% versus 0.99% of CD45− cells in control and collagenase-treated tumors, respectively) (Fig. 7A). However, high-resolution images of skin tumor sections revealed that collagenase treatment induced distinct changes in the tumor stromal matrix architecture. In contrast to the dense collagen fibres in untreated skin tumor stroma (Fig. 7B, leftmost panel), collagenase-treated tumor stroma devolved into a fragmented (Fig. 7B, middle panel) or loose network of collagen fibres (Fig. 7B, rightmost panel; Supp. Movies 5-6) indicative of degradation of collagen fibres in the skin tumor stroma.
Figure 7.
Combined treatment of RETAAD skin tumors with topical collagenase and systemic TMZ induces T cell infiltration. Cutaneous tumor-bearing RETAAD mice were treated with Temazolomide (TMZ) or dimethyl sulfoxide (DMSO) vehicle with or without topical collagenase. (A) Flow cytometry analysis of tumor-associated fibroblasts (TAFs) in control and collagenase-treated RETAAD skin tumors. (B) 2-photon high-resolution microscopic images of collagen fibres in skin tumor stroma following collagenase treatment. (C) High magnification images to examine CXCL9 and CXCL10 expression on skin tumor stroma from mice treated with collagenase only, TMZ only or collagenase plus TMZ. (D) Flow cytometry analysis for T cells in skin tumors from RETAAD mice treated with collagenase only, TMZ only or collagenase plus TMZ. Data from panel: (A) are derived from non-treated and collagenase-treated skin tumors pooled from 4 mice per group; (D) are from skin tumors pooled from 4 mice per treatment group. Bars represent mean ± SD. Statistical analyses were performed using the paired two-tailed Student's t-test for (A) and the one-way ANOVA test with Bonferroni's post-test analysis for (D); **p<0.01. Images from (B and C) are representative of 4 independent experiments (n = 4/group). Scale bars in (B) and (C) represent 75 μm and 50 μm, respectively.
Collagenase treatment on its own did not increase CXCL9 and CXCL10 expression on the tumor stroma (Fig. 7C, leftmost panel) and was hence insufficient to induce T-cell migration into skin tumors (Fig. 7C and D). Consistent with earlier data, TMZ treatment alone did not increase CXCL9 and CXCL10 presentation on the skin tumor stroma (Fig. 7C, middle panel) and had little effect on T-cell migration into skin tumors (Fig. 7C and D). On the contrary, combined treatment with TMZ and collagenase altered the matrix architecture and increased CXCL9 and CXCL10 availability on the skin tumor stroma (Fig. 7C, rightmost panel) and in doing so, promoted T-cell migration into skin tumors (Fig. 7C and D). In accord with these observations, T cells exhibiting a morphology characteristic of haptotaxis were noted to be contacting the CXCL9 and CXCL10-coated skin tumor stroma (Fig. 7C, rightmost panel).
Altogether, our observations indicate that T-cell infiltration into tumors is co-determined by stromal matrix architecture and chemokine presentation. In tumors with stroma composed of dense collagen content, interventions that alter either determinant alone are in effect not sufficient to promote T-cell infiltration.
TMZ treatment induces accumulation of Th1 effector and cytolytic T cells in GU tumors
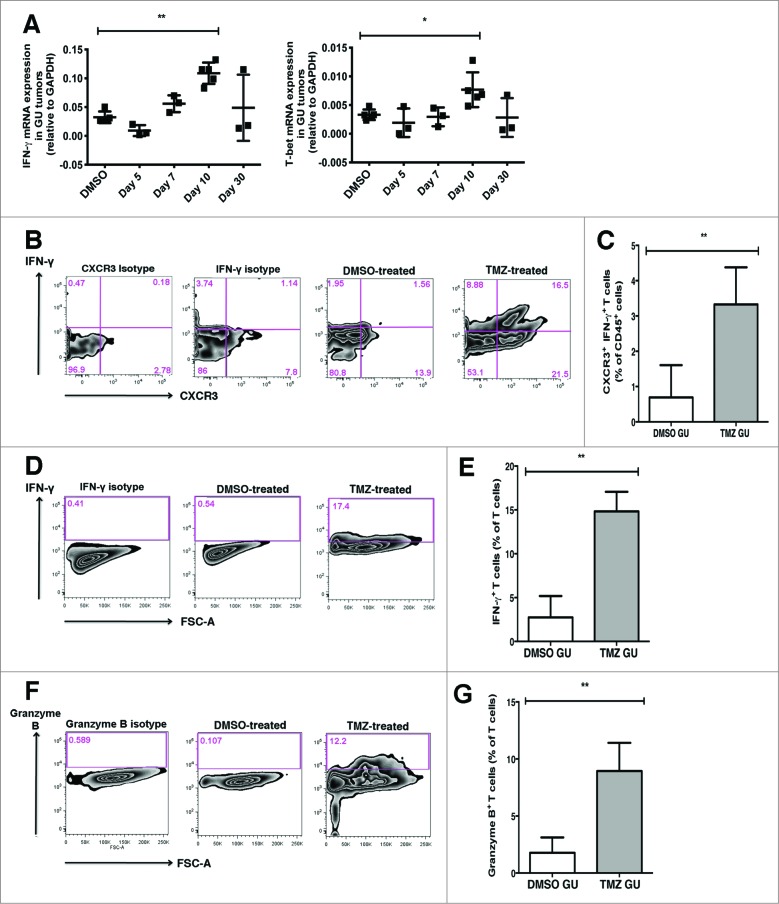
We next investigated the functional phenotype of the T cells accumulating within GU tumors of TMZ-treated mice. We analyzed GU tumors by qRT-PCR and found similar GATA-3, IL-17A and FOXP3 transcript levels after TMZ treatment (Fig. S3). In contrast, at day 10, IFNγ and Tbx21/T-bet expression was significantly higher in GU tumors from TMZ-treated compared to control mice, suggesting a preferential accumulation of T helper-1 (Th1) T cells (Fig. 8A). To verify this, we determined the frequency of IFNγ-producing T cells within tumors, as IFNγ production is a hallmark of Th1 function. Tumor cell suspensions were incubated with Brefeldin A for 4 h before intracellular cytokine labelling for IFNγ was performed. CXCR3+ IFNγ-producing T cells were about 5 times more abundant in GU tumors (3.3% of CD45+ cells) from TMZ-treated as compared to control mice (0.7% of CD45+ cells) (Fig. 8B and C).
Figure 8.
T cells accumulating in GU tumors following TMZ treatment exhibit Th1 effector and cytolytic T cell phenotypes. Genitourinary (GU) tumor-bearing RETAAD mice were treated with Temazolomide (TMZ) or dimethyl sulfoxide (DMSO) vehicle. (A) qRT-PCR analysis of gene expression of interferon γ (INFγ) and T-box 21 (Tbx21/T-bet) in GU tumors following TMZ treatment. (B) Representative dot plots showing intracellular cytokine labelling for IFNγ. To determine frequency of CXCR3+ IFN-γ-producing T cells within tumors, tumor cell suspensions were incubated with Brefeldin A for 4 h before intracellular cytokine labelling for IFNγ was performed. (C) Flow cytometry quantification to examine abundance of CXCR3+ IFNγ-producing T cells in GU tumors from TMZ-treated and control mice. (D) Representative dot plots showing intracellular cytokine labelling for IFNγ after an overnight stimulation with anti-CD3 and anti-CD28 antibodies. (E) Flow cytometry quantification to examine abundance of IFNγ-producing T cells in GU tumors from TMZ-treated and control mice. (F) Representative dot plots showing intracellular cytokine labelling for granzyme B after an overnight stimulation with anti-CD3 and anti-CD28 antibodies. (G) Flow cytometry quantification to examine abundance of granzyme B-producing T cells in GU tumors from TMZ-treated and control mice. Data from panels (A) are pooled from 3-5 mice per group; data from (C, E and G) are pooled from 2 separate experiments with 3-5 mice per group in each experiment (n = 6-8/group). Bars represent mean ± SD.. Statistical analyses were performed using one-way ANOVA test with Bonferroni's post-test analysis in (A) and the unpaired two-tailed Student's t-test in (C, E and G); *p<0.05, **p<0.01.
To assess the effector functions of T cells within GU tumors, we next analyzed their IFNγ and granzyme B expression profiles by flow cytometry after overnight stimulation in vitro. A significantly higher proportion of T cells in GU tumors from TMZ-treated mice (14.8% of T cells) produced IFNγ as compared to control animals (2.7% of T cells) (Fig. 8D and E). Similarly, a significantly higher proportion of T cells in GU tumors from TMZ-treated mice (8.9% of T cells) produced granzyme B as compared to control animals (1.8% of T cells) (Fig. 8F and G).
Overall, this demonstrates that TMZ treatment induced an accumulation of T cells with Th1 effector and cytolytic phenotypes within GU tumors.
TMZ treatment-induced T-cell infiltration is important for tumor growth control
We next sought to determine whether increased T-cell infiltration resulting from TMZ treatment was important for tumor growth control. Our earlier data indicates that T-cell infiltration into tumors after TMZ treatment was inhibited in Cxcr3−/− mice. As tumor growth kinetics can be more accurately monitored in transplanted models, we treated Melan-ret tumor-bearing WT and Cxcr3−/− mice with TMZ or DMSO. Tumor growth was monitored closely and the mice were sacrificed 10 days after TMZ treatment. The kinetics of tumor growth was similar in all groups between days 3 to 7 after TMZ treatment (Fig. 9A). However, by day 10 after treatment, Melan-ret tumors in TMZ-treated WT mice (mean volume of 926 mm3) were on average 2.5 times smaller than DMSO-treated WT, DMSO- and TMZ-treated Cxcr3−/− mice (mean volumes of 2438, 2685 and 2408 mm3, respectively). We examined whether tumor cell death was occurring more frequently in tumors highly infiltrated by T cells. We found significantly more Annexin+ AQUA+ CD45− dead tumor cells present in tumors from TMZ-treated WT mice (15.7% of CD45− cells) compared to control WT, control and TMZ-treated Cxcr3−/− mice (3.3%, 6.6% and 8% of CD45− cells, respectively) (Fig. 9B).
Figure 9.
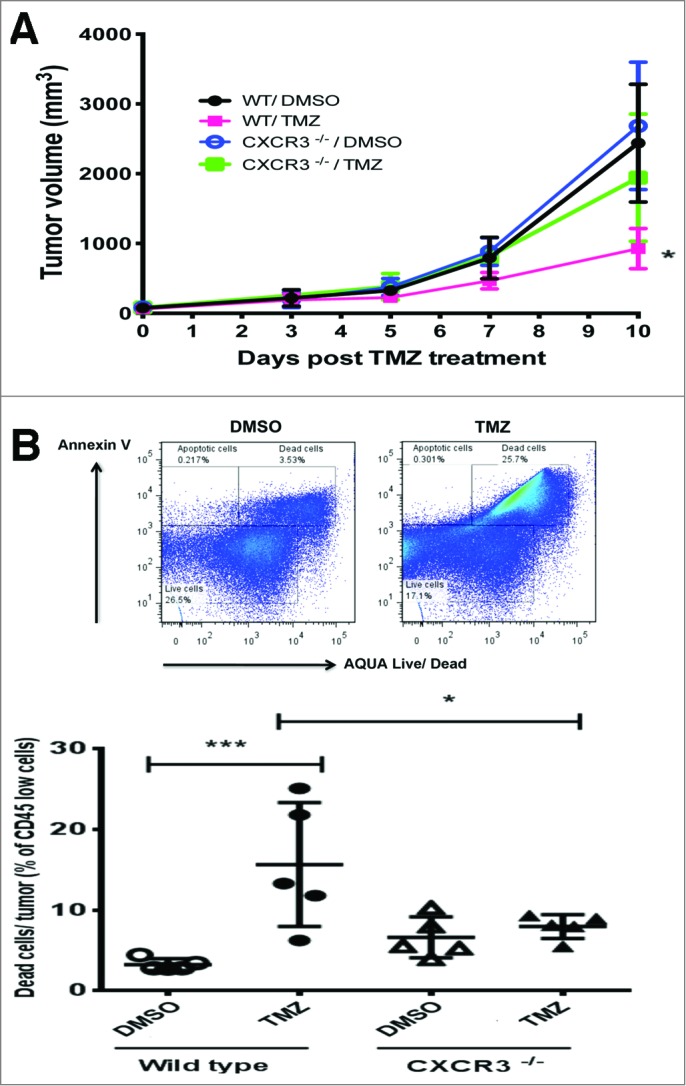
TMZ-induced T cell infiltration inhibits tumor growth. C57/BL6 wild type (WT) and Cxcr3−/− mice were injected subcutaneously in each flank with 106 Melan-ret cells and treated with either 2 mg Temozolomide (TMZ) or vehicle [dimethyl sulfoxide (DMSO)] daily for 3 days once tumors became palpable. (A) Growth kinetics of transplanted Melan-ret tumors in WT or Cxcr3−/− mice treated with DMSO or TMZ. (B) Frequency of tumor cell death measured by the proportion of Annexin+ AQUA+ CD45− tumor cells and quantified by flow cytometry analysis. Data from panel (A) are pooled from 8-10 mice per group and data from (B) are pooled from 5 mice per group. Bars represent mean ± SD. Statistical analyses were performed using one-way ANOVA test with Bonferroni's post-test analysis; *p<0.05, **: p<0.01.
Together, this suggests that recruitment of T cells into tumors augments tumor cell killing initiated by TMZ and is critical for maintaining control over tumor growth.
Discussion
In this study, we showed that spontaneous melanoma bearing RETAAD mice treated with TMZ increased expression of CXCL9 and CXCL10 within GU tumors and promoted T-cell infiltration. Although TMZ treatment similarly increased CXCL9 and CXCL10 expression in cutaneous tumors in RETAAD mice, this molecular response was not accompanied by increased T-cell infiltration. Our subsequent findings suggest that that the matrix architecture of the GU tumor stroma combined with its unique ability to present CXCL9 and CXCL10 support T-cell infiltration into GU tumors following TMZ exposure, and that skin tumors lack these key elements. By combining topical collagenase with TMZ treatment, we could modify the skin tumor stroma matrix architecture and increase CXCL9 and CXCL10 presentation, thereby promoting T-cell infiltration into otherwise poorly accessible skin tumors. T cells infiltrating GU tumors after TMZ treatment were revealed to consist primarily of Th1 effector T cells and CTLs. By abrogating CXCR3-signaling dependent T-cell infiltration into transplanted tumors, we showed that infiltrating T cells are essential for controlling tumor growth after TMZ treatment.
Two early studies using multi-photon microscopy provided the first evidence that T cells migrate along stromal ECM fibres that line tumors.27,28 More recently, T cells in human tumor samples were observed to preferentially accumulate in regions of the stroma composed of a loose network of collagen rather than in collagen-dense regions.29 A similar predilection of T cells to migrate along a loose network of collagen fibres has been observed during inflammation.30,31 In line with these studies, our study also suggests that a loose network of collagen fibres makes the GU tumor stroma more permissive to T-cell entry. In contrast, a dense network of collagen fibres characteristic of skin tumor stroma acts as a biophysical barrier to limit T-cell infiltration. Notably, these observations were not recapitulated in transplanted Melan-ret tumors, which poorly reproduce the structural complexity of naturally arising solid tumors.11,12
Our data shows that although TMZ treatment induced TAFs from both GU and skin tumors to produce CXCL9 and CXCL10, only the GU tumor stroma could present the chemokines efficiently to activated T cells. It is currently unclear which component(s) of the tumor stroma ECM affect immobilization of chemokines, however, one candidate is heparan sulfate proteoglycans (HSPGs) known to be abundantly expressed on tumor stroma in many malignancies.22-24 Tissue HSPGs are known to capture a variety of chemokines including CXCL10,25 and establish a gradient of surface-bound chemokines to direct leukocyte haptotaxis.26 Whether differences in ECM components of GU and skin tumor stroma such as glycosaminoglycans and proteoglycans might be linked to their differential ability to capture chemokines remains unresolved.
Although the dense stroma in skin tumors can act as a biophysical barrier to restrict access of T cells, our previous data and others suggest that the tumor stroma does not constitute an absolute barrier to T-cell recruitment, and that such structural constraints may be overcome by either the increased expression of T cell chemoattractants9,29 or the modification of tumor stroma.34,36-38 In our current study, treatment of skin tumors with collagenase alone induced degradation of collagen fibres in the stroma. However, in the absence of a chemokine gradient, this was not sufficient to induce T-cell infiltration into skin tumors. Combining TMZ with collagenase treatment induced collagen degradation and unexpectedly, increased CXCL9 and CXCL10 presentation on the skin tumor stroma, culminating in increased T-cell infiltration. The exact mechanism(s) leading to increased CXCL9 and CXCL10 presentation on the skin tumor stroma is currently unclear. We speculate that partial degradation of the tightly cross-linked collagen fibres in the skin tumor stroma may expose more HSPG residues, leading to increased capture of CXCL9 and CXCL10 by the stroma.
Renal cell carcinoma (RCC) and melanoma are prototypically responsive to immunotherapy. TILs in RCC or melanoma lesions that are regressing spontaneously or through therapy are known to exhibit dominant Th1-type and CTL responses 16. In contrast, TILs from patients with progressing tumors are characterized by functionally dominant Th2-type and/or CD4+ regulatory T (Treg) responses 17-20. The role of Th17 T cells in tumor immunity is obscured by conflicting data regarding the effects this infiltrating-lymphocyte subset exerts on tumor progression 21. It is noteworthy that in our study, TMZ treatment induced abundant infiltration of Th1 effector T cells and CTLs into GU tumors of RETAAD mice, while there was no indication of significant increases in transcripts associated with Th2, Th17 and Treg cells. Therefore, TMZ treatment induces infiltration of T cells with a functional profile that is beneficial for tumor control. Consistent with this notion, we observed accelerated growth of transplanted tumors when T-cell infiltration was attenuated. Observations that intratumoral CXCL9 and CXCL10 expression remains unchanged by TMZ treatment in Cxcr3−/− mice suggests the existence of an amplification loop in chemokine production and T-cell recruitment. It is likely that TMZ acts on melanoma cells to initiate early CXCL9 and CXCL10 expression. However, IFNγ that is likely derived from the first infiltrating CXCR3+ Th1 cells is required to sustain chemokine expression within the tumors to enable continued recruitment of IFNγ-secreting Th1 cells and CTLs
In summary, we have shown that TMZ alone or in combination with collagenase is an effective strategy to induce T-cell infiltration into visceral and skin melanomas, respectively. Our study provides the first evidence that modification of the tumor stromal matrix architecture together with increasing CXCL9 and CXCL10 presentation promotes T-cell infiltration into tumors with desmoplastic stromal layers. Because tumor stromal organization may be especially desmoplastic in certain tumors, such as pancreatic ductal adenocarcinoma 37, and may also evolve with tumor progression, our findings are likely to be broadly applicable to many solid malignancies.
Materials and Methods
Mice and cell lines
Generation of RETAAD mice has been previously described.14 Cxcr3−/− and CD45.1 congenic female mice on a C57/BL6 background were obtained from The Jackson Laboratory (Bar Harbour, ME) and maintained under specific pathogen-free conditions within the institutional Biological Resource Centre's animal housing unit. Animal care and experimental procedures were approved by the Institutional Animal Care and Use Committee of the Biological Resource Centre, A-STAR, Singapore.
Generation and maintenance of the Melan-ret cell line has been previously described 39. C57/BL6 wild type (WT) and Cxcr3−/− mice were injected subcutaneously in each flank with 106 Melan-ret cells and were treated with either 2 mg TMZ (Sigma-Aldrich) per day, for 3 days, or control vehicle [dimethyl sulfoxide (DMSO)] alone, once tumors became palpable. Tumor sizes were measured using callipers and tumor volume was calculated by the formula:
RETAAD mice were treated with TMZ only after they were determined to have developed GU and cutaneous tumors by clinical examination. Both TMZ-treated mice and their DMSO-treated controls were sacrificed on days 3, 5, 7, 10 or 30 after the start of treatment. In addition to treatment with DMSO or TMZ, selected skin tumors on RETAAD mice were concurrently treated with collagenase cream (Santyl®, Smith and Nephew) daily for 10 days till sacrifice.
T-cell activation and cell transfer
T cells were isolated from the spleen and lymph nodes of CD45.1 mice using EasySep® Mouse T Cell Enrichment Kit (Stem Cell Technologies) and activated overnight in vitro with anti-CD3 and anti-CD28 antibodies. They were subsequently maintained and expanded over 7 days in complete RPMI medium supplemented with 30 U/mL of IL-2.
For adoptive transfers, TMZ or DMSO-treated RETAAD recipient mice were injected intravenously with 4 x10⁷ in vitro activated T cells purified from CD45.1 mice. RETAAD recipient mice were sacrificed 5 days after transfer of T cells.
Tumor dissociation, antibody staining of cell suspensions and cytofluorimetric analysis
Single-cell suspensions of transplanted and autochthonous tumors were obtained by digestion with 1 mg/mL Collagenase A and 0.1 mg/mL DNase I (Roche) in RPMI for 20 min at 37ºC. After red blood cell lysis, Fc receptors were blocked with anti-mouse CD16/CD32 before incubation with antigen-specific antibodies at a 1:200 dilution. Antibodies were from Biolegend, except those specific for CXCL9 and CXCL10, which were from R&D Systems.
BD Cytofix/ Cytoperm Kit (BD Biosciences) was used for intracellular chemokine/ cytokine labelling for fluorescence cytometry as per the manufacturer's protocol. Detection of chemokine production by cells was performed immediately post digestion. Detection of IFNγ and granzyme-B production was performed either with or without overnight restimulation of whole tumor cell suspensions with anti-CD3 and anti-CD28 antibodies. In both conditions, Brefeldin A was incubated with cells for 4-6 h to block secretion of chemokines and enable their detection by flow cytometry.
Live and dead cells were discriminated during flow cytometry using either DAPI or a LIVE/DEAD® Fixable Aqua Dead Cell Stain Kit (Molecular Probes, Invitrogen). Cell counts were determined during flow cytometry using Count Bright® Absolute Counting Beads (Molecular Probes, Invitrogen). Cytofluorimetric analysis was performed using a LSRFortessa (BD Biosciences) flow cytometer and data were analyzed with Flowjo software (Treestar).
Immunohistochemistry and microscopy
Tumors were either freshly embedded in tissue freezing medium or fixed overnight in 2% paraformaldehyde/ 30% sucrose solution at 4°C before embedding. 25-30 μm thick cryostat sections were cut for immunofluorescence imaging. The following purified primary antibodies were used (biotinylated as indicated): anti-TCRβ and anti-CD3 (BD Biosciences), anti-fibronectin (Abcam), anti-S100B (Dako), biotinylated anti-CXCL9 and anti-CXCL10 (R&D Systems). Secondary antibodies used were Dylight647-conjugated streptavidin, Cy3-conjugated anti-rat IgG, Alexafluor 594-conjugated anti-Armenian hamster IgG (all from Molecular Probes). Endogenous avidin and biotin were quenched using the Avidin/ Biotin Blocking Kit (Vector Laboratories).
Images were captured with a confocal microscope (Olympus FV1000) and processed using ImageJ software (http://rsb.info.nih.gov/ij) or Adobe Photoshop CS4 (Adobe Systems, San Jose, CA). Mean fluorescence intensity (MFI) of CXCL9 and CXCL10 staining were quantified on ImageJ using images from 3-4 individual fields of view per sample.
Preparation of tumor slices and multiphoton imaging
Tumor slices were embedded in 5% low-gelling-temperature agarose (type VII-A; Sigma-Aldrich) prepared in PBS. 500 μm slices were cut with a vibratome (VT 1000S; Leica) before imaging. Imaging derived from the second harmonic generation signals were conducted using a LaVision TriM Scope II microscope (LaVision BioTec) equipped with a 20x 1.4 NA WI objective lens and a Coherent Chameleon pulsed infrared laser (Ti:Sa and OPO). 800 nm and 1100 nm excitation wavelength were set respectively for the Ti:Sa and OPO. Images were acquired using a 2 μm z-step size with a z-depth from 250 to 500 μm. Images were subsequently analyzed using Imaris analysis software (Bitplane).
Quantitative RT-PCR (qRT-PCR)
Total RNA was extracted from homogenized tumors using TRIZOL® reagent (Invitrogen) and the RNeasy® mini kit (Qiagen). First strand cDNA was synthesized using iScript™ Reverse Transcription Supermix for qRT-PCR (Biorad). Real-time PCRs were performed using iTaqTM SYBR® Green supermix with ROX (Biorad) on a MX300P Real-Time PCR System (Stratagene). Expression levels of genes of interest were normalized to the expression level of GAPDH. The following primers were used: CD3 forward, 5′- ATATCTCATTGCGGGACAGG-3′, and reverse, 5′-TCTGGGTGCTGGATAGAAGG-3′; CD4 forward, 5′ GCGAGAGTTCCC AGAAGAAG-3′, and reverse, 5′-AAACGATCAAACTGCGAAGG-3′; CD8 forward, 5′-TGCCAGTCCTTCAGAAAGTG-3′, and reverse, 5′-TTCGGCTCCTGTGGTAGC-3′; CXCL9 Forward, 5′ – TCC TCT TGG GCA TCA TCT TC – 3′ and Reverse: 5′ – AGT CCG GAT CTA GGC AGG TT – 3′; CXCL10 forward, 5′-CTCATCCTG CTGGGTCTGAG -3′, reverse, 5′-GTGGCAATGATCTCAACA CG -3′; FOXP3 forward, 5′-CACCTGGAAGAATGCCATC-3′, reverse, 5′-AGG GATTGGAGC ACTTGTTG-3′; GATA-3 forward, 5′-GATGTAAGTCGAGGCCCAAG-3′, reverse, 5′-AGGCATTGCAAAGGTAGTGC-3′; IFN-γ forward, 5′-GCCAAGTTT GAGGTCAACAAC -3′, reverse, 5′-CGAATCAGCAGCGACTCC-3′; IL-17A forward, 5′-GGACTCTCCACCGCAATG-3′, reverse, 5′-TCAGGACCAGGATCTCTTGC-3′; T-bet/Tbx21 forward, 5′-GGTGTCTGGGAAGCTGAGAG-3′, reverse, 5′-TGAAGGACAGGAATGGGAAC-3′; and GAPDH forward 5′-GACGGCCGCATCTTCTTGTG-3′, reverse, 5′-CTTCCCATTCTCGGCCTTGACTGT-3′.
CXCL9 and CXCL10 ELISA
Transplanted tumors were homogenized in RIPA lysis buffer (Sigma Chemicals) containing a protease inhibitor cocktail. Supernatants from the homogenates were assessed using commercial murine CXCL9 and CXCL10 ELISA kits (R&D Systems) as per manufacturer's protocols.
Statistical analysis
Statistical analysis was performed with Prism 5 (Graph-Pad Software, Inc.). Statistical significance was determined using the paired or unpaired two-tailed Student's t-test. Whenever more than 2 groups were compared, the one-way ANOVA test with Bonferroni's post-test was applied. For all tests, a p-value of < 0.05 was considered statistically significant.
Supplementary Material
Acknowledgements
We are grateful to members of the JPA lab for insightful discussions. We thank Dr Alain Trautmann (Institut Cochin), Dr Nadege Bercovici (Institut Cochin) and Dr Shuzhen Chong (Singapore Immunology Network) for their valuable suggestions. We thank Muhammad Irfan Khalis and Cindy Phua (Singapore Immunology Network mouse core) for mouse maintenance; Chew Weng Keong and Samantha Chew (NLG lab) for excellent technical support. We also wish to thank Dr Lucy Robinson (Insight Editing London) for editing the manuscript.
Disclosure of Potential Conflicts of Interest
No potential conflicts of interest were disclosed.
Funding
This research was funded by SIgN, A*STAR, Singapore. The authors declare that no competing financial interests or conflicts exist.
Supplemental Material
Supplemental data for this article can be accessed on the publisher's website.
Authorship
Contribution: K.W.T designed the research, performed experiments, analyzed results and wrote the manuscript; M.E, M.T, M.H and C.H prepared experimental materials and performed experiments; E.D and N.L.G contributed expertise and provided advice for experiments; J.P.A provided guidance for research and wrote the manuscript.
References
- 1. Pages F, Galon J, Dieu-Nosjean MC, Tartour E, Sautes-Fridman C, Fridman WH. Immune infiltration in human tumors: a prognostic factor that should not be ignored. Oncogene. 2010;29(8):1093-102. [DOI] [PubMed] [Google Scholar]
- 2. Galon J, Costes A, Sanchez-Cabo F, Kirilovsky A, Mlecnik B, Lagorce-Pages C, et al. Type, density, and location of immune cells within human colorectal tumors predict clinical outcome. Science. 2006;313(5795):1960-4. [DOI] [PubMed] [Google Scholar]
- 3. Sato E, Olson SH, Ahn J, Bundy B, Nishikawa H, Qian F, et al. Intraepithelial CD8 +tumor-infiltrating lymphocytes and a high CD8+/regulatory T cell ratio are associated with favorable prognosis in ovarian cancer. Proc Natl Acad Sci U S A. 2005;102(51):18538-43. [DOI] [PMC free article] [PubMed] [Google Scholar]
- 4. Erdag G, Schaefer JT, Smolkin ME, Deacon DH, Shea SM, Dengel LT, et al. Immunotype and immunohistologic characteristics of tumor-infiltrating immune cells are associated with clinical outcome in metastatic melanoma. Cancer Res. 2012;72(5):1070-80. [DOI] [PMC free article] [PubMed] [Google Scholar]
- 5. Clemente CG, Mihm MC, Jr., Bufalino R, Zurrida S, Collini P, Cascinelli N. Prognostic value of tumor infiltrating lymphocytes in the vertical growth phase of primary cutaneous melanoma. Cancer. 1996;77(7):1303-10. [DOI] [PubMed] [Google Scholar]
- 6. Zitvogel L, Tesniere A, Kroemer G. Cancer despite immunosurveillance: immunoselection and immunosubversion. Nat Rev Immunol. 2006;6(10):715-27. [DOI] [PubMed] [Google Scholar]
- 7. Gajewski TF, Woo SR, Zha Y, Spaapen R, Zheng Y, Corrales L, et al. Cancer immunotherapy strategies based on overcoming barriers within the tumor microenvironment. Curr Opin Immunol. 2013;25(2):268-76. [DOI] [PubMed] [Google Scholar]
- 8. Harlin H, Meng Y, Peterson AC, Zha Y, Tretiakova M, Slingluff C, et al. Chemokine expression in melanoma metastases associated with CD8+ T-cell recruitment. Cancer Res. 2009;69(7):3077-85. [DOI] [PMC free article] [PubMed] [Google Scholar]
- 9. Hong M, Puaux AL, Huang C, Loumagne L, Tow C, Mackay C, et al. Chemotherapy induces intratumoral expression of chemokines in cutaneous melanoma, favoring T-cell infiltration and tumor control. Cancer Res. 2011;71(22):6997-7009. [DOI] [PubMed] [Google Scholar]
- 10. Abastado JP. The next challenge in cancer immunotherapy: controlling T-cell traffic to the tumor. Cancer Res. 2012;72(9):2159-61. [DOI] [PubMed] [Google Scholar]
- 11. Bissell MJ, Radisky D. Putting tumors in context. Nat Rev Cancer. 2001;1(1):46-54. [DOI] [PMC free article] [PubMed] [Google Scholar]
- 12. Egeblad M, Nakasone ES, Werb Z. Tumors as organs: complex tissues that interface with the entire organism. Dev Cell. 2010;18(6):884-901. [DOI] [PMC free article] [PubMed] [Google Scholar]
- 13. Iwamoto T, Takahashi M, Ito M, Hamatani K, Ohbayashi M, Wajjwalku W, et al. Aberrant melanogenesis and melanocytic tumor development in transgenic mice that carry a metallothionein/ret fusion gene. EMBO J. 1991;10(11):3167-75. [DOI] [PMC free article] [PubMed] [Google Scholar]
- 14. Lengagne R, Graff-Dubois S, Garcette M, Renia L, Kato M, Guillet JG, et al. Distinct role for CD8 T cells toward cutaneous tumors and visceral metastases. J Immunol. 2008;180(1):130-7. [DOI] [PubMed] [Google Scholar]
- 15. Galluzzi L, Senovilla L, Zitvogel L, Kroemer G. The secret ally: immunostimulation by anticancer drugs. Nat Rev Drug Discov. 2012;11(3):215-33. [DOI] [PubMed] [Google Scholar]
- 16. Nestle FO, Alijagic S, Gilliet M, Sun Y, Grabbe S, Dummer R, et al. Vaccination of melanoma patients with peptide- or tumor lysate-pulsed dendritic cells. Nat Med. 1998;4(3):328-32. [DOI] [PubMed] [Google Scholar]
- 17. Schwaab T, Heaney JA, Schned AR, Harris RD, Cole BF, Noelle RJ, et al. A randomized phase II trial comparing two different sequence combinations of autologous vaccine and human recombinant interferon gamma and human recombinant interferon alpha2B therapy in patients with metastatic renal cell carcinoma: clinical outcome and analysis of immunological parameters. J Urol. 2000;163(4):1322-7. [DOI] [PubMed] [Google Scholar]
- 18. Lowes MA, Bishop GA, Crotty K, Barnetson RS, Halliday GM. T helper 1 cytokine mRNA is increased in spontaneously regressing primary melanomas. J Invest Dermatol. 1997;108(6):914-9. [DOI] [PubMed] [Google Scholar]
- 19. Wittke F, Hoffmann R, Buer J, Dallmann I, Oevermann K, Sel S, et al. Interleukin 10 (IL-10): an immunosuppressive factor and independent predictor in patients with metastatic renal cell carcinoma. Br J Cancer. 1999;79(7-8):1182-4. [DOI] [PMC free article] [PubMed] [Google Scholar]
- 20. Whiteside TL, Schuler P, Schilling B. Induced and natural regulatory T cells in human cancer. Expert Opin Biol Ther. 2012;12(10):1383-97. [DOI] [PMC free article] [PubMed] [Google Scholar]
- 21. Murugaiyan G, Saha B. Protumor vs antitumor functions of IL-17. J Immunol. 2009;183(7):4169-75. [DOI] [PubMed] [Google Scholar]
- 22. Roskams T, De Vos R, David G, Van Damme B, Desmet V. Heparan sulphate proteoglycan expression in human primary liver tumors. J Pathol. 1998;185(3): 290-7. [DOI] [PubMed] [Google Scholar]
- 23. Mishra M, Chandavarkar V, Naik VV, Kale AD. An immunohistochemical study of basement membrane heparan sulfate proteoglycan (perlecan) in oral epithelial dysplasia and squamous cell carcinoma. J Oral Maxillofac Pathol. 2013;17(1):31-5. [DOI] [PMC free article] [PubMed] [Google Scholar]
- 24. Sabit H, Tsuneyama K, Shimonishi T, Harada K, Cheng J, Ida H, et al. Enhanced expression of basement-membrane-type heparan sulfate proteoglycan in tumor fibro-myxoid stroma of intrahepatic cholangiocarcinoma. Pathol Int. 2001;51(4):248-56. [DOI] [PubMed] [Google Scholar]
- 25. Luster AD, Greenberg SM, Leder P. The IP-10 chemokine binds to a specific cell surface heparan sulfate site shared with platelet factor 4 and inhibits endothelial cell proliferation. J Exp Med. 1995;182(1):219-31. [DOI] [PMC free article] [PubMed] [Google Scholar]
- 26. Bao X, Moseman EA, Saito H, Petryniak B, Thiriot A, Hatakeyama S, et al. Endothelial heparan sulfate controls chemokine presentation in recruitment of lymphocytes and dendritic cells to lymph nodes. Immunity. 2010;33(5):817-29. [DOI] [PMC free article] [PubMed] [Google Scholar]
- 27. Mrass P, Takano H, Ng LG, Daxini S, Lasaro MO, Iparraguirre A, et al. Random migration precedes stable target cell interactions of tumor-infiltrating T cells. J Exp Med. 2006;203(12):2749-61. [DOI] [PMC free article] [PubMed] [Google Scholar]
- 28. Boissonnas A, Fetler L, Zeelenberg IS, Hugues S, Amigorena S. In vivo imaging of cytotoxic T cell infiltration and elimination of a solid tumor. J Exp Med. 2007;204(2):345-56. [DOI] [PMC free article] [PubMed] [Google Scholar]
- 29. Salmon H, Franciszkiewicz K, Damotte D, Dieu-Nosjean MC, Validire P, Trautmann A, et al. Matrix architecture defines the preferential localization and migration of T cells into the stroma of human lung tumors. J Clin Invest. 2012;122(3):899-910. [DOI] [PMC free article] [PubMed] [Google Scholar]
- 30. Matheu MP, Beeton C, Garcia A, Chi V, Rangaraju S, Safrina O, et al. Imaging of effector memory T cells during a delayed-type hypersensitivity reaction and suppression by Kv1.3 channel block. Immunity. 2008;29(4):602-14. [DOI] [PMC free article] [PubMed] [Google Scholar]
- 31. Overstreet MG, Gaylo A, Angermann BR, Hughson A, Hyun YM, Lambert K, et al. Inflammation-induced interstitial migration of effector CD4(+) T cells is dependent on integrin alphaV. Nat Immunol. 2013;14(9):949-58. [DOI] [PMC free article] [PubMed] [Google Scholar]
- 32. Erez N, Truitt M, Olson P, Arron ST, Hanahan D. Cancer-Associated Fibroblasts Are Activated in Incipient Neoplasia to Orchestrate Tumor-Promoting Inflammation in an NF-kappaB-Dependent Manner. Cancer Cell. 2010;17(2):135-47. [DOI] [PubMed] [Google Scholar]
- 33. Sung JH, Zhang H, Moseman EA, Alvarez D, Iannacone M, Henrickson SE, et al. Chemokine guidance of central memory T cells is critical for antiviral recall responses in lymph nodes. Cell. 2012;150(6):1249-63. [DOI] [PMC free article] [PubMed] [Google Scholar]
- 34. Loeffler M, Kruger JA, Niethammer AG, Reisfeld RA. Targeting tumor-associated fibroblasts improves cancer chemotherapy by increasing intratumoral drug uptake. J Clin Invest. 2006;116(7):1955-62. [DOI] [PMC free article] [PubMed] [Google Scholar]
- 35. Santos AM, Jung J, Aziz N, Kissil JL, Pure E. Targeting fibroblast activation protein inhibits tumor stromagenesis and growth in mice. J Clin Invest. 2009;119(12):3613-25. [DOI] [PMC free article] [PubMed] [Google Scholar]
- 36. Kraman M, Bambrough PJ, Arnold JN, Roberts EW, Magiera L, Jones JO, et al. Suppression of antitumor immunity by stromal cells expressing fibroblast activation protein-alpha. Science. 2010;330(6005):827-30. [DOI] [PubMed] [Google Scholar]
- 37. Provenzano PP, Cuevas C, Chang AE, Goel VK, Von Hoff DD, Hingorani SR. Enzymatic targeting of the stroma ablates physical barriers to treatment of pancreatic ductal adenocarcinoma. Cancer Cell. 2012;21(3):418-29. [DOI] [PMC free article] [PubMed] [Google Scholar]
- 38. Olive KP, Jacobetz MA, Davidson CJ, Gopinathan A, McIntyre D, Honess D, et al. Inhibition of Hedgehog signaling enhances delivery of chemotherapy in a mouse model of pancreatic cancer. Science. 2009;324(5933):1457-61. [DOI] [PMC free article] [PubMed] [Google Scholar]
- 39. Lengagne R, Le Gal FA, Garcette M, Fiette L, Ave P, Kato M, et al. Spontaneous vitiligo in an animal model for human melanoma: role of tumor-specific CD8+ T cells. Cancer Res. 2004;64(4):1496-501. [DOI] [PubMed] [Google Scholar]
Associated Data
This section collects any data citations, data availability statements, or supplementary materials included in this article.


