Dear Editor,
The classical log-linear relationship between thyroid-stimulating hormone (TSH) and free thyroxine (FT4) generally reflects on the reasonable correlation between both hormones, while particularly emphasizing that small changes in FT4 are accompanied by larger changes in TSH [1]. Recently, refining this relationship in cross-sectional data has received new interest [2,3,4]. Different from the classical monotonous relationship over the whole thyroid function range, the referred authors propose three different relationships in the hypo-, eu-, and hyperthyroid range. While they use different mathematical models to describe the relationships, they have in common that they work with functions that interconnect at the transition from the hypo-/euthyroid and eu-/hyperthyroid states. Although the real clinical relevance of knowing the exact mathematical relationship may be debated, it cannot be denied that the relation between TSH and FT4 is discussed in view of more precisely defining the subclinical state of thyroid dysfunction, and/or even brought up by some scientists as evaluation criterion for the validity of a FT4 assay [2,5].
Here we take a fresh look at the TSH/FT4 relationship, based on previously described data [1]. They were from 8,152 unselected patients (median age: 61 years, range: 18-100) from the Department of Endocrinology or Nuclear Medicine of the Klinikum Lüdenscheid in Germany, who presented with various thyroid disorders. Data from pregnant women and patients with pituitary or hypothalamic disorders were excluded, as well as from patients with conditions that potentially interfere with thyroid testing. Note that corresponding to the limits of the Abbott enzyme immunoassay, which was used for measuring both TSH and FT4, the TSH data are truncated at 0.001 and 100 mIU/l, respectively. Regression and correlation results were calculated by Microsoft Excel 2010.
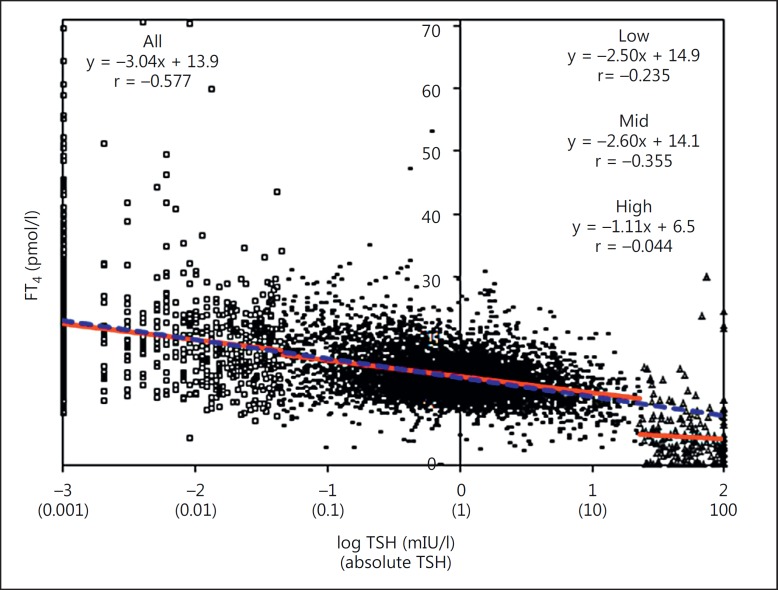
Different from current practice, we plotted log TSH on the x-axis and FT4 on the y-axis (fig. 1). We did not define upfront the different concentration categories because we preferred to inspect the correlation of the complete dataset without any prejudice. Visual inspection of the plot reveals three clusters of TSH values from 0.001 to <0.045 mIU/l (‘low’), 0.045 to <23 mIU/l (‘mid’), and 23 to 100 mIU/l (‘high’). Instead of a continuum, a clear break in the TSH/FT4 relationship for the high-TSH data group can be seen. This is also reflected in the partial regression equations (y = −2.50x + 14.9, ‘low’; y = −2.60x + 14.1, ‘mid’; y = −1.11x + 6.5, ‘high’). The regression equation over the whole range (y = −3.04x + 13.9, ‘all’) is similar to the low- and mid-range data. The correlation data, in our opinion, are misleading and are mainly influenced by the TSH range (note: correlation over the whole range is r = −0.577, while it is r = −0.044 in the high range). Although the precision and accuracy of the FT4 measurement results in the low concentration range might be jeopardized by the limit of quantitation of the used assay, we consider that the effect of increased random error would result in a higher scatter around the line representing the TSH/FT4 relationship, though without affecting the regression coefficients. Regarding the inaccuracy of measurement, we know from a previous study that most FT4 assays tend to have a positive calibration bias in the low concentration range versus a significantly negative one in the mid- to high-concentration range [6]. This allows us to infer that after correction of this bias, the break in the TSH/FT4 relationship would become even more obvious.
Fig. 1.
log TSH is plotted on the x-axis and FT4 on the y-axis. This reveals three clusters depending on the TSH-concentration: ◻: ‘low’, –: ‘mid’, and Δ: ‘high’. The blue line is the linear regression line for the complete concentration range; the red lines are the linear regression lines for the different clusters. A clear break with little correlation in the TSH/FT4 relationship for the ‘high’-trophic hormone data group can be seen.
Our ‘fresh’ presentation of TSH/FT4 data suggests that the log-linear relationship between both hormones holds also in cross-sectional data up to TSH concentrations of ∼23 mIU/l (FT4 of ∼10 pmol/l; note: the actual values will depend on the assays used). However, from this concentration on, there is a clear ‘break’ in the relationship with little correlation between TSH and FT4. Consequently, curve fittings for the TSH/FT4 relationship in both ranges should not be interconnected.
Disclosure Statement
The authors have nothing to disclose.
Acknowledgements
We thank Professors Rudolf Hoermann and Rolf Larisch (Klinikum Lüdenscheid) for the provision of the raw data. We thank Dr. Dietmar Stöckl (STT Consulting) for helpful discussions and advice in statistics.
References
- 1.Demers LM, Spencer CA. Washington: National Academy of Clinical Biochemistry (NACB); 2002. Laboratory Medicine Practice Guidelines: Laboratory Support for the Diagnosis and Monitoring of Thyroid Disease. [DOI] [PubMed] [Google Scholar]
- 2.Hoermann R, Eckl W, Hoermann C, Larisch R. Complex relationship between free thyroxine and TSH in the regulation of thyroid function. Eur J Endocrinol. 2010;162:1123–1129. doi: 10.1530/EJE-10-0106. [DOI] [PubMed] [Google Scholar]
- 3.Clark PM, Holder RL, Haque SM, Hobbs FD, Roberts LM, Franklyn JA. The relationship between serum TSH and free T4 in older people. J Clin Pathol. 2012;65:463–465. doi: 10.1136/jclinpath-2011-200433. [DOI] [PubMed] [Google Scholar]
- 4.Hadlow NC, Rothacker KM, Wardrop R, Brown SJ, Lim EM, Walsh JP. The relationship between TSH and free T4 in a large population is complex and nonlinear and differs by age and sex. J Clin Endocrinol Metab. 2013;98:2936–2943. doi: 10.1210/jc.2012-4223. [DOI] [PubMed] [Google Scholar]
- 5.Jonklaas J, Kahric-Janicic N, Soldin OP, Soldin SJ. Correlations of free thyroid hormones measured by tandem mass spectrometry and immunoassay with thyroid-stimulating hormone across 4 patient populations. Clin Chem. 2009;55:1380–1388. doi: 10.1373/clinchem.2008.118752. [DOI] [PMC free article] [PubMed] [Google Scholar]
- 6.Thienpont LM, Van Uytfanghe K, Van Houcke S, Das B, Faix JD, MacKenzie F, Quinn FA, Rottmann M, Van den Bruel A. IFCC Committee for Standardization of Thyroid Function Tests (C-STFT): A progress report of the IFCC Committee for standardization of thyroid function tests. Eur Thyroid J. 2014;3:109–116. doi: 10.1159/000358270. [DOI] [PMC free article] [PubMed] [Google Scholar]


