

Abstract
Objectives
The Alzheimer's Disease Neuroimaging Initiative 3.0T MRI image acquisition scheme changed between the original ADNI-1 grant and the two subsequent grants (ADNI-GO and ADNI-2). The aim of the current study was to investigate the compatibility of the 3.0T ADNI-1 and ADNI-2 T1-weighted volumes using voxel-based morphometry (VBM).
Methods
T1-weighted images of 30 subjects were acquired using a 3T GE Signa HDx using the ADNI-1 and ADNI-2 T1-weighted volume sequences. Images were pre-processed and analysed using SPM8. Global grey matter (GM), white matter (WM) and cerebrospinal fluid (CSF) volumes were compared, as well as voxel-by-voxel differences in GM and WM.
Results
Correlation coefficients and percentage differences for each tissue type between ADNI-1 and ADNI-2 were as follows: ((GM: intraclass correlation coefficient (ICC) = 0.86, ADNI-1 3.09% < ADNI-2) (WM: ICC = 0.91, ADNI-1 2.92% > ADNI-2) (CSF: ICC = 0.90, ADNI-1 1.94% > ADNI-2)). For ADNI-2, widespread increases in GM were found relative to ADNI-1 (cerebellum and pre-central gyrus), with localised decreases along the midline and temporal lobes. For ADNI-1, widespread increases in WM were found relative to ADNI-2 (cerebellum and pre-central gyrus), together with localised decreases in the temporal gyrus.
Conclusions
The widespread increase in GM and localised decrease in WM in ADNI-2 compared to ADNI-1 images suggests that the image acquisition protocols are not directly comparable using SPM-8. Total volumes of GM, WM and CSF also differed between the protocols in the following order of magnitude: GM > WM > CSF. This has implications for studies aiming to analyse images acquired using the ADNI-1 and ADNI-2 protocols under VBM. © 2014 The Authors. International Journal of Geriatric Psychiatry published by John Wiley & Sons Ltd.
Keywords: ADNI-1, ADNI-2, MRI, grey matter (GM), white matter (WM), cerebral spinal fluid (CSF)
Introduction
Beginning in 2004, the first Alzheimer's Disease Neuroimaging Initiative (ADNI) project (ADNI-1) was a 5-year longitudinal multi-centre project designed to combine the use of magnetic resonance imaging (MRI) with PET, biological markers and clinical neuropsychological assessments in order to develop techniques that measure the progression of normal aging, mild cognitive impairment (MCI) and Alzheimer's disease (AD). One of the primary goals of ADNI was to optimise the methods of MRI acquisition in order to ensure the standards of acquiring data were uniform over-time and across sites. As a result, ADNI-1 used a customised 3.0T MP-RAGE pulse sequence that would be compatible between ADNI sites that use differing MRI systems.
Since the start of the original ADNI grant (ADNI-1), there have been two further phases (ADNI-GO and ADNI-2) of the study designed to extend MRI, bio-marker and clinical data to include additional time-points and introduce a new cohort of early MCI subjects. ADNI-2 started in 2011 and used a modified set of protocols that were designed to support systems that have since been upgraded and to solve problems of variability and improve reliability and efficiency from the original ADNI-1 sequences whilst maintaining the essential requirement of compatibility. As with the ADNI-1 acquisition parameters, the ADNI-2 sequences were also designed to be used by non-ADNI studies.
Variation in image quality that may arise from differing pulse sequences, scanner manufacturer, scanner upgrades and field strength in large multi-centre studies such as ADNI is important to understand when reproducibility and consistency are essential to its success. Previous studies have evaluated the effect of such parameters and shown that both scanner manufacturer and pulse sequence impact on the reproducibility of volumetric measures (Han et al., 2006; Kempton et al., 2011). More specifically, Han et al. (2006) found that different pulse sequences had the largest effect on measurement reproducibility in downstream segmentation processing of MR images. Variations of flip angle, TE and TR times have also been shown to be critical in determining image quality with respect to image signal, homogeneity and artefacts (Li and Mirowitz, 2004), which have been shown to impact on segmentation using cluster based classification techniques (Simmons et al., 1996). It has been hypothesised that different pulse sequences cause disparity in noise sensitivity that then impacts on brain segmentation causing variation in the inter-subject estimation of grey matter (GM) and white matter (WM) volume (Clark et al., 2006).
One of the most common automated brain segmentation techniques for analysing high-resolution structural MR images is voxel-based morphometry (VBM). VBM is an automated technique that spatially normalises, segments and smoothes MR images before performing voxel-wise statistical tests that examine differences in brain anatomy between groups (Ashburner and Friston, 2000; Whitwell, 2009). VBM relies on high resolution 3D T1-weighted images that are sensitive enough to assess differences in GM, WM and cerebrospinal fluid (CSF). It was therefore a further aim of ADNI to design pulse sequences that provide images that were consistent over-time, across sites and using different scanners whilst being sensitive enough to differentiate subject groups in studies that utilise morphometric analysis.
The aim of the current study was to investigate the compatibility of the 3.0T ADNI-1 and ADNI-2 T1-w volumes using VBM. Voxel-wise whole-brain comparisons were made in order to determine the anatomical location of differences in GM, WM and CSF between the two ADNI pulse sequences. Volumetric and reproducibility measures of GM, WM and CSF were also obtained in order to quantify differences in tissue classification and to assess the consistency of each ADNI sequence.
Method
Participants
MRI data from 30 young healthy subjects was obtained (Male = 15, mean age 32.2 (SD = 4.9); Female = 15, mean age 25.1 (SD = 3.6)). 3.0T T1-weighted data for the ADNI-1 and ADNI-2 pulse sequences was acquired for each subject in a single scanning session. The acquisition order for each sequence was randomised in order to limit any possible systematic effect, such as the degree of subject movement.
Data acquisition
High-resolution 3D T1-weighted MR images were acquired on a 3.0T GE scanner using the ADNI-1 (8-channel coil, TR = 650 ms, TE = min full, flip-angle = 8°, slice thickness = 1.2 mm, resolution = 256 × 256 mm and FOV = 26 cm) and ADNI-2 (8-channel coil, TR = 400 ms, TE = min full, flip-angle = 11°, slice thickness = 1.2 mm, resolution = 256 × 256 mm and FOV = 26 cm). Both ADNI-1 and ADNI-2 MRI data were acquired in the sagittal plane using an IR-FSPGR pulse sequence.
Image pre-processing
Data analysis was performed using a unified method of VBM under statistical parametric mapping software version 8 (SPM-8). Initially, T1-weighted images for each subject were manually oriented to place the anterior commissure and posterior commissure in alignment with the Montreal Neurologic Institute (MNI) co-ordinate system. Images were then normalised into standard anatomic space using a linear 12-parameter affine transformation with the SPM-8 default MNI template as reference. An integrated modulation step was applied in conjunction with the normalisation procedure in order to correct for any expansions/contractions in brain size, and to preserve GM and WM volumes in each voxel. Normalised images were then segmented into GM, WM and CSF using a mixed-model cluster analysis technique that uses prior probability maps to classify tissue types within each voxel. Segmented images were then smoothed with an 8mm full width at half maximum isotropic Gaussian kernel in order to reduce differences caused by variations in individual grey and white matter and CSF structure. Finally, all images were visually inspected for registration errors.
Statistical analysis
Voxel-wise between-group statistical comparisons were performed on smoothed grey and white matter and CSF images using the general linear model based on random Gaussian field theory (Friston et al., 1995). Standard parametric statistical paired t-tests (p < 0.05) that were corrected for multiple comparisons using the family wise error (FWE) statistical threshold were then used to investigate differences in whole-brain grey and white matter and CSF between the ADNI-1 and ADNI-2 pulse sequences. Significant regional differences between groups were displayed using a standard T1-weighted canonical overlay.
Volumetric analysis was performed using SPSS for windows (v20). Initially, paired t-tests were used to assess volumetric differences between pulse sequences.
Results
Global voxel-wise differences in volumetric tissue between the ADNI-1 and ADNI-2 pulse sequences were performed using a paired t-test (p = 0.05), using the FWE correction. Significant clusters for each comparison are presented here using coloured canonical overlays and glass brains.
Grey matter
ADNI-1 > ADNI-2
Details of the peak cluster locations, cluster size, Z-score, co-ordinates and statistical significance values for GM regions that were increased in the ADNI-1 compared to ADNI-2 pulse sequence are shown in Table 1.
Table 1.
Regions of increased and decreased GM in the ADNI-1 compared to ADNI-2 pulse sequence
| Region | k | Z-score | x | y | z | Statistic | |
|---|---|---|---|---|---|---|---|
| Increased GM | |||||||
| Right temporal inferior lobe | 227 | 10.03 | 64 | −16 | −34 | P < 0.001 | |
| Right frontal lobe | 67 | 8.65 | 10 | 16 | −28 | P < 0.001 | |
| Right medial frontal gyrus | 187 | 8.18 | 2 | 46 | 26 | P < 0.001 | |
| Left supplementary motor area | 103 | 7.78 | 0 | −36 | 62 | P = 0.01 | |
| Left parietal lobe, postcentral gyrus | 176 | 7.76 | −2 | −46 | 76 | P = 0.01 | |
| Left inferior temporal lobe | 153 | 7.54 | −64 | −36 | −28 | P = 0.01 | |
| Left frontal lobe, paracentral lobule | 16 | 6.38 | 34 | −36 | 62 | P = 0.01 | |
| Left frontal lobe, middle frontal gyrus | 14 | 6.10 | −26 | −2 | 56 | P = 0.02 | |
| Right frontal lobe, superior frontal gyrus | 16 | 6.01 | 2 | 28 | 48 | P = 0.03 | |
| Left cuneus | 6 | 5.99 | 2 | −88 | 30 | P = 0.03 | |
| Right frontal lobe, superior frontal gyrus | 1 | 5.79 | 2 | 16 | 58 | P = 0.05 | |
| Decreased GM | |||||||
| Right cerebellum posterior lobe, tuber | 44 701 | 16.63 | 38 | −64 | −38 | P < 0.001 | |
| Right frontal lobe, precentral gyrus | 116 | 8.88 | 12 | −24 | 70 | P < 0.001 | |
| Left parietal lobe, postcentral gyrus | 121 | 8.68 | −62 | −10 | 16 | P < 0.001 | |
| Right parietal lobe, postcentral gyrus | 143 | 8.58 | 62 | −6 | 18 | P < 0.001 | |
| Right frontal lobe, orbital gyrus | 155 | 8.56 | 4 | 38 | −34 | P < 0.001 | |
| Right frontal lobe, sub-gyral | 428 | 8.50 | 14 | −16 | 48 | P < 0.001 | |
| Left occipital lobe, cuneus | 111 | 7.60 | −8 | −104 | −6 | P = 0.001 | |
| Left limbic lobe, cingulate gyrus | 132 | 7.60 | −8 | −20 | 32 | P = 0.001 | |
| Left limbic lobe, anterior cingulate | 357 | 7.25 | −10 | 32 | −6 | P = 0.002 | |
| Left frontal lobe, superior frontal gyrus | 105 | 7.22 | −26 | 48 | 44 | P = 0.002 | |
| Right frontal lobe, cingulate gyrus | 9 | 6.57 | 12 | 24 | 40 | P = 0.01 | |
| Right frontal lobe, middle frontal gyrus | 14 | 6.48 | 32 | 18 | 34 | P = 0.01 | |
| Right parietal lobe | 8 | 6.27 | 62 | −54 | 42 | P = 0.02 | |
| Right limbic lobe, cingulate gyrus | 7 | 6.22 | 14 | 12 | 44 | P = 0.02 | |
| Right cerebellum posterior lobe | 10 | 6.10 | 2 | −60 | −18 | P = 0.02 | |
| Right frontal lobe, middle frontal gyrus | 4 | 6.08 | 58 | 30 | 26 | P = 0.02 | |
| Right frontal lobe, middle frontal gyrus | 9 | 6.04 | 52 | 38 | 30 | P = 0.03 | |
| Left frontal lobe, medial frontal gyrus | 4 | 5.99 | −14 | 40 | 20 | P = 0.03 | |
| Right middle frontal gyrus | 2 | 5.98 | 52 | 24 | 44 | P = 0.03 | |
| Right frontal lobe, inferior frontal gyrus | 3 | 5.98 | 6− | 12 | 38 | P = 0.03 | |
| Left frontal lobe, middle frontal gyrus | 5 | 5.89 | −34 | 16 | 34 | P = 0.04 | |
| Right limbic lobe, anterior cingulate | 2 | 5.88 | 10 | 34 | 8 | P = 0.04 | |
| Right frontal lobe, medial frontal gyrus | 4 | 5.86 | 18 | 48 | 8 | P = 0.04 | |
| Left parietal lobe, inferior parietal lobule | 2 | 5.81 | −58 | −28 | 28 | P = 0.04 | |
| Right frontal lobe, superior frontal gyrus | 1 | 5.74 | 26 | 46 | 48 | P = 0.05 | |
Co-ordinates are shown as MNI space. k: cluster size. Thresholding was performed at p = 0.05 (FWE correction).
Significant clusters of increased GM are displayed here using a glass brain and canonical overlay (Figure1). There were significant localised increases in GM in the ADNI-1 compared to ADNI-2 sequence in the left and right Temporal lobes extending caudally to the Inferior Temporal Gyrus in the left hemisphere and Fusiform Gyrus and Temporal Gyrus in the right hemisphere. A small cluster of significant GM reduction was observed predominantly in the right, but also in the left Frontal Lobes, incorporating the Rectal Gyrus and Orbital Gyrus. The remaining differences in GM between the ADNI pulse sequences was observed along the midline, extending from the Medial Frontal Gyrus (including left and right Anterior Cingulate), through to the left and right Superior Motor Area, and finishing in regions of the Parietal Lobe (left and right Precuneus, left and right Paracentral Lobule, Pre-central Gyrus and Medial Frontal Gyrus).
Figure 1.
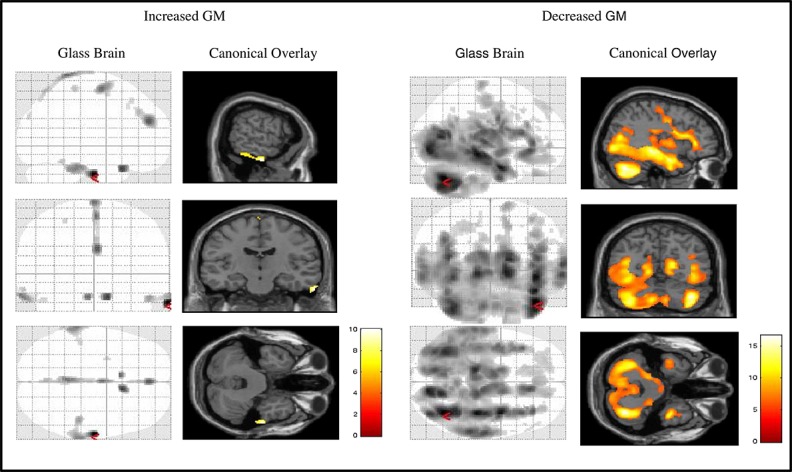
Glass brain and T1 canonical overlay showing significant regions of increased and decreased GM in the ADNI-1 compared to ADNI-2 pulse sequence.
ADNI-1 < ADNI-2
Details of the peak cluster locations, cluster size, Z-score, co-ordinates and statistical significance values for GM regions that were reduced in the ADNI-1 compared to ADNI-2 pulse sequence are shown in Table 1.
Significant clusters of reduced GM are displayed here using a glass brain and T1 canonical overlay (Figure1). We observed widespread reductions in GM in the ADNI-1 compared to ADNI-2 pulse sequence that was predominantly associated with regions of the left, and, most notably, right cerebellum. Significant regions associated with the peak Cerebellar structure extended to include the temporal lobe (middle temporal gyrus and superior temporal gyrus), occipital lobe, limbic lobe (parahippocampal gyrus), thalamus, insula, cuneus, middle occipital lobe, posterior cingulate, left brainstem, amygdala, posterior cingulum, rectal gyrus, putamen, orbital gyrus and angular gyrus. Smaller significant clusters were also observed in the right frontal lobe (pre-central gyrus, para-central lobule, supplementary motor area, medial frontal gyrus, superior frontal gyrus, orbital gyrus and rectal gyrus). Additional regions of decreased GM included the left parietal lobe (post-central gyrus, pre-central gyrus) and right parietal lobe (post-central gyrus and pre-central gyrus), and frontal lobe structures comprising the right cingulate gyrus, right cingulum, supplementary motor area, medial frontal gyrus and paracentral lobule. Lower localised peak level regions were found in left occipital lobe (cuneus, middle and supplementary occipital lobe and lingual gyrus), left limbic lobe (anterior cingulate, anterior cingulum, superior frontal gyrus, medial frontal gyrus, subcallosal gyrus and inferior frontal gyrus) and left frontal lobe (superior frontal gyrus).
White matter
ADNI-1 > ADNI-2
Details of the peak cluster locations, cluster size, Z-score, co-ordinates and statistical significance values for WM regions that were increased in the ADNI-1 compared to ADNI-2 pulse sequence are shown in Table 2.
Table 2.
Regions of increased WM in the ADNI-1 compared to ADNI-2 pulse sequence
| Region | k | Z-score | x | y | z | Statistic | |
|---|---|---|---|---|---|---|---|
| Increased WM | |||||||
| Right frontal lobe, precentral gyrus | 36 277 | 20.38 | 38 | −18 | 52 | P < 0.001 | |
| Right cerebellum, posterior lobe | 430 | 18.50 | 38 | −52 | −42 | P < 0.001 | |
| Left temporal lobe, superior temporal gyrus | 1255 | 15.19 | −62 | −24 | 4 | P < 0.001 | |
| Left cerebellum, posterior lobe | 406 | 12.68 | −34 | −50 | −44 | P < 0.001 | |
| Right frontal lobe, superior frontal gyrus | 511 | 11.23 | 8 | 64 | −8 | P < 0.001 | |
| Left temporal lobe, superior temporal gyrus | 232 | 10.98 | −40 | −32 | 16 | P < 0.001 | |
| Right cerebrum, sub-lobar | 498 | 10.91 | 10 | −2 | −12 | P < 0.001 | |
| Left cerebrum, sub-lobar | 115 | 10.59 | −14 | 2 | −10 | P < 0.001 | |
| Left cerebrum, sub-lobar, thalamus | 279 | 10.24 | −8 | −8 | 12 | P < 0.001 | |
| Left frontal lobes, medial frontal gyrus | 142 | 9.15 | −10 | 32 | −18 | P < 0.001 | |
| Left frontal lobe, inferior frontal gyrus | 36 | 7.07 | −56 | 4 | 20 | P = 0.003 | |
| Right limbic lobe, anterior cingulate | 12 | 7.06 | 10 | 48 | 0 | P = 0.003 | |
| Right frontal lobe, medial frontal gyrus | 23 | 6.79 | 10 | 60 | 14 | P = 0.006 | |
| Right cerebellum, posterior lobe | 3 | 6.14 | 18 | −78 | −40 | P = 0.02 | |
| Right parietal lobe, precuneus | 2 | 5.93 | 14 | −56 | 46 | P = 0.04 | |
| Left temporal lobe, fusiform gyrus | 1 | 5.93 | −56 | −20 | −28 | P = 0.04 | |
| Right temporal lobes, superior temporal gyrus | 398 | 10.97 | 46 | −24 | −8 | P < 0.001 | |
| Left cerebellum, anterior lobe | 294 | 9.87 | −20 | −58 | −34 | P < 0.001 | |
| Right cerebellum, anterior lobe | 170 | 8.90 | 22 | −56 | −36 | P < 0.001 | |
| Left cerebrum, sub-lobar | 91 | 8.46 | −24 | −20 | −4 | P < 0.001 | |
| Left temporal lobe, sub-gyral | 204 | 8.02 | −46 | −46 | −4 | P < 0.001 | |
| Left temporal lobe, middle temporal gyrus | 66 | 7.54 | −48 | −10 | −16 | P = 0.001 | |
| Left brainstem, pons | 25 | 6.59 | −14 | −28 | −24 | P = 0.01 | |
| Left cerebrum, sub-lobar | 6 | 6.02 | −30 | −60 | 4 | P = 0.03 | |
| Decreased WM | |||||||
| Right temporal lobes, superior temporal gyrus | 398 | 10.97 | 46 | −24 | −8 | P < 0.001 | |
| Left cerebellum, anterior lobe | 294 | 9.87 | −20 | −58 | −34 | P < 0.001 | |
| Right cerebellum, anterior lobe | 170 | 8.90 | 22 | −56 | −36 | P < 0.001 | |
| Left cerebrum, sub-lobar | 91 | 8.46 | −24 | −20 | −4 | P < 0.001 | |
| Left temporal lobe, sub-gyral | 204 | 8.02 | −46 | −46 | −4 | P < 0.001 | |
| Left temporal lobe, middle temporal gyrus | 66 | 7.54 | −48 | −10 | −16 | P = 0.001 | |
| Left brainstem, pons | 25 | 6.59 | −14 | −28 | −24 | P = 0.01 | |
| Left cerebrum, sub-lobar | 6 | 6.02 | −30 | −60 | 4 | P = 0.03 | |
Co-ordinates are shown as MNI space. k: cluster size. Thresholding was performed at p = 0.05 (FWE correction).
Significant clusters of reduced WM are displayed here using a glass brain and canonical overlay (Figure2). We observed a widespread increase in WM in the ADNI-1 compared to ADNI-2 pulse sequence, including: frontal lobes, occipital lobes, parietal lobes and temporal lobes. The structures associated with the largest cluster were the pre-central gyrus, medial frontal gyrus, cuneus, limbic lobe, post-central gyrus, precuneus, cingulate gyrus, inferior parietal lobule, insula, posterior cingulate, fusiform gyrus, anterior cingulate and parahippoccampus. Additional localised clusters were also reported in the left and right cerebellum, originating in the cerebellar posterior lobe, extending caudally from the cerebellar tonsil to the cerebellar anterior lobe in both the left and right hemispheres. Significant clusters separate from the main grouping were also observed in the frontal lobes, incorporating the medial frontal gyrus, superior frontal gyrus, anterior cingulate, orbital gyrus and inferior frontal gyrus. A small cluster of extra-nuclear reduced WM was also shown in the lentiform nucleus, pallidum, putamen, lateral globus pallidus, midbrain and hippocampus.
Figure 2.
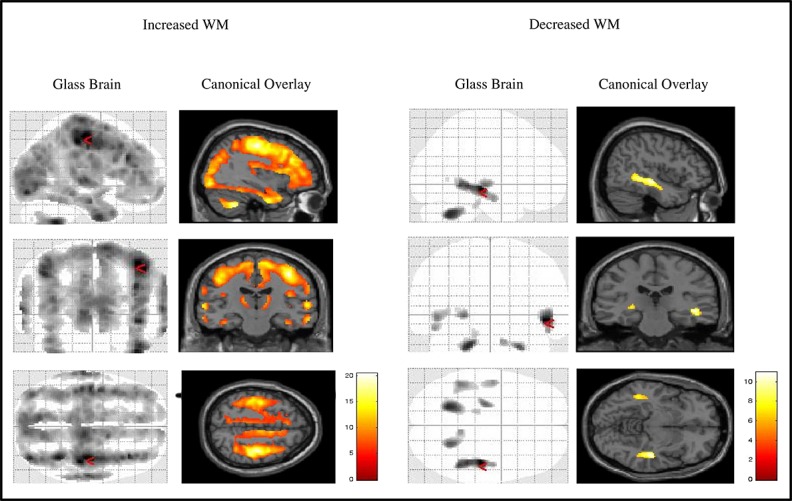
Glass brain and T1 canonical overlay showing significant regions of increased and decreased GM in the ADNI-1 compared to ADNI-2 pulse sequence.
ADNI-1 < ADNI-2
Details of the peak cluster locations, cluster size, Z-score, co-ordinates and statistical significance values for WM regions that were reduced in the ADNI-1 compared to ADNI-2 pulse sequence are shown in Table 2.
Significant clusters of reduced GM are displayed here using a glass brain and canonical overlay (Figure2). Additional WM reductions in the ADNI-1 compared to ADNI-2 sequence were found to be localised to regions of the right temporal lobe (middle temporal gyrus, middle temporal gyrus and superior temporal gyrus), and left and right cerebellum (cerebellar anterior lobe, dentate, culmen, cerebellar posterior lobe and cerebellar tonsil) and left brainstem (pons).
Volumetric analysis
Mean (SD) volumetric measures, percentage differences and significance values for ADNI-1 and ADNI-2 pulse sequences are summarised in Table 3. Classification of GM was found to be significantly greater in the ADNI-2 compared to ADNI-1 sequence (t(29) = −5.77, p < 0.001). Differences in WM between sequences were shown to be significantly reduced in ADNI-2 compared to ADNI-1 volumes (WM = t(29) = 4.37, p < 0.001). CSF volumes were also reduced in the ADNI-2 compared to ADNI-1 sequences, but results did not reach levels of significance (t(29) = 1.75, p = 0.09).
Table 3.
Mean (SD) volumetric measures, percentage differences and significance values for the ADNI-1 and ADNI-2 pulse sequences
| ADNI-1 mean (SD) | ADNI-2 mean (SD) | % difference | Significance | |
|---|---|---|---|---|
| Grey matter | 443.39 (21.0) | 457.10 (27.04) | ADNI-1 < ADNI-2 3.09% | P < 0.001 |
| White matter | 263.49 (23.86) | 256.02 (20.13) | ADNI-1 > ADNI-2 2.92% | P < 0.001 |
| Cerebrospinal fluid | 292.28 (39.67) | 286.72 (38.91) | ADNI-1 > ADNI-2 1.94% | P = 0.09 |
Volumes that differed significantly are presented as a percentage reduction/increase. GM volumetric measures were reduced in the ADNI-1 compared to ADNI-2 sequence by 3.04%. WM tissue classification was found to be reduced by 2.92% in the ADNI-2 compared to ADNI-1 sequence.
Reproducibility analysis
To assess the reproducibility of volumes acquired using each of the different methods, we used the ICC measure (single measure, two-way mixed consistency model) McGraw and Wong, 1996).
The ICC is a general measure of reliability used to assess the consistency of measures attained from multiple raters which can be used to quantify the consistency between the two ADNI volumes. ICC consistency values and test statistics are shown in Table 4. All tissue measures were highly correlated between the ADNI-1 and ADNI-1 pulse sequence, with only a small separation between them. White matter correlations were found to be the most consistent (0.91), followed by CSF (0.90) and then GM (0.86). Our results show that SPM-8 VBM classifies WM and CSF more consistently than GM.
Table 4.
ICC reproducibility measures and test statistic
| ICC | Test statistic | |
|---|---|---|
| Grey matter | 0.86 | P < 0.001 |
| White matter | 0.91 | P < 0.001 |
| Cerebrospinal fluid | 0.90 | P < 0.001 |
Discussion
The ability to reliably compare and combine large MR neuroimaging datasets is important for the discovery of novel bio-markers, clinical trial design and research on the structural changes associated with AD over-time. It is important to understand how variability in MRI data impacts on the segmentation of T1-weighted images in order to optimise the methods of image acquisition in large multi-centre studies. The best approach to integrating different neuroimaging datasets, such as ADNI, is an active area of debate and research. The aim of the current study was to investigate the compatibility of the 3.0T ADNI-1 and ADNI-2 T1-weighted volumes using VBM.
The main parameters that differed between the ADNI-1 and ADNI-2 pulse sequences were TR time and flip angle. Alterations in these parameters have previously been shown to impact on the signal to noise ratio (SNR) of T1-weighted images. Li and Mirowitz (2004) found that as the TR and flip angle increased so did the SNR and ghosting ratio. Our VBM results show that the ADNI-1 image, with reduced TR time and flip angle, showed significantly widespread reductions in GM compared to the ADNI-2 image. Only localised increases in GM were observed in the ADNI-1 compared to ADNI-2 image, which were restricted to the temporal poles and midline. Voxel-wise comparisons of WM were shown to have an opposite pattern of increased volume in the ADNI-1 compared to ADNI-2 image. Localised reductions in WM were observed in the ADNI-1 images in the temporal lobes and cerebellum. Our VBM findings suggest that the ADNI-1 and ADNI-2 image acquisition protocols are not directly comparable using SPM-8.
Total volumes of GM, WM and CSF also differed between the protocols in the following order of magnitude: GM > CSF > WM. Volumetric differences between the imaging sequences were greatest in GM, showing a reduction of 3.04% in the ADNI-1 compared to ADNI-2 sequence. The next largest difference was observed in WM with an increase in volume of 2.92% in the ADNI-1 pulse sequence. CSF volumes were also found to be increased in ADNI-2 images by 1.94%, but statistical levels of significance were not reached. The reliability of each tissue was also assessed in order to determine how closely related volumes were between the ADNI sequences. Although all tissue types were found to be highly related, WM and CSF were more comparable than GM.
Our findings show that the greatest differences in volume were observed in GM compared to WM. We also show an increased classification of GM and decrease of WM in ADNI-1 compared to ADNI-2 images. Our findings support previous work (Simmons et al., 1996; Li and Mirowitz, 2004; Clark et al., 2006; Han et al., 2006) and demonstrate how variations in pulse sequence impact on the reproducibility of volumetric analysis of GM, WM and CSF under SPM-8.
It is important to consider the magnitude of sequence-dependent differences in volume to the magnitude of group differences found, for example, when comparing Alzheimer's disease subjects and healthy controls. We observed a sequence-dependent difference of 3.09% in GM and 2.92% in WM in the current study. In previous ADNI studies using SPM, differences between healthy aged matched controls (HC) and AD subjects of 5.6% in GM and 5.7% in WM have been found (Guo et al., 2010), while Karas et al. (2004) reported differences of 6.2% in GM between AD and MCI subjects. Although the sequence-dependent volume differences are smaller than the group differences, they are large enough to potentially confound subject group difference comparisons. The impact of sequence-dependent differences would be greater when comparisons are made between groups that exhibit more subtle differences in volume, for example MCI converters and non-converters. Although not within the scope of the current study, it would also be of interest to investigate the impact of different scanners from both the same and different manufacturers on VBM and GM/WM volume measurements.
In summary, we have used VBM under SPM-8 to investigate the compatibility of the 3.0T ADNI-1 and ADNI-2 T1-weighted volumes. Voxel-wise analysis was used to determine the location of structural differences between the images, and whole-brain volumes were used to assess the magnitude of differences as well as how closely related each sequence was to the other. We have demonstrated how the ADNI-1 and ADNI-2 imaging sequences are not directly comparable using SPM-8. This has implications for studies that aim to use the two different protocols under VBM to assess differences in GM, WM and CSF.
Key points
Differences in acquisition between the ADNI-1 and ADNI-2 sequences lead to voxel-wise differences in both GM and WM using SPM-8.
Global comparisons of GM, WM and CSF volumes also reveal differences in overall tissue classification between the ADNI-1 and ADNI-2 sequences.
The magnitude of sequence dependent differences observed may be large enough to confound comparisons between subject groups.
Acknowledgments
Support for this study was provided by the NIHR Biomedical Research Centre for Mental Health and NIHR Biomedical Research Unit for Dementia at South London, Maudsley NHS Foundation Trust, Institute of Psychiatry, King's College London, Alzheimer Research UK and the IMI funded European Medical Information Framework.
Conflict of interest
None declared.
References
- Ashburner J, Friston JA. Voxel-Based Morphometry - The Methods. Neuroimage. 2000;11:805–821. doi: 10.1006/nimg.2000.0582. [DOI] [PubMed] [Google Scholar]
- Clark KA, Woods RP, et al. Impact of acquisition protocols and processing streams on tissue segmentation of T1 weighted MR images. Neuroimage. 2006;29(1):185–202. doi: 10.1016/j.neuroimage.2005.07.035. [DOI] [PubMed] [Google Scholar]
- Friston KJ, Holmes AP, Worsley KJ, et al. Statistical Parametric Maps in Functional Imaging: A General Linear Approach. Hum Brain Mapp. 1995;2:189–210. [Google Scholar]
- Guo X, Wang Z, Li K, et al. Voxel-based assessment of gray and white matter volumes in Alzheimer's disease. Neurosci Lett. 2010;468(2):146–150. doi: 10.1016/j.neulet.2009.10.086. [DOI] [PMC free article] [PubMed] [Google Scholar]
- Karas GB, Schletens P, Rombouts SARB, et al. Global and local gray matter loss in mild cognitive impairment and Alzheimer's disease. Neuroimage. 2004;23:708–716. doi: 10.1016/j.neuroimage.2004.07.006. [DOI] [PubMed] [Google Scholar]
- Kempton MJ, Underwood TS, et al. A comprehensive testing protocol for MRI neuroanatomical segmentation techniques: Evaluation of a novel lateral ventricle segmentation method. Neuroimage. 2011;58(4):1051–1059. doi: 10.1016/j.neuroimage.2011.06.080. [DOI] [PMC free article] [PubMed] [Google Scholar]
- Han X, Jovicich J, et al. Reliability of MRI-derived measurements of human cerebral cortical thickness: the effects of field strength, scanner upgrade and manufacturer. Neuroimage. 2006;32(1):180–194. doi: 10.1016/j.neuroimage.2006.02.051. [DOI] [PubMed] [Google Scholar]
- Li T, Mirowitz SA. Fast multi-planar gradient echo MR imaging: impact of variation in pulse sequence parameters on image quality and artifacts. Magn Reson Imaging. 2004;22(6):807–814. doi: 10.1016/j.mri.2004.01.051. [DOI] [PubMed] [Google Scholar]
- McGraw KO, Wong SP. Forming inferences about some intraclass correlation coefficients. Psychol Methods. 1996;1:30–46. [Google Scholar]
- Simmons A, Arridge SR, Barker GJ, Williams SC. Simulation of MRI cluster plots and application to neurological segmentation. Magn Reson Imaging. 1996;14:73–92. doi: 10.1016/0730-725x(95)02040-z. [DOI] [PubMed] [Google Scholar]
- Whitwell JL. Voxel-based morphometry: an automated technique for assessing structural changes in the brain. J Neurosci. 2009;29(31):9661–9664. doi: 10.1523/JNEUROSCI.2160-09.2009. [DOI] [PMC free article] [PubMed] [Google Scholar]