

Abstract
Background
T-peak to T-end interval (Tp-e) is an independent marker of sudden cardiac death. Modulation of Tp-e by sympathetic nerve activation and circulating norepinephrine (NE) is not well understood. The purpose of this study was to characterize endocardial and epicardial dispersion of repolarization (DOR) and its effects on Tp-e with sympathetic activation.
Methods and Results
In Yorkshire pigs (n=13), a sternotomy was performed and the heart and bilateral stellate ganglia (SG) were exposed. A 56-electrode sock and 64-electrode basket catheter were placed around the epicardium and in the left ventricle (LV), respectively. Activation recovery interval (ARI), dispersion of repolarization (DOR), defined as variance in repolarization time, and Tp-e were assessed before and after left, right, and bilateral SG stimulation and NE infusion. LV endocardial and epicardial ARIs significantly decreased, and LV endocardial and epicardial DOR increased during sympathetic nerve stimulation. There were no LV epicardial vs. endocardial differences in ARI during sympathetic stimulation and regional endocardial ARI patterns were similar to the epicardium. Tp-e prolonged during left (from 40.4±2.2 ms to 92.4±12.4 ms; P<0.01), right (from 47.7±2.6 ms to 80.7±11.5 ms; P<0.01), and bilateral (from 47.5±2.8 ms to 78.1±9.8 ms; P<0.01) stellate stimulation and strongly correlated with whole heart DOR during stimulation (P<0.001, R=0.86). Of note, NE infusion did not increase DOR or Tp-e.
Conclusions
Regional patterns of LV endocardial sympathetic innervation are similar to that of LV epicardium. Tp-e correlated with whole heart DOR during sympathetic nerve activation. Circulating NE did not affect DOR or Tp-e.
Keywords: autonomic nervous system, sympathetic, action potential, repolarization, ECG, T peak T end, dispersion, T wave, activation recovery interval
Introduction
The increased spatial heterogeneity and dispersion of ventricular repolarization due to activation of the cardiac sympathetic nervous system may lead to ventricular arrhythmias and sudden cardiac death (SCD).1-3 Selective modulation of cardiac sympathetic nerves has been proposed as an alternative option for patients with recurrent ventricular arrhythmias despite optimal medical therapy and catheter ablation.4-6 The time interval from the peak to the end of the electrocardiographic T wave (Tp-e) is an independent predictor of SCD in patients with long QT syndrome,7, 8 Brugada syndrome,9 hypertrophic cardiomyopathy,10 and structural heart disease.11-13 Tp-e is also thought to represent a marker of transmural dispersion of repolarization (TDR).7, 14, 15 However, it has also been reported that Tp-e reflects not only TDR, but also whole heart dispersion of repolarization (DOR).16, 17 Sympathetic nerve stimulation increases dispersion in activation recovery interval (ARI),18, 19 a surrogate marker of local action potential duration (APD).20 Little is known about the effects of circulating catecholamines compared to sympathetic nerve activation on Tp-e and DOR. In addition, regional endocardial effects in-vivo are not well understood given that previous studies had focused primarily on epicardial recordings.
The purpose of this study was to: 1) evaluate effects of sympathetic activation by direct nerve stimulation vs. increased circulating norepinephrine (NE) on Tp-e and epicardial and endocardial ARI and DOR, and 2) identify any differences in functional distribution of sympathetic innervation of the LV epicardium vs. endocardium.
Methods
Surgical Preparation
Animal handling and care was approved by the University of California Institutional Animal Care and Use Committee and performed in accordance with National Institutes of Health’s “Guide for the Care and Use of Laboratory Animals.”
Female Yorkshire pigs (n=13, 44.9±3.9 kg) were sedated [telazol (8–10 mg/kg) and fentanyl (2-4 μg/kg)], intubated, and mechanically ventilated. General anesthesia was maintained with inhaled isoflurane (0.8–1.5 %) and intermittently timed boluses of fentanyl. Femoral arterial access and venous access along with left carotid arteriotomy and jugular venotomy were performed. A median sternotomy was performed to expose the heart and bilateral cervicothoracic stellate ganglia (SG). Customized bipolar needle electrodes were placed through the right and left stellate ganglia for stimulation. Then, anesthesia with inhaled isoflurane was switched to continuous intravenous infusion of alpha-chloralose (10 mg/kg/hr). Hemodynamic parameters were continuously monitored, and arterial blood gas levels were checked at regular interval. After surgical preparation, animals were stabilized for one hour before initiation of experimental protocol. Animals were euthanized by intravenous administration of a lethal dose of potassium chloride and sodium pentobarbital (100 mg/kg).
Stellate Ganglia Stimulation
The left, right, and bilateral SG were electrically stimulated (4 msec pulses, 4 Hz) by a Grass stimulator (Model S88; Grass Technologies, West Warwick, RI) for 30 seconds. The threshold current, set at a 10% increase in systolic blood pressure (SBP), was measured for each SG. The stimulation current was programmed at twice the threshold for each SG. Left stellate ganglion stimulation (LSS), right stellate ganglion stimulation (RSS), and bilateral stellate ganglia stimulation (BSS) were performed in all animals with a 20-min interval between stimulations.
Norepinephrine Infusion
After SG stimulation and a minimum of a 20 min wait period, norepinephrine (NE) was infused continuously for 2 min at 0.3 μg/kg/min. Hemodynamic and ARI parameters were analyzed just prior to infusion and at 1 and 2 min during the infusion. Both 1 min and 2 min intervals were analyzed to assure that NE effects were consistent and had reached steady-state levels. NE instead of epinephrine was used given that it is the endogenous neurotransmitter of cardiac sympathetic nerves and for comparison with effects of direct nerve stimulation.
Hemodynamic and Surface Electrocardiogram Recordings
Blood pressure was continuously recorded via a femoral arterial catheter. Heart rate (HR) and 12 lead electrocardiograms (ECG) were continuously obtained. Limb leads were placed in standard positions. Due to the open-chest surgical procedure, precordial lead electrodes were placed posteriorly in the positions of V6 through V11. Tp-e was measured in the inferior limb leads with the clearest T wave recording. The peak of the T wave was visually defined, and the end of T wave was defined as the intersection of the tangent to the slope of the T wave and the isoelectric line11, 21 at 100 mm/s sweep speed. The T p-e interval was measured in the inferior limb lead with the clearest recording at a sweep speed at 200 mm/s. The same limb lead was used at baseline and during peak sympathetic stimulation and the longest T p-e interval during stimulation (which usually occurred at 15 seconds into stimulation and lasted to 30 seconds) was measured.
Activation Recovery Interval Measurements
ARI has been shown to correlate with local APD and monophasic action potential duration recordings.20, 22 Activation time (AT) and repolarization time (RT) were measured from unipolar electrograms (0.05-500 Hz) as the intervals from onset to the minimal dV/dt of the depolarization wave and from the onset to the maximal dV/dt of the repolarization wave (T wave), respectively. The difference, ARI, reflects APD at the electrode site (ARI = RT – AT).20, 22 ARI analysis was performed via customized software (Scaldyn M, University of Utah, Salt Lake City, UT).
For purposes of this manuscript, anterior refers to the ventral and posterior refers to the dorsal aspect of the animal. For epicardial ARI analysis, a customized 56-electrode sock was placed around the ventricles (Figure 1A, 1B). Epicardial electrograms were recorded using a custom-made 128 channel multiplexor (University of Utah, Salt Lake City, Utah). ARI data from 56-electrode sock were projected onto a two-dimensional (2D) polar map by using publicly available software (Map3d, Scientific Computing and Imaging Institute, University of Utah, Salt Lake City, UT; http://www.sci.utah.edu/cibc/software/107-map3d.html). For regional epicardial analysis, sock electrodes on the LV epicardium were grouped into four regions: apex, anterior wall, lateral wall, and posterior wall.
Figure 1.

(A) A 56-electrode sock is placed over the ventricles for recording of epicardial electrograms. (B) Sock electrode configuration for creation of polar maps is shown. (C) The 64-electrode catheter used for endocardial recordings is shown. (D) The basket catheter splines are placed on a 2-D plaque type configuration for polar map visualization. LA = left atrium, LAD = left anterior descending coronary artery, LV = left ventricle, RV = right ventricle, RVOT = right ventricular outflow tract.
For LV endocardial ARI analysis, a 64-electrode basket catheter (Constellation catheter, 48 mm diameter, 4 mm spacing, Boston Scientific, Minneapolis, MN) was inserted into the LV via the left carotid artery sheath under ultrasound guidance (Figure 1C). Endocardial unipolar electrograms were recorded using a Prucka CardioLab System (GE Healthcare, Waukesha, WI). Position of the basket catheter was delineated using a 3D electroanatomic mapping system (Ensite, St. Jude Medical, Minneapolis, MN). The eight splines of the catheter were divided into septal, anterior, lateral, and posterior walls depending on their location/contact. The basket catheter electrodes were also separated into apical (distal two electrodes), mid (middle three electrodes), and basal (proximal three electrodes). For mapping and visualization of regional endocardial ARI patterns, the recordings from the 64-electrodes of the basket catheter were mapped onto a 2-D plaque polar map using Map3d (Figure 1D). Electrograms with biphasic repolarization waves or noise were excluded from analysis. For comparison of epicardial vs. endocardial differences in ARI and RT, electrodes on the sock directly across from electrodes of the endocardial basket catheter were manually selected and compared for each region.
Dispersion in RT (DOR) and ARI were calculated as variance in RTs and ARIs measured across all electrodes in a specific region or the entire epicardium and LV endocardium (whole heart). Transmural differences in ARI of the LV were calculated as mean LV epicardial ARI minus mean LV endocardial ARI (Transmural Difference in ARI = ARIepicardium - ARIendocardium). The change in DOR and Tp-e was also analyzed to account for baseline differences.
Statistical Analysis
All values are expressed as mean ± SEM. For paired comparison of baseline and intervention the Wilcoxon signed rank test was used given the non-Gaussian distribution of the data. Regional comparisons during LSS, RSS, BSS and NE infusion were performed using linear mixed effects regression models with heterogeneous variances across regions. For comparison of the correlation between Tp-e and DOR, Pearson product-moment correlation coefficient was used. The Benjamini-Hochberg procedure was used to evaluate significance at 5% false discovery rate for each experiment. A P-value < 0.05 was considered statistically significant. All p-values < 0.05 remained significant after controlling the false discovery rate at 5%. Analyses were performed with SAS version 9.3 (SAS Institute Inc., Cary, NC).
Results
A total of 13 animals successfully underwent the study protocol. Current of stimulation was 6.5±0.86 mA for LSS, and 4.9±0.6 mA for RSS.
Effects of Sympathetic Activation on Hemodynamic Parameters
There was no significant increase in HR during LSS (71.7±2.3 bpm vs. 73.8±3.0 bpm; P=0.65), while RSS and BSS significantly increased HR (from 72.5±2.3 bpm to 99.0±5.3 bpm, P<0.01; and from 74.0±2.7 bpm to 91.0±4.7 bpm, P<0.01, respectively). HR was also significantly increased during NE infusion at 2 min (from 74.4±2.9 bpm to 87.2±4.4 bpm;P<0.01), with no significant increase at 1 min (82.3±5.0 bpm; P=0.06).
SBP was significantly increased during LSS (from 124.5±5.1 mmHg to 140.2±5.5 mmHg; P<0.01), RSS (from 123.0±5.7 mmHg to 142.9±5.6 mmHg; P<0.01), and BSS (from 123.5±6.0 mmHg to 154.3±6.4 mmHg; P<0.01). SBP was also increased by NE infusion at 1 min (from 121.5±6.6 mmHg to 144.1±6.9 mmHg; P<0.01), and 2 min (to 157.5±5.9 mmHg; P<0.01).
Effects of Sympathetic Activation on Global ARIs and Tp-e
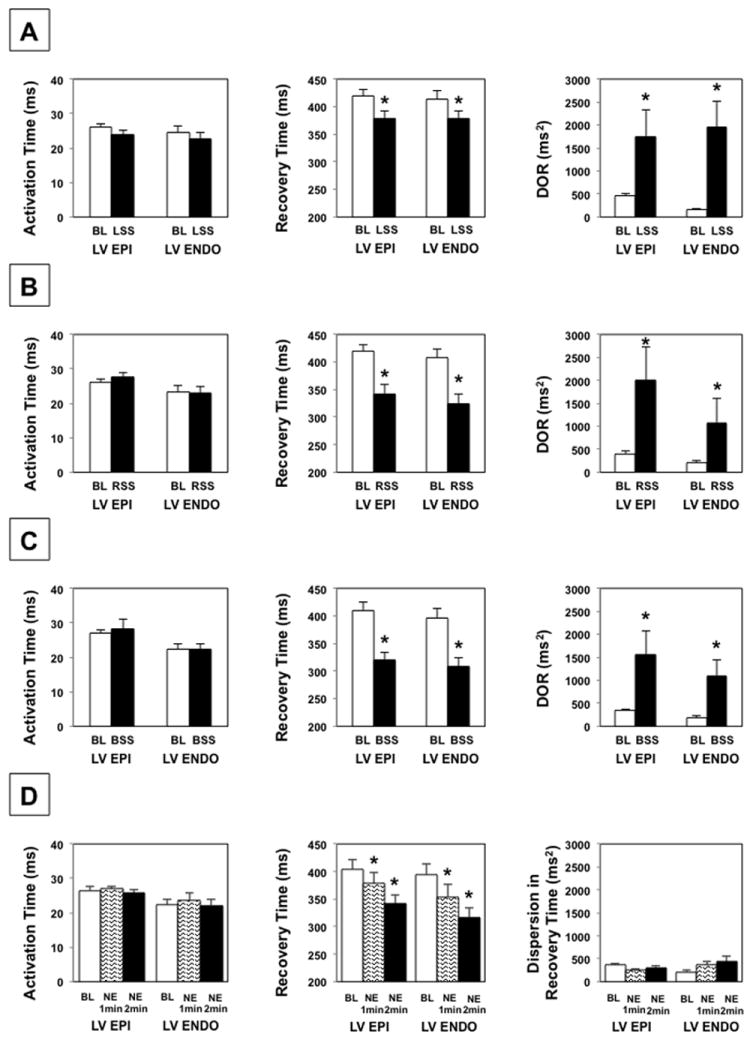
Effects of SG stimulation and NE infusion on whole heart ARI are shown in Figure 2. Whole heart ARI was significantly shortened during LSS (from 385.6±13.8 ms to 354.3±12.5 ms; P<0.01), RSS (from 384.9±14.2 ms to 305.1±15.9 ms; P<0.01), and BSS (from 375.6±15.6 ms to 289.8±13.4 ms; P<0.01). AT was unchanged during LSS (25.3±0.9 ms vs. 23.6±1.4 ms; P=0.09), RSS (25.1±1.3 ms vs. 25.6±1.1 ms; P=0.35), or BSS (25.1±1.0 ms vs. 25.6±1.7 ms; P=0.76). Therefore, as with ARI, RT was decreased during LSS (from 411.0±14.1 ms to 377.9±13.1 ms; P<0.01), RSS (from 409.9±14.7 ms to 330.6±15.9 ms; P<0.01), and BSS (from 400.7±16.1 ms to 315.5±13.2 ms; P<0.01). Whole heart DOR was significantly increased during LSS (from 460.8±39.6 ms2 to 1761.0±470.5 ms2; P<0.01), RSS (from 468.4±33.8 ms2 to 1633.6±573.9 ms2; P=0.013), and BSS (from 417.2±29.3 ms2 to 1468.6±410.2 ms2; P<0.01), Figure 2E. Tp-e was significantly prolonged during LSS (from 40.4±2.2 ms to 92.4±12.4 ms; P<0.01), RSS (from 47.7±2.6 ms to 80.7±11.5 ms; P<0.01), and BSS (from 47.5±2.8 ms to 78.1±9.8 ms; P<0.01), Figure 2F.
Figure 2.

Effects of SG stimulation and NE infusion on whole heart mean ARI (A), dispersion in ARI (B), AT (C), RT (D), DOR (E), and Tp-e interval (F) are shown. Both sympathetic nerve stimulation and NE infusion decrease mean ARI. However, only SG stimulation increased DOR and Tp-e. * P < 0.05 for baseline vs. SG stimulation or NE infusion. † P < 0.01 for baseline vs. SG stimulation or NE infusion. P values obtained using the Wilcoxon signed rank test. BL = baseline, LSS = left stellate stimulation, RSS = right stellate stimulation, BSS = bilateral stellate stimulation, NE = norepinephrine infusion.
Whole heart ARI also shortened with NE infusion (from 372.2±17.4 ms to 335.4±19.5 ms at 1 min, P<0.01, and to 300.5±15.9 ms at 2 min; P<0.01), whereas AT remained unchanged (24.8±1.3 ms vs. 25.7±1.3 ms at 1 min; P=0.29, vs. 23.4±1.1 ms at 2 min; P=0.06). Therefore, RT was also significantly decreased with NE infusion (from 396.9±17.9 ms to 361.1±20.0 ms at 1 min; P<0.01, to 323.9±16.5 ms at 2 min; P<0.01). There was no significant increase in DOR, Figure 2E. Furthermore, Tp-e was also not significantly increased during NE infusion, Figure 2F.
Effects of Stellate Ganglion Stimulation on LV Endocardial and Epicardial ARI
ARI significantly shortened on the LV endocardium and LV epicardium during LSS (from 388.6±15.9 ms to 355.7±14.0 ms on the endocardium; P<0.01, and from 392.4±11.8 ms to 353.8±12.8 ms on the epicardium; P<0.01), RSS (from 388.2±16.4 ms to 304.9±17.0 ms on the endocardium; P<0.01, and from 392.9±12.6 ms to 314.6±15.6 ms on the epicardium; P<0.01) and BSS (from 378.1±17.4 ms to 289.9±15.3 ms on the endocardium; P<0.01, from 383.0±14.1 ms to 292.7±12.5 ms on the epicardium; P<0.01). ARI dispersion increased on the LV endocardium and epicardium during LSS (216.6±65.7 ms2 vs. 1756.9±459.3 ms2 on the endocardium; P<0.01, 431.8±75.5 ms2 vs. 1880.8±624.5 ms2 on the epicardium; P<0.01), RSS (205.0±41.6 ms2 vs. 1345.5±572.2 ms2 on the endocardium; P<0.01, 365.7±47.1 ms2 vs. 1689.6±618.4 ms2 on the epicardium; P=0.027), and BSS (194.8±46.1 ms2 vs. 1230.8±401.5 ms2 on the endocardium; P<0.01, 354.6±43.3 ms2 vs. 1446.5±453.7 ms2 on the epicardium; P<0.01).
AT was unchanged on the LV endocardium or epicardium during LSS (24.6±1.7 ms vs. 22.7±1.8 ms on the endocardium; P=0.08, 26.2±0.9 vs. 24.0±1.3 ms on the epicardium; P=0.08), RSS (23.3±1.8 ms vs. 23.0±1.8 ms on the endocardium; P=0.69, 26.1±0.9 vs. 27.8±1.2 ms on the epicardium; P=0.06), or BSS (22.4±1.5 ms vs. 22.5±1.4 ms on the endocardium; P=0.95, 27.1±1.0 ms vs. 28.3±2.7 ms on the epicardium; P=0.74). Therefore, as with ARI, RT was significantly decreased by LSS (from 413.2±16.0 ms to 378.4±14.0 ms on the endocardium; P<0.01, and from 418.6±12.2 ms to 377.8±13.8 ms on the epicardium; P<0.01), RSS (from 411.5±16.5 ms to 327.9±16.7 ms on the endocardium; P<0.01, and from 419.0±13.1 ms to 342.4±16.2 ms on the epicardium; P<0.01) and BSS (from 400.5±17.4 ms to 312.4±15.0 ms on the endocardium; P<0.01, and from 410.1±14.6 ms to 321.0±12.1 ms on the epicardium; P<0.01). As with ARI dispersion, LV epicardial and endocardial DOR was significantly increased by right, left, and bilateral SG stimulation, Figure 3.
Figure 3.
Effects of LSS (A), RSS (B), BSS (C), and NE infusion (D) on AT, RT, and DOR of LV epicardium and endocardium. * P < 0.01 for baseline vs. SG stimulation or NE administration. BL = baseline, Epi = epicardium, Endo = endocardium, LSS = left stellate stimulation, RSS = right stellate stimulation, BSS = bilateral stellate stimulation, NE = norepinephrine infusion. P values obtained using the Wilcoxon signed rank test.
ARI was also decreased on the LV endocardium and epicardium during NE infusion (from 376.2±18.8 ms to 330.0±21.5 ms at 1 min; P<0.01, to 293.3±16.2 ms at 2 min; P<0.01 on the endocardium, from 377.7±16.5 ms to 351.2±19.0 ms at 1 min; P<0.01, to 315.4±15.6 ms at 2 min; P<0.01 on the epicardium). There was no significant change in AT of the endocardium or epicardium (22.2±1.8 ms vs. 23.7±2.0 ms at 1 min; P=0.16, vs. 22.2±1.8 ms at 2 min; P=0.96 on the endocardium, 26.5±1.1 ms vs. 27.0±0.8 ms at 1 min; P=0.65, vs. 25.8±0.8 ms at 2 min; P=0.43 on the epicardium). Therefore, RT was also decreased during NE infusion (from 398.5±19.0 ms to 353.7±21.8 ms at 1 min; P<0.01, to 315.5±16.6 ms at 2 min; P<0.01 on the endocardium, from 404.3±17.0 ms to 378.2±19.4 ms at 1 min; P<0.01, to 341.2±16.2 ms at 2 min; P<0.01 on the epicardium). However, NE infusion did not significantly increase ARI dispersion, LV epicardial, or endocardial DOR, Figure 3D.
Effects of Stellate Ganglion Stimulation on Regional ARI
Prior to SG stimulation, there was no significant difference in regional ARIs of the epicardium. During LSS, LV epicardial ARI on the posterior and lateral walls shortened more than the anterior wall, Figure 4A, while greater ARI shortening was observed on the anterior wall compared to the posterior wall during RSS, Figure 4B. Of note, there was no significant regional ARI differences during BSS, Figure 4C.
Figure 4.

Regional epicardial ARI effects of (A) LSS, (B) RSS, and (C) BSS are shown in the left panels, while the right panels demonstrate a polar map from a representative animal during each condition. * P < 0.01 for comparison of mean ARI of the LV anterior wall to other regions. † P < 0.01 for comparison of mean ARI of LV posterior wall to other regions. LSS = left stellate stimulation, RSS = right stellate stimulation, BSS = bilateral stellate stimulation. Regional comparisons performed using the linear mixed effects regression model with heterogeneous variances.
Similar to the epicardium, prior to LSS, RSS, or BSS, there were no significant regional differences in mean ARIs of the LV endocardium. During LSS, LV endocardial ARI was significantly shorter on the posterior wall, lateral wall and septum compared to the anterior wall, Figure 5A, P < 0.01. LSS significantly shortened ARI of the apex (from 389.4±16.3 ms to 344.0±14.5 ms) more than the base (from 388.8±15.5 ms to 364.7±13.4 ms, P<0.001 for apex vs. base).
Figure 5.
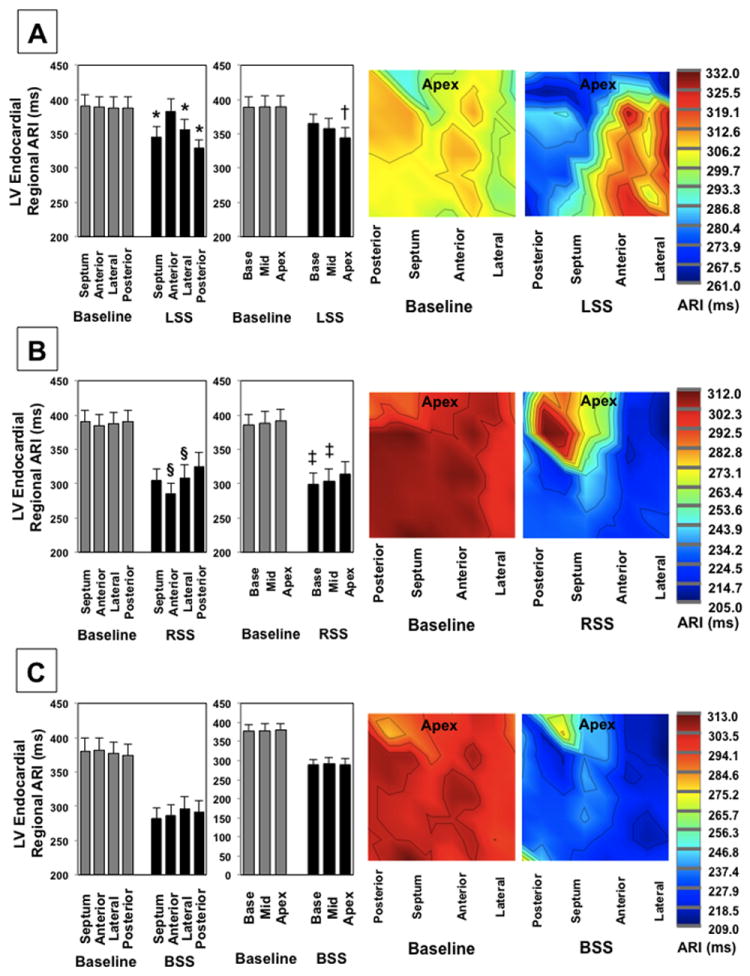
Regional endocardial ARI effects of LSS (A), RSS (B), and BSS (C) are shown in the left panels, while the right panels demonstrate a representative ARI polar maps from a single animal. * P < 0.05 for comparison of mean ARI of the anterior wall to other regions. § P < 0.05 for comparison of mean ARI of the posterior wall to other regions. † P < 0.01 when comparing apical ARI with mid wall or basal ARIs during LSS. ‡ P < 0.05 for comparison of apical with mid wall or basal ARIs during RSS. Regional comparisons performed using the linear mixed effects model with heterogeneous variances.
On the other hand, during RSS, LV endocardial ARI was significantly shorter on the anterior wall (from 384.8±15.8 ms to 285.2±15.1 ms) compared to the posterior wall (from 390.6±16.9 ms to 324.9±20.7 ms, P=0.003 for anterior vs. posterior). In addition, LV endocardial ARI was significantly shorter on the lateral wall (from 388.2±16.5 ms to 308.3±19.3 ms) compared to posterior wall (P=0.011 for lateral vs. posterior). There were no significant differences in endocardial ARI of the septum (390.0±16.8 ms to 304.7±17.7 ms) vs. the posterior wall (P=0.1 for septum vs. posterior wall). RSS shortened LV endocardial ARI of the basal walls (from 385.6±15.6 ms to 299.4±15.8 ms) more than the apex (from 391.5±17.0 to 314.4±17.5 ms, P=0.018 for base vs. apex, Figure 5B). There was at trend for greater shortening of the mid wall compared to the apex as well (from 388.2±16.7 ms to 303.9±18.3 ms on the mid wall, P=0.06). There was no significant difference in regional apico-basal ARIs during BSS, Figure 5C.
At baseline, no significant differences in epicardial ARI compared to endocardial ARI were observed (389.4±7.3 ms vs. 385.0±9.3 ms, P=0.25). Transmural difference in ARI was not changed by LSS (3.8±7.0 ms at baseline vs. -1.8±8.4 ms during LSS, P=0.54), RSS (4.7±6.6 ms at baseline vs. 9.7±4.9 ms during RSS, P=0.46), or BSS (4.9±6.0 ms at baseline vs. 2.8±8.0 ms during BSS, P=0.89), Figure 6.
Figure 6.

There is no effect on global or regional LV transmural differences in ARI during LSS (A), RSS (B), and BSS (C). The Wilcoxon signed rank test was used for the comparison of the transmural differences in ARI. The mixed effects model with heterogenous variances was used for comparison of regional transmural differences in ARI.
Effects of Norepinephrine Infusion on ARI and DOR
Prior to NE infusion, no significant difference in regional ARI of the LV epicardium vs. endocardium was observed. ARI was significantly shortened at 1 and 2 min after NE administration on both the epicardium and endocardium without significant regional, Figure 7.
Figure 7.
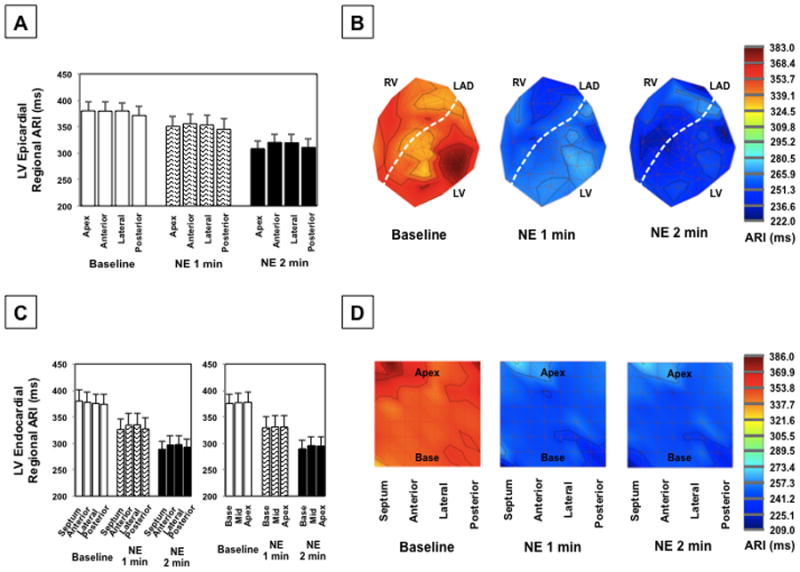
(A) Regional epicardial ARIs for all animals and (B) representative polar maps at baseline and during NE infusion at 1 min and 2 min. (C) Regional endocardial ARIs and (D) representative polar maps during NE infusion. The mixed effects model with heterogeneous variances was used for comparison of regional differences in ARI.
Relationship between Tp-e and DOR
The relationship between Tp-e and DOR is shown in Figure 8. No significant correlation between Tp-e and whole heart DOR was found at baseline (R=0.12, P=0.47). However, Tp-e was strongly correlated with whole heart DOR during stimulation (R=0.86, P<0.001). This correlation was strong for both LV epicardial (R=0.82, P<0.001), and LV endocardial DOR (R=0.89, P<0.001). The change in Tp-e was also strongly correlated with the change in whole heart DOR (R=0.70, P<0.001). Transmural differences in RT had the weakest correlation with Tp-e (R=-0.34, P<0.01). There was no significant correlation between Tp-e and whole heart DOR with NE infusion at 1 min (R=0.36, P=0.25) or 2 min (R=0.41, P=0.17).
Figure 8.
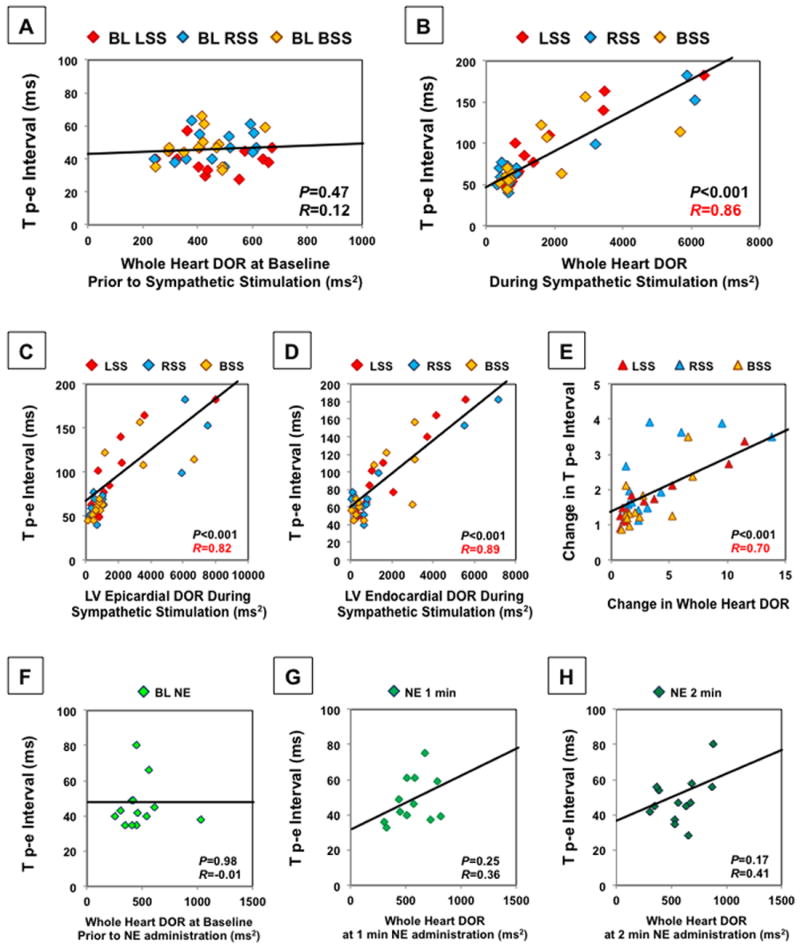
Tp-e does not correlate with DOR at baseline prior to sympathetic nerve stimulation (A). However, it strongly correlates with the DOR of the entire LV and RV epicardium and LV endocardium during SG stimulation (B). Correlation with LV epicardial DOR (C) and LV endocardial DOR (D) during SG stimulation is shown. The change in Tp-e was strongly correlated with the change in whole heart DOR (E). Tp-e did not significantly correlate with DOR at baseline prior to NE infusion (F) or at 1 and 2 minutes after NE infusion (G,H). For comparison of the correlation between Tp-e and DOR, Pearson product-moment correlation coefficient was used.
Discussion
Major Findings
The major findings of this study are: 1) sympathetic nerve stimulation increased Tp-e and whole heart DOR, whereas NE infusion had no effect on Tp-e or DOR; 2) Tp-e was strongly correlated with DOR of the epicardium and endocardium during sympathetic nerve activation; and 3) the regional functional innervation patterns of the LV endocardium were similar to that of the LV epicardium during LSS, RSS, and BSS.
Increase in DOR by sympathetic nerve stimulation is reflected in the increase in Tp-e
Tp-e is a strong predictor of the risk of SCD in patients with congenital channelopathies and structural heart disease.7-12 In cardiac wedge preparation studies, Tp-e was reported to reflect TDR.7, 14, 15 However, more recently, Tp-e has been reported to correlate with whole heart DOR. Opthof et al.17 investigated epicardial, endocardial, and mid myocardial recovery times in a canine LV and found no correlation between Tp-e and transmural DOR; however, Tp-e was correlated with DOR of the whole heart. Izumi et al.16 found that the Tp-e reflects spatial DOR rather than TDR in a drug-induced long QT model. Yet, effects of sympathetic activation, and specifically, stimulation of the nerves versus circulating catecholamines on Tp-e have been less clear. Our group recently reported that the change in epicardial dispersion of RT by LSS and RSS correlated with Tp-e. The results of the current study takes these findings a step further in showing that the pattern of endocardial DOR caused by sympathetic activation followed that of the epicardium, that BSS can also increase DOR and Tp-e, and that NE does not significantly affect DOR or Tp-e. Furthermore, increase in DOR with LSS, RSS, and BSS occurred despite tachycardia, which can mitigate DOR.23 LSS had the strongest effect on Tp-e and DOR. Sympathetic stimulation, particularly LSS, is also known to increase risk of ventricular arrhythmias, EADs and DAD.24-26 Therefore, our results suggest that the increase in Tp-e may be a reflection of increased sympathetic nerve activation, which can lead to SCD.
Importantly, NE infusion did not significantly increase DOR, ARI variance, or Tp-e in the ventricles. Tanabe et al.8 found that epinephrine increased Tp-e as an index of DOR in patients with long QT syndrome but not healthy control patients. The increase in DOR by epinephrine in long QT syndrome patients may be due to heterogeneous distribution of Ca2+ activated IKs, ICl or INa-Ca channels.27 In this porcine model, the increases in DOR appear to be a function of sympathetic innervation rather than distribution of beta receptors or IKs channels. Circulating catecholamines uniformly affect beta adrenergic receptors throughout the ventricles, resulting in little change in DOR or Tp-e.
Electrophysiological effects of sympathetic stimulation on LV epicardium vs. endocardium
Yanowitz et al.28 in 1966 demonstrated that right stellectomy led to refractory period prolongation on the LV anterior wall, and left stellectomy prolonged refractory periods on the posterior wall. However, their assessment was limited to LV anterior and posterior walls. Opthof et al.29 demonstrated shortening of ventricular fibrillation intervals on the posterior and lateral epicardial walls of the ventricles during LSS, whereas RSS shortened ventricular fibrillation intervals on the anterior epicardial wall. Our study shows that functional sympathetic innervation of the LV endocardium follows that of the LV epicardium. No regional differences were found during BSS. ARI shortening was greater on the posterior and lateral LV endocardium during LSS, while RSS decreased endocardial ARI more on the anterior and lateral endocardial walls. LV endocardial lateral wall was an area of overlap between the two stellates. The LV endocardial ARI on the septum significantly shortened during LSS compared to the anterior wall, while there was no significant endocardial ARI shortening on the septum compared to the anterior wall or posterior wall during RSS. Therefore, LV endocardial septum may be a territory of greater left sympathetic nerve innervation.
Cardiac sympathetic denervation therapy has been used as a treatment option for patients with ventricular arrhythmias refractory to medical therapy and catheter ablation.5, 6 Which patients will benefit from left, right, or bilateral cervicothoracic sympathectomy and underlying mechanisms of benefit remain unclear. This study supports the hypothesis that the decrease in heterogeneity of refractoriness or DOR caused by sympathetic activation may serve as one potential mechanism behind the benefits of this procedure.
It is thought that due to its embryological development, sympathetic fibers may be more densely distributed on the sub-epicardium with denervation of the epicardium disrupting response to sympathetic stimulation.30 However, in this study, no significant change in ARI or RT of the LV endocardium vs. epicardium during sympathetic stimulation was found. Martins et al. reported similar findings by demonstrating no change in epicardial and endocardial refractory periods before and after sympathetic stimulation.31 Of note, in this study, the ARI was shorter on the endocardium than epicardium at baseline, consistent with other reports of refractory periods measured in a porcine ventricle.32, 33
Limitations
Electrogram recordings on the RV endocardium and from the mid myocardial layer (M-cell layer) were not obtained in this study. In addition, general anesthesia with inhaled isoflurane can suppress nerve activity. In this study, anesthesia was switched from isoflurane to alpha-chloralose after surgical preparation to reduce anesthetic effects. Furthermore, a strong hemodynamic and electrophysiological response to stimulation was observed. ARI and Tp-e during each stimulation were not corrected for HR. RSS and BSS but not LSS increased HR. However, regional ARIs and RTs, TDR, and correlation of RT with Tp-e were compared at similar HR (at baseline or during intervention). In addition, any HR effects on DOR are of physiological importance. The stimulation and NE infusion protocols in this study were fixed. Therefore, it is possible that an intervention could have effects on subsequent interventions. However, after the 20 minute waiting period, all parameters including ARI, ECG, and hemodynamic values had returned to baseline levels prior to performance of additional stimulation/infusion and the values for each intervention were compared to the pre-stimulation/infusion value just prior to the start of that intervention. In this study, we chose to infuse NE at 0.3 μg/kg/min, and it is possible that this dose may not be sufficient to raise myocardial NE levels to those comparable to nerve stimulation. However, this dose is 3 times the dose used in ACLS protocol or septic shock.34, 35 Therefore, we chose a relatively high dose to achieve a hemodynamic response similar to that achieved by nerve stimulation.
Conclusions
Tp-e is modulated by left, right, and bilateral stellate ganglia stimulation, but not by circulating NE. Therefore, increases in Tp-e are a reflection of increased sympathetic nerve activity, rather than release of circulating NE. Effects of SG stimulation on regional innervation patterns of the LV endocardium are similar to that of the LV epicardium. The reduction in DOR and heterogeneity of repolarization due to the functional distribution of sympathetic innervation may serve as one mechanism behind the therapeutic benefits of cervicothoracic sympathectomy.
Supplementary Material
Acknowledgments
Funding Sources: Supported by the AHA Fellow-To-Faculty grant (11FTF7550004) to MV; and NIH/NHLBI R01HL084261 to KS.
Footnotes
Conflict of Interest Disclosures: The University of California, Los Angeles has intellectual property developed by one of the authors (KS) that relate to epicardial interventions.
References
- 1.Vaseghi M, Shivkumar K. The role of the autonomic nervous system in sudden cardiac death. Prog Cardiovasc Dis. 2008;50:404–419. doi: 10.1016/j.pcad.2008.01.003. [DOI] [PMC free article] [PubMed] [Google Scholar]
- 2.Zhou S, Jung BC, Tan AY, Trang VQ, Gholmieh G, Han SW, Lin SF, Fishbein MC, Chen PS, Chen LS. Spontaneous stellate ganglion nerve activity and ventricular arrhythmia in a canine model of sudden death. Heart Rhythm. 2008;5:131–139. doi: 10.1016/j.hrthm.2007.09.007. [DOI] [PubMed] [Google Scholar]
- 3.Zipes DP, Wellens HJ. Sudden cardiac death. Circulation. 1998;98:2334–2351. doi: 10.1161/01.cir.98.21.2334. [DOI] [PubMed] [Google Scholar]
- 4.Bourke T, Vaseghi M, Michowitz Y, Sankhla V, Shah M, Swapna N, Boyle NG, Mahajan A, Narasimhan C, Lokhandwala Y, Shivkumar K. Neuraxial modulation for refractory ventricular arrhythmias: Value of thoracic epidural anesthesia and surgical left cardiac sympathetic denervation. Circulation. 2010;121:2255–2262. doi: 10.1161/CIRCULATIONAHA.109.929703. [DOI] [PMC free article] [PubMed] [Google Scholar]
- 5.Schwartz PJ, Locati EH, Moss AJ, Crampton RS, Trazzi R, Ruberti U. Left cardiac sympathetic denervation in the therapy of congenital long qt syndrome. A worldwide report. Circulation. 1991;84:503–511. doi: 10.1161/01.cir.84.2.503. [DOI] [PubMed] [Google Scholar]
- 6.Vaseghi M, Gima J, Kanaan C, Ajijola OA, Marmureanu A, Mahajan A, Shivkumar K. Cardiac sympathetic denervation in patients with refractory ventricular arrhythmias or electrical storm: Intermediate and long-term follow-up. Heart Rhythm. 2014;11:360–366. doi: 10.1016/j.hrthm.2013.11.028. [DOI] [PMC free article] [PubMed] [Google Scholar]
- 7.Di Diego JM, Belardinelli L, Antzelevitch C. Cisapride-induced transmural dispersion of repolarization and torsade de pointes in the canine left ventricular wedge preparation during epicardial stimulation. Circulation. 2003;108:1027–1033. doi: 10.1161/01.CIR.0000085066.05180.40. [DOI] [PubMed] [Google Scholar]
- 8.Tanabe Y, Inagaki M, Kurita T, Nagaya N, Taguchi A, Suyama K, Aihara N, Kamakura S, Sunagawa K, Nakamura K, Ohe T, Towbin JA, Priori SG, Shimizu W. Sympathetic stimulation produces a greater increase in both transmural and spatial dispersion of repolarization in LQT1 and LQT2 forms of congenital long QT syndrome. J Am Coll Cardiol. 2001;37:911–919. doi: 10.1016/s0735-1097(00)01200-6. [DOI] [PubMed] [Google Scholar]
- 9.Castro Hevia J, Antzelevitch C, Tornes Barzaga F, Dorantes Sanchez M, Dorticos Balea F, Zayas Molina R, Quinones Perez MA, Fayad Rodriguez Y. Tpeak-Tend and Tpeak-Tend dispersion as risk factors for ventricular tachycardia/ventricular fibrillation in patients with the Brugada syndrome. J Am Coll Cardiol. 2006;47:1828–1834. doi: 10.1016/j.jacc.2005.12.049. [DOI] [PMC free article] [PubMed] [Google Scholar]
- 10.Shimizu M, Ino H, Okeie K, Yamaguchi M, Nagata M, Hayashi K, Itoh H, Iwaki T, Oe K, Konno T, Mabuchi H. T-peak to T-end interval may be a better predictor of high-risk patients with hypertrophic cardiomyopathy associated with a cardiac troponin i mutation than qt dispersion. Clin Cardiol. 2002;25:335–339. doi: 10.1002/clc.4950250706. [DOI] [PMC free article] [PubMed] [Google Scholar]
- 11.Panikkath R, Reinier K, Uy-Evanado A, Teodorescu C, Hattenhauer J, Mariani R, Gunson K, Jui J, Chugh SS. Prolonged Tpeak-to-Tend interval on the resting ecg is associated with increased risk of sudden cardiac death. Circ Arrhythm Electrophysiol. 2011;4:441–447. doi: 10.1161/CIRCEP.110.960658. [DOI] [PMC free article] [PubMed] [Google Scholar]
- 12.Watanabe N, Kobayashi Y, Tanno K, Miyoshi F, Asano T, Kawamura M, Mikami Y, Adachi T, Ryu S, Miyata A, Katagiri T. Transmural dispersion of repolarization and ventricular tachyarrhythmias. J Electrocardiol. 2004;37:191–200. doi: 10.1016/j.jelectrocard.2004.02.002. [DOI] [PubMed] [Google Scholar]
- 13.Golcuk E, Yalin K, Kaya Bilge A, Elitok A, Aksu T, Akgun T, Bilal Karaayvaz E, Emet S, Adalet K. Usefulness of Tpeak-Tend interval to distinguish arrhythmogenic right ventricular cardiomyopathy from idiopathic right ventricular outflow tract tachycardia. Pacing Clin Electrophysiol. 2014;37:1665–1670. doi: 10.1111/pace.12464. [DOI] [PubMed] [Google Scholar]
- 14.Antzelevitch C. Transmural dispersion of repolarization and the T wave. Cardiovasc Res. 2001;50:426–431. doi: 10.1016/s0008-6363(01)00285-1. [DOI] [PubMed] [Google Scholar]
- 15.Yan GX, Antzelevitch C. Cellular basis for the normal T wave and the electrocardiographic manifestations of the long QT syndrome. Circulation. 1998;98:1928–1936. doi: 10.1161/01.cir.98.18.1928. [DOI] [PubMed] [Google Scholar]
- 16.Izumi D, Chinushi M, Iijima K, Furushima H, Hosaka Y, Hasegawa K, Aizawa Y. The peak-to-end of the T wave in the limb ECG leads reflects total spatial rather than transmural dispersion of ventricular repolarization in an anthopleurin-a model of prolonged qt interval. Heart Rhythm. 2012;9:796–803. doi: 10.1016/j.hrthm.2011.11.046. [DOI] [PubMed] [Google Scholar]
- 17.Opthof T, Coronel R, Wilms-Schopman FJ, Plotnikov AN, Shlapakova IN, Danilo P, Jr, Rosen MR, Janse MJ. Dispersion of repolarization in canine ventricle and the electrocardiographic T wave: Tp-e interval does not reflect transmural dispersion. Heart Rhythm. 2007;4:341–348. doi: 10.1016/j.hrthm.2006.11.022. [DOI] [PubMed] [Google Scholar]
- 18.Ajijola OA, Yagishita D, Patel KJ, Vaseghi M, Zhou W, Yamakawa K, So E, Lux RL, Mahajan A, Shivkumar K. Focal myocardial infarction induces global remodeling of cardiac sympathetic innervation: Neural remodeling in a spatial context. Am J Physiol Heart Circ Physiol. 2013;305:H1031–1040. doi: 10.1152/ajpheart.00434.2013. [DOI] [PMC free article] [PubMed] [Google Scholar]
- 19.Vaseghi M, Yamakawa K, Sinha A, So EL, Zhou W, Ajijola OA, Lux RL, Laks M, Shivkumar K, Mahajan A. Modulation of regional dispersion of repolarization and T-peak to T-end interval by the right and left stellate ganglia. Am J Physiol Heart Circ Physiol. 2013;305:H1020–1030. doi: 10.1152/ajpheart.00056.2013. [DOI] [PMC free article] [PubMed] [Google Scholar]
- 20.Millar CK, Kralios FA, Lux RL. Correlation between refractory periods and activation-recovery intervals from electrograms: Effects of rate and adrenergic interventions. Circulation. 1985;72:1372–1379. doi: 10.1161/01.cir.72.6.1372. [DOI] [PubMed] [Google Scholar]
- 21.Perkiomaki JS, Koistinen MJ, Yli-Mayry S, Huikuri HV. Dispersion of qt interval in patients with and without susceptibility to ventricular tachyarrhythmias after previous myocardial infarction. J Am Coll Cardiol. 1995;26:174–179. doi: 10.1016/0735-1097(95)00122-g. [DOI] [PubMed] [Google Scholar]
- 22.Coronel R, de Bakker JM, Wilms-Schopman FJ, Opthof T, Linnenbank AC, Belterman CN, Janse MJ. Monophasic action potentials and activation recovery intervals as measures of ventricular action potential duration: Experimental evidence to resolve some controversies. Heart Rhythm. 2006;3:1043–1050. doi: 10.1016/j.hrthm.2006.05.027. [DOI] [PubMed] [Google Scholar]
- 23.Kim JJ, Nemec J, Papp R, Strongin R, Abramson JJ, Salama G. Bradycardia alters ca(2+) dynamics enhancing dispersion of repolarization and arrhythmia risk. Am J Physiol Heart Circ Physiol. 2013;304:H848–860. doi: 10.1152/ajpheart.00787.2012. [DOI] [PMC free article] [PubMed] [Google Scholar]
- 24.Priori SG, Mantica M, Schwartz PJ. Delayed afterdepolarizations elicited in vivo by left stellate ganglion stimulation. Circulation. 1988;78:178–185. doi: 10.1161/01.cir.78.1.178. [DOI] [PubMed] [Google Scholar]
- 25.Vaseghi M, Zhou W, Shi J, Ajijola OA, Hadaya J, Shivkumar K, Mahajan A. Sympathetic innervation of the anterior left ventricular wall by the right and left stellate ganglia. Heart Rhythm. 2012;9:1303–1309. doi: 10.1016/j.hrthm.2012.03.052. [DOI] [PubMed] [Google Scholar]
- 26.Zipes DP, Rubart M. Neural modulation of cardiac arrhythmias and sudden cardiac death. Heart Rhythm. 2006;3:108–113. doi: 10.1016/j.hrthm.2005.09.021. [DOI] [PMC free article] [PubMed] [Google Scholar]
- 27.Shimizu W, Antzelevitch C. Differential effects of beta-adrenergic agonists and antagonists in LQT1, LQT2, and LQT3 models of the Long QT Syndrome. J Am Coll Cardiol. 2000;35:778–786. doi: 10.1016/s0735-1097(99)00582-3. [DOI] [PubMed] [Google Scholar]
- 28.Yanowitz F, Preston JB, Abildskov JA. Functional distribution of right and left stellate innervation to the ventricles. Production of neurogenic electrocardiographic changes by unilateral alteration of sympathetic tone. Circ Res. 1966;18:416–428. doi: 10.1161/01.res.18.4.416. [DOI] [PubMed] [Google Scholar]
- 29.Opthof T, Dekker LR, Coronel R, Vermeulen JT, van Capelle FJ, Janse MJ. Interaction of sympathetic and parasympathetic nervous system on ventricular refractoriness assessed by local fibrillation intervals in the canine heart. Cardiovasc Res. 1993;27:753–759. doi: 10.1093/cvr/27.5.753. [DOI] [PubMed] [Google Scholar]
- 30.Martins JB, Zipes DP. Epicardial phenol interrupts refractory period responses to sympathetic but not vagal stimulation in canine left ventricular epicardium and endocardium. Circ Res. 1980;47:33–40. doi: 10.1161/01.res.47.1.33. [DOI] [PubMed] [Google Scholar]
- 31.Martins JB, Zipes DP. Effects of sympathetic and vagal nerves on recovery properties of the endocardium and epicardium of the canine left ventricle. Circ Res. 1980;46:100–110. doi: 10.1161/01.res.46.1.100. [DOI] [PubMed] [Google Scholar]
- 32.Xia Y, Liang Y, Kongstad O, Holm M, Olsson B, Yuan S. Tpeak-tend interval as an index of global dispersion of ventricular repolarization: Evaluations using monophasic action potential mapping of the epi- and endocardium in swine. J Interv Card Electrophysiol. 2005;14:79–87. doi: 10.1007/s10840-005-4592-4. [DOI] [PubMed] [Google Scholar]
- 33.Xia Y, Liang Y, Kongstad O, Liao Q, Holm M, Olsson B, Yuan S. In vivo validation of the coincidence of the peak and end of the T wave with full repolarization of the epicardium and endocardium in swine. Heart Rhythm. 2005;2:162–169. doi: 10.1016/j.hrthm.2004.11.011. [DOI] [PubMed] [Google Scholar]
- 34.Guidelines 2000 for cardiopulmonary resuscitation and emergency cardiovascular care. Part 6: Advanced cardiovascular life support: Section 6: Pharmacology ii: Agents to optimize cardiac output and blood pressure. The american heart association in collaboration with the international liaison committee on resuscitation. Circulation. 2000;102:I129–135. [PubMed] [Google Scholar]
- 35.Dellinger RP, Levy MM, Rhodes A, Annane D, Gerlach H, Opal SM, Sevransky JE, Sprung CL, Douglas IS, Jaeschke R, Osborn TM, Nunnally ME, Townsend SR, Reinhart K, Kleinpell RM, Angus DC, Deutschman CS, Machado FR, Rubenfeld GD, Webb S, Beale RJ, Vincent JL, Moreno R Surviving Sepsis Campaign Guidelines Committee including The Pediatric S. Surviving sepsis campaign: International Guidelines for Management of Severe Sepsis and Septic Shock, 2012. Intensive Care Med. 2013;39:165–228. doi: 10.1007/s00134-012-2769-8. [DOI] [PMC free article] [PubMed] [Google Scholar]
Associated Data
This section collects any data citations, data availability statements, or supplementary materials included in this article.