Abstract
Commercially-available shear wave imaging systems measure group shear wave speed (SWS) and often report stiffness parameters applying purely elastic material models. Soft tissues, however, are viscoelastic, and higher-order material models are necessary to characterize the dispersion associated with broadband shearwaves. In this paper, we describe a robust, model-based algorithm and use a linear dispersion model to perform shearwave dispersion analysis in traditionally “difficult-to-image” subjects. In a cohort of 135 Non-Alcoholic Fatty Liver Disease patients, we compare the performance of group SWS with dispersion analysis-derived phase velocity c(200 Hz) and dispersion slope dc/df parameters to stage hepatic fibrosis and steatosis. AUROC analysis demonstrates correlation between all parameters (group SWS, c(200 Hz), and, to a lesser extent dc/df) and fibrosis stage, while no correlation was observed between steatosis stage and any of the material parameters. Interestingly, optimal AUROC threshold SWS values separating advanced liver fibrosis (≥F3) from mild-to-moderate fibrosis (≤F2) were shown to be frequency dependent, and to increase from 1.8 to 3.3 m/s over the 0–400 Hz shearwave frequency range.
Index Terms: Shearwave imaging, Ultrasound, Elasticity, Viscoelasticity, Hepatic Stiffness, Dispersion, Acoustic Radiation Force
I. Introduction
Over the past decade, shearwave elasticity imaging (SWEI) methods have been developed that employ acoustic radiation force impulse (ARFI) excitations to generate shearwaves in tissues and ultrasonic tracking techniques to monitor the shearwave speeds (SWS) [1]–[4]. Recent studies with commercially-available SWEI systems consistently portray positive correlations between liver stiffness and hepatic fibrosis stage and are finding application in noninvasively differentiating mild-to-moderate fibrosis from advanced fibrosis and cirrhosis [5]–[7]. These systems measure group SWS (cs), and do not characterize higher order tissue properties such as tissue nonlinearity or shearwave dispersion (i.e., the frequency dependent behavior of shearwave propagation arising from the viscoelastic nature of tissue).
Recent studies have demonstrated that hepatic tissue exhibits considerable dispersion [8]–[13]. Although a diagnostic benefit of characterizing dispersive behavior has not been demonstrated to date in the context of hepatic fibrosis staging [10]–[12], [14], the presence of appreciable SWS dispersion in hepatic tissue begs the following question:
What is the impact of ignoring dispersion on the diagnostic utility of SWEI methods?
More specifically, what errors may materialize through the measurement and reporting of a single group SWS velocity estimate as compared to characterizing the higher order, more accurate phase velocity (dispersion) estimates. To that end, we present a robust, model-based SWEI processing algorithm to estimate shearwave phase velocities in noisy data. Using previously acquired SWEI data from a cohort of 135 patients receiving biopsies for non-alcoholic fatty liver disease (NAFLD) to evaluate liver fibrosis and steatosis [15], we compare the performance of estimating group SWS with that of the phase velocity c(200 Hz) and dispersion slope dc/df parameters obtained using a linear dispersion model with our dispersion analysis. We evaluate the frequency dependence of optimal AUROC SWS thresholds for differentiating hepatic fibrosis stages, and we assess the correlation between experimental metrics (c(200 Hz), dc/df, and group SWS) and fibrosis stage. In addition, the absence of SWS trends with steatosis are presented.
II. Background
In a linear, isotopic, elastic material, the SWS (cs) can be related to the shear modulus μ of the material in which the wave is propagating through the relation
| (1) |
where E represents the Young’s modulus, ν represents the Poisson’s ratio, and ρ represents the density. However, this relationship becomes more complicated when the material exhibits appreciable viscoelastic behaviors. The commercial SWEI systems that are now clinically available measure SWS, but there is variability in the metrics that are displayed and reported [7]. Some systems report SWS (cs, in units of m/s), which is the most direct quantity measured in the tissue, but some systems convert SWS to Young’s modulus (E, in units of kPa) using specific material assumptions, to facilitate comparison with tissue stiffness metrics reported from earlier compressive strain imaging efforts [16]. Under the assumptions of linearity, isotropy, pure elasticity, and incompressibility (so that ν = 0.5), Young’s modulus can be related to SWS and shear modulus as
| (2) |
Typically, a density of 1 g/cm3 is assumed in the conversion from cs to E or μ.
The use of higher-order, viscoelastic material models to characterize dispersive shearwave behavior has been investigated in hepatic tissues [10], [12], [14], [17], with the clinical motivation that the additional viscous parameters may provide novel mechanisms for tissue contrast and the delineation of different pathologies. It is possible to characterize dispersion using ARFI exictation because these excitations include a wide range of shearwave frequencies (bandwidths up to 1000 Hz have been reported [18]). The frequency dependence of SWS can be evaluated through shearwave spectral analysis and time-of-flight velocity estimation on an individual frequency component basis [19], [20].
Instead of reporting the frequency dependent phase velocity, material models are typically used to parameterize the phase velocity in terms of a small number of variables. Viscoelastic materials are typically modeled as networks of discrete component springs and dashpots, for example a spring and dashpot in series (Voigt model), a spring and dashpot in parallel (Maxwell model), or a spring in parallel with a series combination of spring and dashpot (Standard Linear model). The relationship between shearwave speed dispersion and the material model parameters varies with the complexity and design of the material model [21]. The most common model that has been applied to SWEI data is the Voigt model for which the dispersion relation is given in terms of the stiffness μ, viscosity η, and frequency ω = 2πf by
| (3) |
An alternative approach used in this investigation is to characterize the dispersion relation using a linear model [8], [13],
| (4) |
where c0 is the intercept at zero frequency and dc/df is the dispersion slope. This model is used here for three reasons. First, we observe approximately linear dispersion for the frequency ranges measured using ARFI excitations in human liver. Second, the Voigt model dispersion relation (3) is complicated and includes frequency ranges with upward and downward curvatures. Thus, for noisy measurements in a limited frequency range, the Voigt model can yield large variability in the fitted parameters as the fitting procedure attempts to identify these higher order behaviors. Finally, with the Voigt model it is tempting to compare the stiffness μ calculated from the group shear wave speed using (2) with the stiffness μ obtained by fitting the Voigt model (3) to phase velocity data. However, this comparison is often not valid in cases with large dispersion such as observed in human liver.
III. Methods
A. ARFI/SWEI Acquisitions and Liver Histology
The subject population and ARFI/SWEI data acquisition procedures used for this study have been previously described [15], [22]. Briefly, ARFI/SWEI acquisitions were performed in 172 NAFLD patients undergoing biopsy at the Gastroenterology and Hepatology Clinic at Duke University Medical Center in a study approved by the Institutional Review Board at Duke University. Acoustic radiation force excitation and ultrasonic shearwave tracking were performed using a Siemens SONOLINE Antares™ scanner and a CH4-1 transducer (Siemens Healthcare, Ultrasound Business Unit, Mountain View, CA), as described by Wang et al. [22]. Excitation and tracking parameters are summarized in Table I. Data were collected using 4:1 parallel receive tracking over nine excitations to track wave propagation to one side of the excitation. The total acquisition time was ~200 ms. In-phase and quadrature (IQ) data were saved and processed off-line using the Loupas algorithm [23] to estimate tissue displacements relative to reference data collected before the excitation. The displacement estimates were low-pass filtered at 1 kHz, and a quadratic motion filter was applied to reduce the effects of physiologic and transducer motion. After scan conversion, the group SWS was determined by estimating the arrival time of the peak displacement as a function of position. The RANSAC algorithm was used to perform a linear least squares regression to data within the axial depth of field (DOF) which was calculated [24] as 8F2λ = 22 mm using the f-number F and wavelength λ = c/f from Table I. In the remainder of this paper, we refer to the SWS estimated using this procedure as the group SWS. Finally, the displacement data were averaged over the DOF for the analysis described below. Calculations were performed using Matlab® (The MathWorks, Natick, MA) on a Linux cluster with an average CPU speed of ~2.6 GHz.
TABLE I.
Parameters for radiation force excitation and shearwave tracking
| Parameter | Value |
|---|---|
| Push frequency | 2.22 MHz |
| Push duration | 180 μs |
| Push F/# | 2.0 |
| Push focal depth | 49 mm |
| Elevation focus | 49 mm |
| Track frequency | 2.22 MHz |
| Track PRF | 4.8 kHz |
| Isppa,0.5 | 1660 W/cm2 |
| MI0.3 | 3.2 |
ARFI/SWEI acquisitions were performed at two intercostal locations and one lateral, subcostal location with 6 – 12 (total) acquisitions in each subject. Statistical analysis [15] indicated no significant variation with (a) the variation in stiffness between patients within each fibrosis stage averaged over the locations and replicate measurements, (b) the variation in stiffness across the three imaging locations averaged over the replicate measurements, and (c) the variation in stiffness between replicate measurements within the same patient. Thus, all of the successful estimates of group SWS at the three imaging locations were combined for the analysis in this study. Successful estimations of group SWS were achieved in 135 of the 172 subjects.
All liver biopsy specimens were hematoxylin-and-eosin (H & E) stained. Liver histology was reviewed and scored for steatosis grade and fibrosis stage by either a liver histopathologist (CG) or a hepatologist (MA) according to the published NASH Clinical Research Network scoring system [25]. Briefly, steatosis was graded from 0 to 3 based on the percentage of affected hepatocytes: < 5% (grade 0), 5–33% (grade 1), 34–66% (grade 2) and > 66% (grade 3). Fibrosis was classified into 5 stages: none, normal connective tissue (stage 0), zone 3 perisinusoidal or periportal fibrosis (stage 1; 1a = mild, zone 3, perisinusoidal, 1b = moderate, zone 3, perisinusoidal, 1c = portal/periportal), moderate, zone 3, perisinusoidal and portal/periportal fibrosis (stage 2), bridging fibrosis (stage 3), cirrhosis (stage 4). For the purpose of these analyses, fibrosis stages 1a, 1b, and 1c were combined and treated as stage 1.
B. Dispersion Analysis
The NAFLD patient population in this study is often characterized as “difficult to image acoustically” due to phase aberration and acoustic attenuation that, in SWEI data, leads to decreased shear wave amplitude, increased noise in displacement estimates [15], [26], [27], and increased sensitivity to effects such as physiologic motion [28]. Due to these difficulties, we have had poor success (see Sec. IV-B) in attempts to measure dispersion using the phase spectroscopy technique [19], and have investigated alternative methods to quantify dispersion.
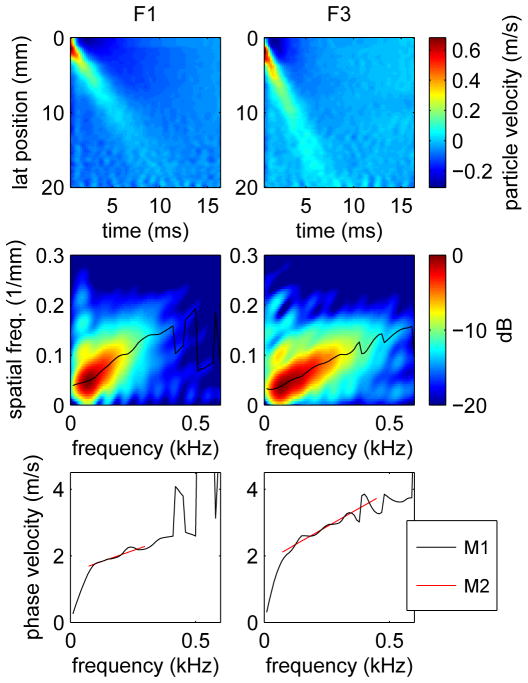
Our approach builds upon that presented by Nenadic, et al. [29], who have described a method to measure the frequency dependent phase velocity by constructing the two-dimension Fourier transform (2D-FT) of the particle velocity in the propagating shear wave and measuring the spatial frequency k(ω) by identifying the location of the peak 2D-FT signal at discrete temporal frequencies. Figure 1 illustrates this method for ARFI/SWEI acquisitions in subjects with fibrosis stage F1 (left) and F3 (right). The top row of the figure shows the particle velocity as a function of position and time after differentiating the measured displacement signal with respect to time. The second row of the figure shows the corresponding 2D-FT data with the location of the peak signal at each temporal frequency indicated by the black line. The third row of the figure shows the phase velocity, labeled “M1”, calculated using the relation c = ω/k = fλ. We observe that above a frequency of roughly 75 Hz, the phase velocity exhibits an approximately linear frequency dependence. Below 75 Hz, the phase velocity deviates from the linear dependence because of the roll-off of the 2D-FT signal at low frequency.
Fig. 1.
Particle velocities (top), 2D-FT data (center), and phase velocities (bottom) for shear wave propagation from acquisitions in human subjects with fibrosis stages F1 (left) and F3 (right). The black line on the 2D-FT images shows the spatial frequency k(ω) of the peak 2D-FT signal as a function of temporal frequency, and the corresponding phase velocity calculated as c = ω/k is labeled “M1” on the bottom. The phase velocities labeled “M2” were calculated using the Radon-like sum method with frequency ranges 73-298 Hz (F1, left) and 73-449 Hz (F3, right).
As discussed in Sec. II, we use a linear dispersion model (4) to parameterize the phase velocity in terms of the intercept c0 and dispersion slope dc/df. For measurements such as shown in Fig. 1, the intercept and slope were estimated by performing a linear regression of phase velocity as a function of frequency. Because of the deviation from linearity at low frequencies, the frequency range used here was chosen to extend from the frequency of the maximum 2D-FT signal to the maximum frequency of the −12 dB energy contour. For the cases shown in Fig. 1, the frequency ranges were 73-298 Hz (F1, left) and 73-449 Hz (F3, right). The resulting slope and intercept values were c0 = 1.45 m/s and dc/df = 2.92 m/s/kHz for the F1 (left) case, and c0 = 1.83 m/s and dc/df = 4.05 m/s/kHz for the F3 (right) case. For the results presented below, we report the speed evaluated at an intermediate frequency of 200 Hz which was empirically selected so that the phase velocity agrees approximately with the group SWS.
We also consider an extension of the 2D-FT approach described above to estimate model parameters directly from 2D-FT data by adapting the Radon sum approach described by Rouze, et al. [30]. In this method, we consider curved trajectories through the 2D-FT domain with the spatial frequency k(ω) determined by the specific dispersion model being considered. By evaluating these trajectories as a whole, this method is expected to be less sensitive to gross outlier data and to increase the robustness for noisy data as compared to the estimation of model parameters using a linear regression of phase velocity data measured at individual frequencies. For the linear dispersion model used here, the solution space is parameterized by the intercept c0 and slope dc/df, and different solutions are compared using the sum S (c0, dc/df) of the 2D-FT signal |U(k, ω)|2 along the curved trajectory where the wavenumber k = k (c0, dc/df, ω) is expressed in terms of frequency using (4),
| (5) |
The model parameters c0 and dc/df that best represent the phase velocity are given by the coordinates of the maximum sum. The frequency range used for the summation in (5) was the same as the frequency range used for the linear regression in the method described in the previous paragraph. In Fig. 1, the results obtained using this method are shown as red lines labeled “M2” on the plots of phase velocity, and the frequency extent of these lines indicates the frequency range used in the summation in (5). The estimated intercept and slope are c0 = 1.50 m/s and dc/df = 2.63 m/s/kHz for the F1 (left) case, and c0 = 1.80 m/s and dc/df = 4.28 m/s/kHz for the F3 (right) case which are in relatively good agreement with the results using method M1 as presented in the previous paragraph. Because the trajectory k = k (c0, dc/df, ω) in the 2D-FT domain is not linear, the sum (5) is not a true Radon sum, and in the following, we refer to this method below as a “Radon-like” sum.
In addition to the 2D-FT methods described above, we also consider the phase spectroscopy method [19] to characterize the dispersion in simulation data. This method determines the shear wave phase velocity by Fourier transforming the shear wave particle velocity in time and performing a linear regression to determine the slope dϕ/dx of the Fourier transform phase ϕ as a function of position x. Then the phase velocity is given by
| (6) |
As noted above and in Sec. IV-B, we have had poor success in our attempts to apply this method to our human liver data, and it is used here only to analyze simulation data.
C. ROC Curve Analysis
The ability to distinguish disease states was evaluated by performing receiver operator characteristic (ROC) curve analysis. For fibrosis staging, ROC curves were constructed corresponding to the separation of subjects into mild-to-moderate fibrosis with stages ≤F2, and advanced fibrosis with stages ≥F3. For steatosis scoring, subjects were separated into groups with low steatosis with grades ≤S1 and high steatosis with grades ≥S2. ROC curves were constructed by considering a range of threshold levels for three metrics: the phase velocity evaluated using (4) at a frequency of 200 Hz, i.e., c(200 Hz), the dispersion slope dc/df, and the group SWS. For each curve, the threshold parameter was varied throughout a range sufficiently large to include all measured values of the parameter. For each specific threshold level, subjects were categorized as true positive, true negative, false positive, or false negative depending on the value of the threshold parameter and the fibrosis stage or steatosis grade for each subject. Sensitivity and specificity values were calculated from the subject population in each category and ROC curves were constructed by plotting sensitivity vs. (1 - specificity) as a function of the threshold parameter. The area under the ROC curve (AUROC) quantifies the ability to distinguish between the two disease states, and the sensitivity and specificity at different thresholds along the curve can be used to characterize the measurement. The optimal sensitivity, specificity, and threshold are given by the point on the ROC curve nearest to the corner with sensitivity = 1 and specificity = 1.
D. Finite Element Simulations
Previously-validated finite element (FE) models were used to simulate the dynamic response of a viscoelastic solid to impulsive, acoustic radiation force excitations [31]. The three-dimensional response of the solid was solved through the balance of linear momentum using LS-DYNA3D (Livermore Software Technology Corp., Livermore, CA) with the *MAT_006 material model that describes the shear relaxation behavior as
| (7) |
where G0 and G∞ are short-time and long-time (infinite) shear moduli, respectively, and β is the decay constant. This material model is equivalent to a Standard Linear model of viscoelasticity represented by a spring with stiffness μ1 = G∞ in parallel with a series combination of spring with stiffness μ2 = G0 −G∞ and dashpot with viscosity η = (G0 −G∞)/β. The phase velocity dispersion relation for this model is given by
| (8) |
where
| (9) |
and
| (10) |
The excitation force was modeled [31] as
| (11) |
where α is the attenuation, csound is the speed of sound in the medium, and the acoustic intensity I⃗ was calculated based on the transducer excitation configuration using Field II [32] with an amplitude chosen empirically to give an on-axis displacement of ~20 μm. The simulation had lateral × elevational × axial dimensions of 30 mm × 15 mm × 90 mm and utilized quarter symmetry boundary conditions on the lateral-axial and elevational-axial faces. Elements were uniform cubes with 0.25 mm node spacing. Simulations were performed for a duration of 15 ms with intermediate results saved at intervals of 0.1 ms, consistent with the experimental measurements.
Simulations were performed using 336 combinations of material constants with 5 kPa ≤ G0 ≤ 30 kPa, 0.5 kPa ≤ G∞ ≤ 8 kPa, and 0.5 Pa-s ≤ (G0 − G∞)/β ≤ 80 Pa-s. To select simulations with viscoelastic properties similar to human liver, the liver data were analyzed by calculating the 2D-FT and determining the maximum spatial and temporal frequencies of the −12 dB energy contour in all patients. Figure 2 shows the maximum frequencies for human liver with results plotted as a function of fibrosis stage. We observe that the maximum temporal frequency increases with fibrosis stage and that the maximum spatial frequency is approximately independent of fibrosis stage. We note that these results are consistent with a model in which the range of spatial frequencies is determined by the excitation process, while the range of temporal frequencies also depends on the shear wave propagation speed and increases with higher fibrosis stages. Similarly, results from each of the simulation cases were analyzed to determine the maximum spatial and temporal frequencies of the −12 dB energy contour, and 58 cases were found to agree with the human liver data in Fig. 2. These 58 simulations were used to evaluate the analysis methods described in Sec. III-B.
Fig. 2.
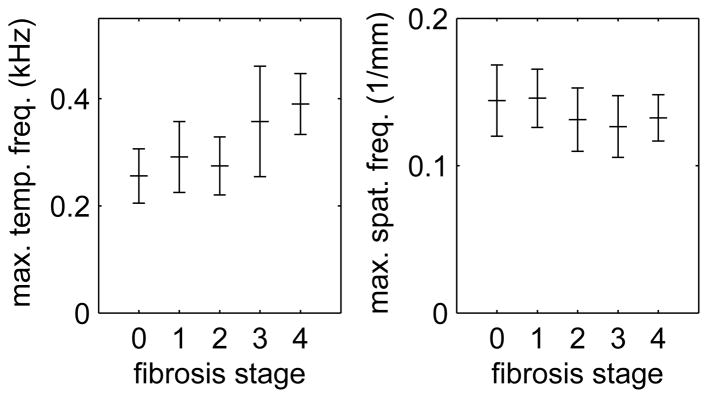
Maximum temporal (left) and spatial (right) frequencies measured using the −12 dB energy contour from 2D-FT data in human liver. Shown are the mean ± standard deviation values from acquisitions in subjects with fibrosis stages F0–F4.
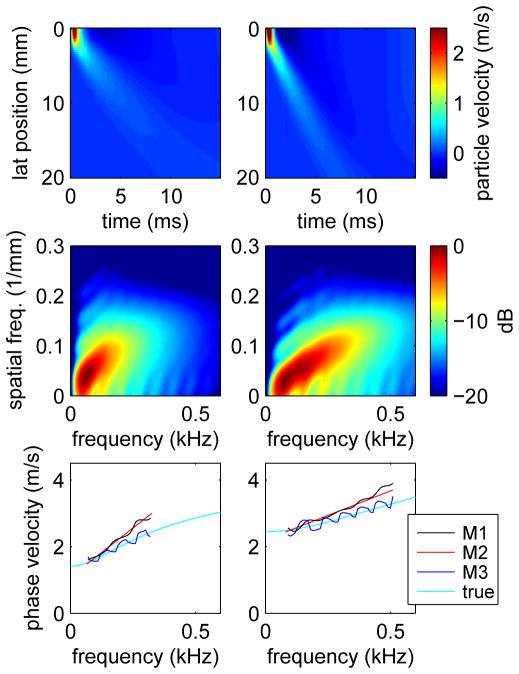
Figure 3 shows results from simulations performed using the material constants G0 = 15 kPa, G∞ = 2 kPa, and β = 6500 Pa-s (left) and G0 = 30 kPa, G∞ = 6 kPa, and β = 12000 Pa-s (right). Shown are the particle velocities as a function of position and time (top), the 2D-FT data (center), and phase velocities (bottom). For the phase velocities, results are shown for the two methods discussed in Sec. III-B which determine k(ω) from the 2D-FT data by finding the location of the maximum signal at discrete frequencies (method M1) and by performing the Radon-like sum (method M2). Also shown are the phase velocities measured using the phase spectroscopy approach (method M3). These phase velocities are plotted over the frequency range determined in the same way as for the human liver data using the energy distribution of the 2D-FT data, see Sec. III-B. Also shown in Fig. 3 are the true phase velocities calculated from the material constants using (8). We observe that the phase spectroscopy results are in agreement with the true phase velocities, and that the phase velocities estimated using both of the 2D-FT methods overestimate the average speeds and dispersion slopes. We also note that the oscillatory structure in the phase spectroscopy results is, in part, a result of the mesh size used in the simulation. Results obtained using different mesh sizes show increased frequency and decreased amplitude in the oscillatory structure with increased temporal or spatial ranges. However, the results shown in Fig. 3 were chosen because they correspond to the spatial and temporal ranges of the experimental measurements.
Fig. 3.
Particle velocities (top), 2D-FT data (center), and phase velocities (bottom) for simulations of shear wave propagation following impulsive excitation in viscoelastic media with material constants G0 = 15 kPa, G∞ = 2 kPa, and β = 6500 Pa-s (left) and G0 = 30 kPa, G∞ = 6 kPa, and β = 12000 Pa-s (right). Phase velocity results are shown for the 2D-FT methods discussed in Sec. III-B which determine k(ω) by finding the location of the maximum signal at discrete frequencies (method M1) and by performing the Radon-like sum (method M2). Also shown are the results obtained using phase spectroscopy (method M3) and the true results calculated from the material constants used in the simulations. The extent of the lines plotted for M1, M2, and M3 indicate the frequency range used for the linear dispersion analysis.
IV. Results
A. Finite Element Simulations
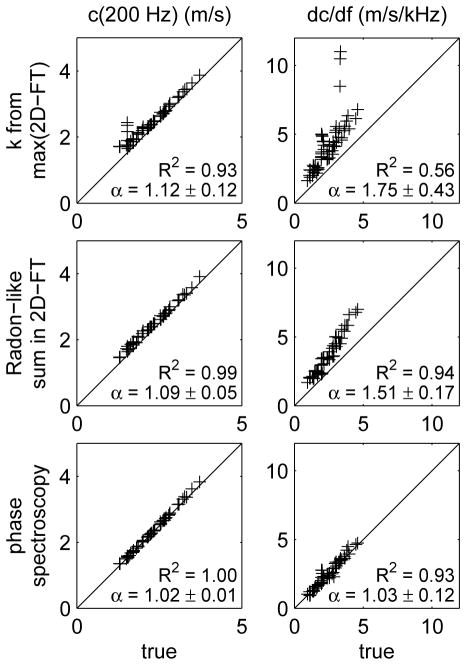
The experimental methods described in Sec. III-B were evaluated by analyzing the results of finite element simulations where the true results could be determined from the known material properties. Figure 4 shows scatter plots for results obtained by analyzing the results from the 58 simulations that were identified in Sec. III-D as similar to human liver. Each plot compares the experimental results to the true results obtained from the known phase velocity (8). Comparisons are made for the speed c(200Hz) (left) and slope dc/df (right) from the linear dispersion model, and for the three experimental methods described in Sec. III-B, i.e., measuring k(ω) from the location of the peak 2D-FT signal (top), the Radon-like sum (middle), and phase spectroscopy (bottom).
Fig. 4.
Scatter plots showing the correlation between truth (x-axis) and results obtained using the three experimental methods (y-axis) to estimate the speed c(200Hz) (left) and dispersion slope dc/df (right) in the linear dispersion model. The experimental methods include measuring k(ω) from the location of the peak 2D-FT signal (top), the Radon-like sum (middle), and phase spectroscopy (bottom). The coefficient of determination R2 and average scale factor α = 〈ymethod/xtrue〉 between y-axis and x-axis data (mean ± standard deviation) are shown for each case. The diagonal lines indicate equality.
The results shown in Fig. 4 demonstrate good correlation between each of the three experimental methods and the true results. The phase spectroscopy results give the best correlation and lowest bias. However, because we have not been able to analyze our experimental data using this method, we have also considered the other two methods. Compared to the measurement of k(ω) from the location of the peak 2D-FT signal, the Radon-like sum method is more robust with better R2 values, lower biases, and smaller values of standard deviation for the scale factor α. Thus, we have chosen to use the Radon-like sum method for the analysis of the human liver data below. We note, however, that the results presented in Fig. 4 apply only to the 3-parameter viscoelastic model used in the simulations. The actual viscoelastic properties of human liver are not known, and it is not possible to determine the degree of bias introduced in human liver measurements by any of the analysis methods considered here.
B. Results in Human Liver
Using the Radon-like sum method, the linear dispersion analysis was successfully performed in 98 of the 135 subjects for which group SWS estimates were available. From these subjects, a total of 374 individual acquisitions gave successful group SWS and linear dispersion analyses. These subjects and acquisitions were selected by examining the 2D-FT data from each acquisition and judging whether or not the phase velocity data k(ω) calculated using the linear dispersion model accurately represented the energy distribution of the 2D-FT data. To verify these selections, we also evaluated the 2D-FT data using the method of Nenadic, et al. [29] to determine the spatial frequency k(ω) from the peak 2D-FT data at discrete temporal frequencies. Analyzing these data using the linear dispersion model gave 354 acquisitions in 100 subjects with R2 ≥ 0.70, and nearly a perfect overlap with the results of the Radon-like sum approach. For comparison, a similar linear regression analysis using the phase spectroscopy method [19] gave 37 acquisitions in 28 subjects with R2 ≥ 0.70. Because of these low yields, we have concluded that the phase spectroscopy procedure is not sufficiently robust to be used for the analysis of our human liver data.
The results identified above are compared in the scatter plots shown in Fig. 5 where the linear dispersion model is evaluated at frequencies of 0 Hz (left) and 200 Hz (right). In this figure, the individual acquisitions are divided into groups of subjects with low fibrosis (≤F2, black) and high fibrosis (≥F3, red). The coefficient of determination R2 is given on each figure and indicates significantly better correlation when the linear dispersion results are evaluated at a frequency of 200 Hz.
Fig. 5.
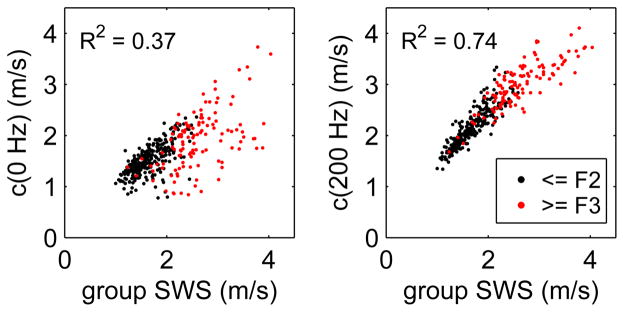
Scatter plot showing the comparison of the phase velocities found using frequencies of 0 Hz (left) and 200 Hz (right) with the group SWS measurements. Results are shown for 374 individual acquisitions in 98 subjects with low fibrosis (≤F2, black) and high fibrosis stage (≥F3, red). The coefficient of determination R2 is shown for each case.
For the c(200 Hz) results in Fig. 5, we also observe a deviation from a linear relation with a slight downward curvature. This behavior suggests that the frequency required to give the best agreement between the group SWS and linear dispersion results should increase for higher speeds (and higher fibrosis stages) to increase the contribution from the dispersion slope term in (4). This result is consistent with the increased range of frequencies observed with greater fibrosis stages in Fig. 2.
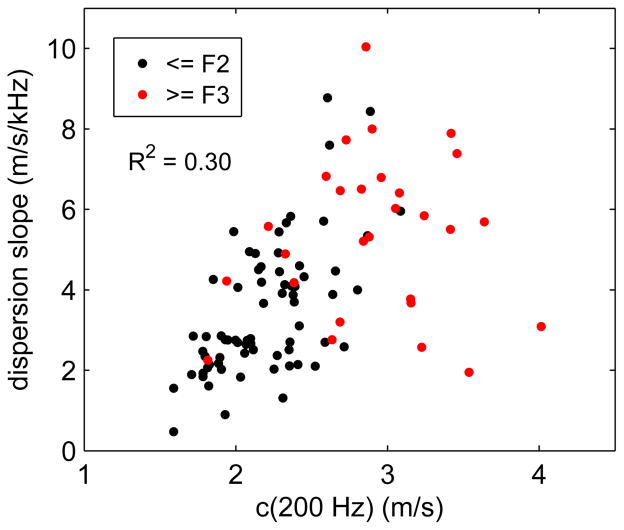
Figure 6 shows a scatter plot with the patient-averaged dispersion slope dc/df plotted as a function of phase velocity evaluated using the linear dispersion model (4) at a frequency of 200 Hz, i.e., c(200 Hz). On the figure, individual subjects with low fibrosis stage (≤F2) are indicated in black, and with high fibrosis stage (≥F3) in red. We observe a weak correlation with R2 = 0.30 between the dispersion slope and c(200 Hz). We also observe left-right and top-bottom separation of the low and high fibrosis results suggesting that both c(200 Hz) and dc/df can be used to distinguish between high and low fibrosis stages.
Fig. 6.
Scatter plot showing the dispersion slope dc/df vs. c(200 Hz) for 98 subjects that were successfully analyzed using the linear dispersion model. Subjects are divided into those with low fibrosis stage (≤F2, black) and high fibrosis stage (≥F3, red).
C. Fibrosis Staging in Human Liver
Figure 7 shows ROC curves for separation of mild-to-moderate fibrosis with stages ≤F2 from advanced fibrosis with stages ≥F3 using the phase velocity (4) evaluated at 200 Hz (left), the dispersion slope (center), and the group SWS (right) as the threshold parameter. For each case, the sensitivity and specificity were calculated as the threshold parameter was varied, and the optimal threshold for the point on the ROC curve nearest the corner with sensitivity = 1 and specificity = 1 was identified and is indicated on the curve. Values of AUROC, optimal sensitivity, optimal specificity, and threshold parameter for the three ROC curves are given in Table II.
Fig. 7.
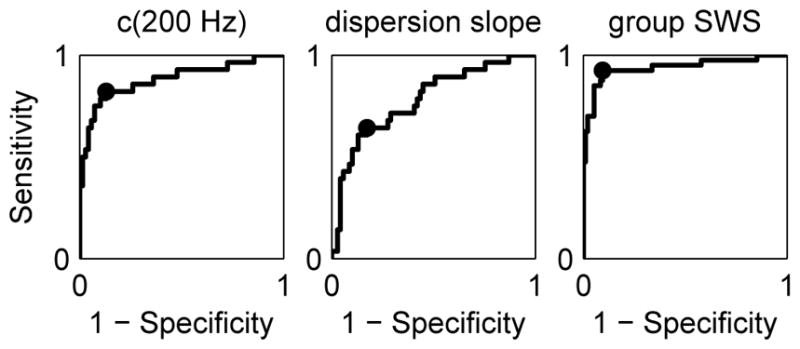
ROC curves for separation of fibrosis stages ≤F2 and ≥F3 obtained using c(200 Hz) (left), dispersion slope (center), and group SWS (right) as the threshold parameter. The optimal sensitivity and specificity is indicated on each plot. Values of AUROC, optimal sensitivity, and optimal specificity are given in Table II.
TABLE II.
Data from ROC curves in fig. 7.
| c(200 Hz) | disperson slope | group SWS | |
|---|---|---|---|
| AUROC | 0.88 | 0.78 | 0.94 |
| Optimal Sensitivity | 0.82 | 0.64 | 0.93 |
| Optimal Specificity | 0.87 | 0.83 | 0.91 |
| Optimal Threshold | 2.59 m/s | 4.78 m/s/kHz | 2.06 m/s |
The ability to distinguish fibrosis stages ≤F2 and ≥F3 was also investigated by evaluating the phase velocity as a function of frequency using (4) and performing the ROC analysis using the threshold parameter c(f). Figure 8 shows frequency dependence of the AUROC (left) and optimal threshold speed (right) determined from this analysis. For the frequency range 0–400 Hz, we observe an increase in AUROC at low frequencies that approaches an approximately constant value for frequencies greater than 200 Hz. In addition, we observe that the optimal threshold speed for best separation of fibrosis stages ≤F2 and ≥F3 varies from roughly 1.8 m/s at f = 0 Hz to roughly 3.3 m/s at f = 400 Hz.
Fig. 8.
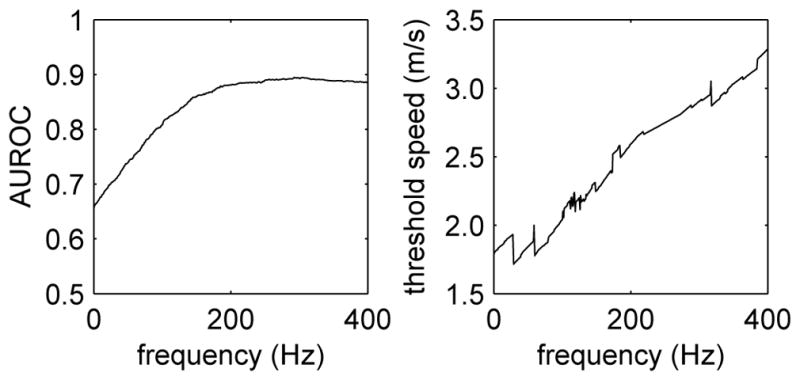
Frequency dependence of the AUROC (left) and optimal threshold speed (right) evaluated from ROC curves constructed using the phase velocity c(f) from (4) as the threshold parameter.
D. Steatosis Grades in Human Liver
Figure 9 shows ROC curves for separation of low steatosis with grades ≤S1 from high steatosis with grades ≥S2 using c(200 Hz) (left), dispersion slope (center), and group SWS (right) as the threshold parameter. Values of AUROC for the three cases are 0.49, 0.47, and 0.49, respectively. We observe that the ROC curves are roughly diagonal with AUROC values approximately equal to 0.5. Thus, these observations agree qualitatively with ROC curves characteristic of random chance and indicate that these parameters are unable to distinguish between steatosis grades in this patient population.
Fig. 9.
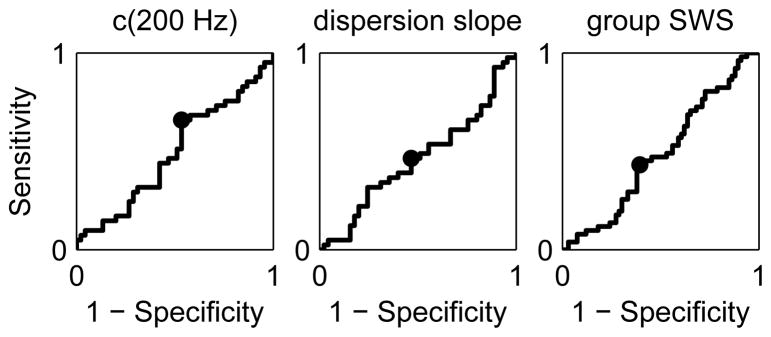
ROC curves for separation of steatosis grades ≤S1 and ≥S2 obtained using c(200 Hz) (left), dispersion slope (center), and group SWS (right) as the threshold parameter. The optimal sensitivity and specificity is indicated on each plot. Values of AUROC for the three cases are 0.49, 0.47, and 0.49, respectively.
V. Discussion
Clinical studies using SWEI to stage liver fibrosis have consistently shown increases in SWS with increasing fibrosis severity; however, the SWS thresholds to distinguish different fibrosis stages vary [6], [7]. There are many possible physiologic sources of variability between patients and studies (e.g., disease etiology, food intake status, etc. [33]); however, the inadequate treatment of viscosity in SWS reconstruction algorithms may play a significant role, as we have demonstrated in the differences between group SWS estimates and dispersive analyses using the linear dispersion model. These differences are consistent with the findings of other studies. In healthy volunteers, Muller et al. reported SWS dispersion over the frequency range of 60 to 390 Hz using ShearWave Elastography. The SWS associated with the lowest frequency (1.2 m/s) was in good agreement with reports from the literature obtained at 50 Hz with the FibroScan and MRE measurements; however, the group SWS for these data was higher (1.48 m/s) [11]. Thus, one would expect that if the bandwidth of the shearwave excitations differed between commercial systems, the group SWS would vary as well, which could lead to heterogeneity between SWS thresholds for different fibrosis stages.
The spatial frequency content of an ARFI induced shearwave is dictated by the excitation’s spatial beamwidth, which was consistent for all human data presented herein since the same ARF focal configuration was used for all study subjects. The corresponding temporal frequency content is a function of the excitation beamwidth and duration, the material stiffness, and shear attenuation. The group SWS characterized using a purely elastic, single-parameter material model in dispersive media can be considered the weighted-mean of the speeds associated with all the frequencies present in the excitation.
One of the most significant findings presented herein is the investigation of the SWS threshold variability with frequency for fibrosis staging. The AUROC does not vary appreciably for frequencies greater than ~200 Hz when separating fibrosis stages ≤F2 from stages ≥F3 (Fig. 8, left); however, the optimal threshold for separating these fibrosis stages is shown to increase with frequency over a range from 1.8–3.3 m/s for frequencies in the range 0–400 Hz (Fig. 8, right). This is not surprising due to the dispersive nature of liver tissue; however, it does have implications when comparing hepatic shearwave speed measurements made using different imaging systems and different excitation focal configurations. These data may explain, in part, differences in thresholds reported in the clinical literature obtained using different systems [6]. It may be that the heterogeneity among fibrosis-stage thresholds could be reduced if a normalization factor based upon the frequency content of the shearwave could be identified.
One of the challenges in characterizing dispersion in the data from our study was the relatively poor data quality, which is typical of SWEI data in the NAFLD patient population. The use of 2D-FT data combined with the Radon-like sum enabled robust characterization of dispersion. Even with this method, only 98 of the 135 patients had sufficient SNR to be included in the dispersion analysis. Additionally, this method required the use of an assumed material model (i.e., the linear dispersion model (4)), and thus, conclusions drawn are subject to the validity of the assumptions in the model.
A key assumption in the 2D-FT and Radon-like sum analysis method used herein is that the results obtained are characteristic of the material properties in liver. To test this assumption, we applied the analysis procedure to data sets from simulations that had been constructed to model the experimental excitation and shear wave propagation in a viscoelastic medium. Data from 58 simulation data sets were identified as having 2D-FT data similar to that observed in human liver for our focal configuration, and Fig. 4 compares the results from these 58 cases using the experimental analysis procedure with the true results calculated from the known material properties used in the simulation. This comparison show that the results obtained using the 2D-FT and Radon-like sum method are well-correlated with the true results and are also biased relative to the true results. Of course, the actual viscoelastic properties of human liver are not known, and it is not possible to determine the degree of bias introduced when analyzing the experimental data. Nevertheless, because of the high degree of correlation between the experimental and true results presented in Fig. 4, we conclude that our analysis procedures can be used to characterize the relative viscoelastic properties of liver. Thus, numerical results such as shown in Fig. 6 could be systematically biased, but results such as the ROC curve analyses which depend on relative viscoelastic properties should not be affected by the experimental analysis procedures used here.
AUROC analysis was performed in the context of differentiating fibrosis stages ≤F2 from stages ≥F3 using the parameters c(200 Hz) and dc/df from the linear dispersion model, and also the group SWS. As shown in Fig. 7 and Table II, each material parameter could be used to identify significant fibrosis, with slightly better AUROC values obtained using the group SWS compared to c(200 Hz), and a somewhat lower AUROC value obtained using the dispersion slope. These findings in the NAFLD patient population are consistent with recent findings comparing the performance of SWEI-based group SWS and dispersion analyses in hepatic fibrosis staging in a cohort of 35 liver disease patients of all etiologies [12], as well as a cohort of 120 chronic liver disease patients [17].
Finally, it has been hypothesized that hepatic shearwave speed may vary with steatosis, but recent studies find no correlation with steatosis and hepatic stiffness derived from group SWS measurements [15], [34], [35]. Our findings are consistent with these conclusions, both when analyzing group SWS and higher order viscoelastic metrics. In Fig. 9, AUROC curves for the different model parameters (c(200 Hz), dc/df, and group SWS) are provided for separation of steatosis grades ≤S1 from grades ≥S2 in our patient data. There is no correlation between steatosis and any of the material model parameters, as evidenced by the AUROC values near 0.5 for each parameter. This finding is consistent with a recent report investigating shearwave dispersion using shearwave spectroscopy in a cohort of chronic liver disease patients [17]. While it has been hypothesized that the accumulation of fat in steatosis might be associated with increased viscosity in these livers, this is not the case in these data. It should be noted that the intra-cellular nature of the accumulation of fat in liver steatosis may limit its impact on the inter-cellular collagen network that is likely modulating SWS in the context of fibrosis. Differences between intra- and inter-cellular changes in microanatomy may change the way that SWS is modulated in the context of different pathologies.
VI. Conclusion
We have presented a robust, model-based algorithm using a linear disperison model for performing shearwave dispersion analyses in NAFLD patient SWEI data for comparison with simple group SWS estimates. The use of simplified elastic material models and group SWS estimates appears to be sufficient for staging liver fibrosis, while neither elastic nor viscoelastic shearwave-derived parameters are correlated with hepatic steatosis in this patient population. For hepatic fibrosis staging, comparable AUROC values of ~0.9 can be achieved using frequencies ≥ 200 Hz. At the same time, the optimal threshold speed c(f) for separation of low and high fibrosis stages increases from 1.8 m/s to 3.3 m/s for frequencies in the range 0 – 400 Hz, and thus it may be possible to reduce threshold variability between different systems by determining a conversion factor based on excitation frequency.
Acknowledgments
This work was supported by NIH grants R01EB2132, and R01CA142824.
The authors thank the reviewers for many helpful suggestions. We also thank Siemens Health-care, Ultrasound Business Unit, Mountain View, CA for their system support.
Contributor Information
Kathryn R. Nightingale, Department of Biomedical Engineering, Duke University, Durham, NC, 27708-0281 USA, see https://kathynightingalelab.pratt.duke.edu/.
Ned C. Rouze, Department of Biomedical Engineering, Duke University, Durham, NC, 27708-0281 USA.
Stephen J. Rosenzweig, Department of Biomedical Engineering, Duke University, Durham, NC, 27708-0281 USA.
Michael H. Wang, Department of Biomedical Engineering, Duke University, Durham, NC, 27708-0281 USA.
Manal F. Abdelmalek, Duke University Medical Center
Cynthia D. Guy, Duke University Medical Center
Mark L. Palmeri, Department of Biomedical Engineering, Duke University, Durham, NC, 27708-0281 USA.
References
- 1.Sarvazyan AP, Rudenko OV, Swanson SD, Fowlkes JB, Emelianov SY. Shear wave elasticity imaging: a new ultrasonic technology of medical diagnostics. Ultrasound Med Biol. 1998;24(9):1419–1435. doi: 10.1016/s0301-5629(98)00110-0. [DOI] [PubMed] [Google Scholar]
- 2.Nightingale K, McAleavey S, Trahey G. Shear-wave generation using acoustic radiation force: in vivo and ex vivo results. Ultrasound Med Biol. 2003;29(12):1715–1723. doi: 10.1016/j.ultrasmedbio.2003.08.008. [DOI] [PubMed] [Google Scholar]
- 3.Bercoff J, Tanter M, Fink M. Supersonic shear imaging: a new technique for soft tissue elasticity mapping. IEEE Trans Ultrason Ferroelectr Freq Control. 2004;51(4):396–409. doi: 10.1109/tuffc.2004.1295425. [DOI] [PubMed] [Google Scholar]
- 4.Chen S, Fatemi M, Greenleaf JF. Quantifying elasticity and viscosity from measurement of shear wave speed dispersion. J Acoust Soc Am. 2004;115(6):2781–2785. doi: 10.1121/1.1739480. [DOI] [PubMed] [Google Scholar]
- 5.Poynard T, Munteanu M, Luckina E, Perazzo H, Ngo Y, Royer L, Fedchuk L, Sattonnet F, Pais R, Lebray P, Rudler M, Thabut D, Ratziu V. Liver fibrosis evaluation using real-time shear wave elastography: applicability and diagnostic performance using methods without a gold standard. J Hepatol. 2013;58(5):928–35. doi: 10.1016/j.jhep.2012.12.021. [DOI] [PubMed] [Google Scholar]
- 6.Friedrich-Rust M, Nierhoff J, Lupsor M, Sporea I, Fierbinteanu-Braticevici C, Strobel D, Takahashi H, Yoneda M, Suda T, Zeuzem S, Herrmann E. Performance of acoustic radiation force impulse imaging for the staging of liver fibrosis: a pooled meta-analysis. J Viral Hepatitis. 2012;19(2):e212–e219. doi: 10.1111/j.1365-2893.2011.01537.x. [DOI] [PubMed] [Google Scholar]
- 7.Cosgrove D, Piscaglia F, Bamber J, Bojunga J, Correas JM, Gilja OH, Klauser AS, Sporea I, Calliada F, Cantisani V, D’Onofrio M, Drakonaki EE, Fink M, Friedrich-Rust M, Fromageau J, Havre RF, Jenssen C, Ohlinger R, Săftoiu A, Schaefer F, Dietrich CF. EFSUMB guidelines and recommendations on the clinical use of ultrasound elastography. Part 2: clinical applications. Ultraschall Med. 2013;34(3):238–253. doi: 10.1055/s-0033-1335375. [DOI] [PubMed] [Google Scholar]
- 8.Liu Z, Bilston L. On the viscoelastic character of liver tissue: experiments and modelling of the linear behaviour. Biorheology. 2000;37(3):191–201. [PubMed] [Google Scholar]
- 9.Kiss MZ, Varghese T, Hall TJ. Viscoelastic characterization of in vitro canine tissue. Phys Med Biol. 2004;49(18):4207–4218. doi: 10.1088/0031-9155/49/18/002. [DOI] [PMC free article] [PubMed] [Google Scholar]
- 10.Asbach P, Klatt D, Hamhaber U, Braun J, Somasundaram R, Hamm B, Sack I. Assessment of liver viscoelasticity using multifrequency MR elastography. Magn Reson Med. 2008;60(2):373–379. doi: 10.1002/mrm.21636. [DOI] [PubMed] [Google Scholar]
- 11.Muller M, Gennisson JL, Deffieux T, Tanter M, Fink M. Quantitative viscoelasticity mapping of human liver using supersonic shear imaging: preliminary in vivo feasibility study. Ultrasound Med Biol. 2009;35(2):219–229. doi: 10.1016/j.ultrasmedbio.2008.08.018. [DOI] [PubMed] [Google Scholar]
- 12.Chen S, Sanchez W, Callstrom MR, Gorman B, Lewis JT, Sanderson SO, Greenleaf JF, Xie H, Shi Y, Pashley M, Shamdasani V, Lachman M, Metz S. Assessment of liver viscoelasticity by using shear waves induced by ultrasound radiation force. Radiology. 2013;266(3):964–970. doi: 10.1148/radiol.12120837. [DOI] [PMC free article] [PubMed] [Google Scholar]
- 13.Barry CT, Hah Z, Partin A, Mooney RA, Chuang KH, Augustine A, Almudevar A, Cao W, Rubens DJ, Parker KJ. Mouse liver dispersion for the diagnosis of early-stage fatty liver disease: a 70-sample study. Ultrasound Med Biol. 2014;40(4):704–713. doi: 10.1016/j.ultrasmedbio.2013.10.016. [DOI] [PubMed] [Google Scholar]
- 14.Garteiser P, Doblas S, Daire JL, Wagner M, Leitao H, Vilgrain V, Sinkus R, Van Beers BE. MR elastography of liver tumours: value of viscoelastic properties for tumour characterisation. Eur Radiol. 2012;22(10):2169–2177. doi: 10.1007/s00330-012-2474-6. [DOI] [PubMed] [Google Scholar]
- 15.Palmeri ML, Wang MH, Rouze NC, Abdelmalek MF, Guy CD, Moser B, Diehl AM, Nightingale KR. Noninvasive evaluation of hepatic fibrosis using acoustic radiation force-based shear stiffness in patients with nonalcoholic fatty liver disease. J Hepatol. 2011;55(3):666–72. doi: 10.1016/j.jhep.2010.12.019. [DOI] [PMC free article] [PubMed] [Google Scholar]
- 16.Ophir J, Céspedes I, Ponnekanti H, Yazdi Y, Li X. Elastography: a quantitative method for imaging the elasticity of biological tissues. Ultrasonic Imaging. 1991 Apr;13(2):111–134. doi: 10.1177/016173469101300201. [DOI] [PubMed] [Google Scholar]
- 17.Deffieux T, Gennisson J-L, Fink M, Tanter M, Bousquet L, Amroun D, Corouge M, Mallet V, Pol S. Shear wave dispersion for fibrosis, steatosis and activity staging. IEEE UFFC Ultrasonics Symposium Proceedings; Prague. 2013; pp. 527–530. [Google Scholar]
- 18.Hall TJ, Milkowski A, Garra B, Carson P, Palmeri M, Nightingale K, Lynch T, Alturki A, Andre M, Audiere S, Bamber J, Barr R, Bercoff J, Bercoff J, Bernal M, Brum J, Chan HW, Chen S, Cohen-Bacrie C, Couade M, Daniels A, DeWall R, Dillman J, Ehman R, Franchi-Abella SF, Fromageau J, Gennisson J-L, Henry JP, Ivancevich N, Kalin J, Kohn S, Kugel J, Lee K, Liu NI, Loupas T, Mazernik J, McAleavey S, Miette V, Metz S, Morel BM, Nelson T, Nordberg E, Oudry J, Padwal M, Rouze N, Samir A, Sandrin L, Schaccitti J, Schmitt C, Shamdasani V, Song P, Switalski P, Wang M, Wear K, Xie H, Zhao H. RSNA/QIBA: shear wave speed as a biomarker for liver fibrosis staging. IEEE UFFC Ultrasonics Symposium Proceedings; Prague. 2013; pp. 397–400. [Google Scholar]
- 19.Deffieux T, Montaldo G, Tanter M, Fink M. Shear wave spectroscopy for in vivo quantification of human soft tissues visco-elasticity. IEEE Trans Med Imaging. 2009;28(3):313–322. doi: 10.1109/TMI.2008.925077. [DOI] [PubMed] [Google Scholar]
- 20.Deffieux T, Gennisson JL, Bercoff J, Tanter M. On the effects of reflected waves in transient shear wave elastography. IEEE Trans Ultrason Ferroelectr Freq Control. 2011;58(10):2032–2035. doi: 10.1109/TUFFC.2011.2052. [DOI] [PubMed] [Google Scholar]
- 21.Catheline S, Gennisson JL, Delon G, Fink M, Sinkus R, Abouelkaram S, Culioli J. Measuring of viscoelastic properties of homogeneous soft solid using transient elastography: an inverse problem approach. J Acoust Soc Am. 2004;116(6):3734–3741. doi: 10.1121/1.1815075. [DOI] [PubMed] [Google Scholar]
- 22.Wang MH, Palmeri ML, Rotemberg VM, Rouze NC, Nightingale KR. Improving the robustness of time-of-flight based shear wave speed reconstruction methods using RANSAC in human liver in vivo. Ultrasound Med Biol. 2010;36(5):802–13. doi: 10.1016/j.ultrasmedbio.2010.02.007. [DOI] [PMC free article] [PubMed] [Google Scholar]
- 23.Loupas T, Peterson RB, Gill RW. Experimental evaluation of velocity and power estimation for ultrasound blood flow imaging, by means of a two-dimensional autocorrelation approach. IEEE Trans Ultrason Ferroelectr Freq Control. 1995;42(4):689–699. [Google Scholar]
- 24.Palmeri ML, Wang MH, Dahl JJ, Frinkley KD, Nightingale KR. Quantifying hepatic shear modulus in vivo using acoustic radiation force. Ultrasound Med Biol. 2008;34(4):546–558. doi: 10.1016/j.ultrasmedbio.2007.10.009. [DOI] [PMC free article] [PubMed] [Google Scholar]
- 25.Kleiner DE, Brunt EM, Van Natta M, Behling C, Contos MJ, Cummings OW, Ferrell LD, Liu YC, Torbenson MS, Unalp-Arida A, Yeh M, McCullough AJ, Sanyal AJ. Design and validation of a histological scoring system for nonalcoholic fatty liver disease. Hepatology. 2005;41(6):1313–1321. doi: 10.1002/hep.20701. [DOI] [PubMed] [Google Scholar]
- 26.Song P, Zhao H, Urban MW, Manduca A, Pislaru SV, Kinnick RR, Pislaru C, Greenleaf JF, Chen S. Improved shear wave motion detection using pulse-inversion harmonic imaging with a phased array transducer. IEEE Trans Med imaging. 2013;32(12):2299–2310. doi: 10.1109/TMI.2013.2280903. [DOI] [PMC free article] [PubMed] [Google Scholar]
- 27.Doherty JR, Dahl JJ, Trahey GE. Harmonic tracking of acoustic radiation force-induced displacements. IEEE Trans Ultrason Ferroelectr Freq Control. 2013;60(11):2347–2358. doi: 10.1109/TUFFC.2013.6644738. [DOI] [PMC free article] [PubMed] [Google Scholar]
- 28.Palmeri ML, Xu D, Zhai L, Nightingale KR. Acoustic radiation force based quantification of tissue shear modulus within the region of excitation. Proceedings of the 2008 IEEE Ultrasonics Symposium; Beijing. 2008; pp. 2009–2012. [Google Scholar]
- 29.Nenadic I, Urban MW, Qiang B, Chen S, Greenleaf J. Model-free quantification of shear wave velocity and attenuation in tissues and its in vivo application. J Acoust Soc Am. 2013;134:4011. [Google Scholar]
- 30.Rouze NC, Wang MH, Palmeri ML, Nightingale KR. Robust estimation of time-of-flight shear wave speed using a radon sum transformation. 2010;57(12):2662–2670. doi: 10.1109/TUFFC.2010.1740. [DOI] [PMC free article] [PubMed] [Google Scholar]
- 31.Palmeri ML, Sharma AC, Bouchard RR, Nightingale RW, Nightingale KR. A finite-element method model of soft tissue response to impulsive acoustic radiation force. IEEE Trans Ultrason Ferroelectr Freq Control. 2005;52(10):1699–1712. doi: 10.1109/tuffc.2005.1561624. [DOI] [PMC free article] [PubMed] [Google Scholar]
- 32.Jensen JA, Svendsen NB. Calculation of pressure fields from arbitrarily shaped, apodized, and excited ultrasound transducers. IEEE Trans Ultrason Ferroelectr Freq Control. 1992;39(2):262–267. doi: 10.1109/58.139123. [DOI] [PubMed] [Google Scholar]
- 33.Popescu A, Bota S, Sporea I, Sirli R, Danila M, Racean S, Suseanu D, Gradinaru O, Siegfried CI. The influence of food intake on liver stiffness values assessed by acoustic radiation force impulse elastography-preliminary results. Ultrasound Med Biol. 2013;39(4):579–584. doi: 10.1016/j.ultrasmedbio.2012.11.013. [DOI] [PubMed] [Google Scholar]
- 34.Ferraioli G, Tinelli C, Zicchetti M, Above E, Poma G, Di Gregorio M, Filice C. Reproducibility of real-time shear wave elastography in the evaluation of liver elasticity. Eur J Radiol. 2012;81(11):3102–3106. doi: 10.1016/j.ejrad.2012.05.030. [DOI] [PubMed] [Google Scholar]
- 35.Crespo G, Fernández-Varo G, Mariño Z, Casals G, Miquel R, Martínez SM, Gilabert R, Forns X, Jiménez W, Navasa M. ARFI, FibroScan, ELF, and their combinations in the assessment of liver fibrosis: a prospective study. J Hepatol. 2012;57(2):281–287. doi: 10.1016/j.jhep.2012.03.016. [DOI] [PubMed] [Google Scholar]


