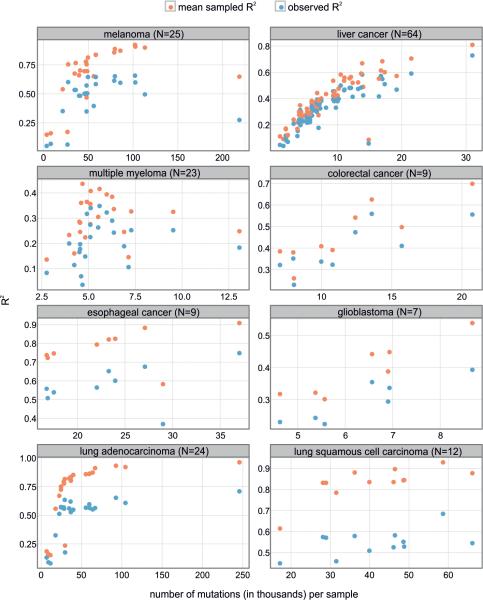
Extended Data Figure 5.
Sampling variance. Red: The squared correlation coefficient (R2) between the observed mutational profile and the profiles predicted by Random Forest. Blue: the maximal attainable variance explained, calculated as the average correlation coefficient squared (R2) between the mutational profiles predicted by Random Forest and 100 simulated mutational profiles modeled as a Poisson distribution with the mean predicted by epigenomic features. N – number of individual cancers per cancer type.

