Abstract
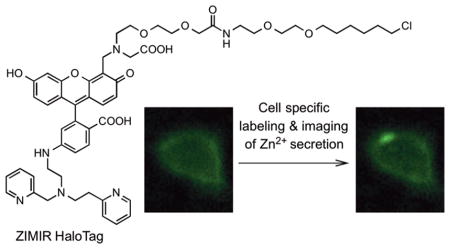
Numerous mammalian cells contain Zn2+ in their secretory granules. During secretion, Zn2+ is coreleased with granular cargos into extracellular medium so Zn2+ serves as a convenient surrogate marker for tracking the dynamics of secretion. Fluorescent Zn2+ sensors that can be selectively targeted to cells of interest would be invaluable tools for imaging Zn2+ release in multicellular systems including tissues and live animals. Exploiting the HaloTag labeling technology and using an optimized linker, we have engineered a fluorescent Zn2+ indicator that displayed a 15-fold fluorescence enhancement upon Zn2+ binding while reacting efficiently with a HaloTag enzyme in a cellular environment. Two-color imaging of ZIMIR-HaloTag and a red-emitting calcium indicator in pancreatic islet beta cells demonstrated that photoactivation of a channelrhodopsin was able to induce exocytosis of Zn2+/insulin granules and revealed heterogeneity in secretory activity along the cell membrane that was uncoupled from cellular Ca2+ activity. This integrated photonic approach for imaging and controlling the release of large dense core granules provides exquisite cellular selectivity and should facilitate future studies of stimulus-secretion coupling and paracrine signaling in secretory cells.
Regulated secretion is an essential biological process that operates in numerous secretory cells including neurons, endocrine cells, and exocrine cells.1–3 Understanding mechanisms governing regulated secretion is not only an important topic in basic biological and biomedical research but may also offer insights to facilitate devising effective treatments against human diseases caused by defective secretory activity.4,5 Such studies would be greatly facilitated by imaging probes and techniques that can monitor the dynamics of regulated secretion in real time. Because of their superb sensitivity of detection in biological systems, fluorescent sensors for tracking specific secretory events remain one of the most sought-after targets in probe engineering.6
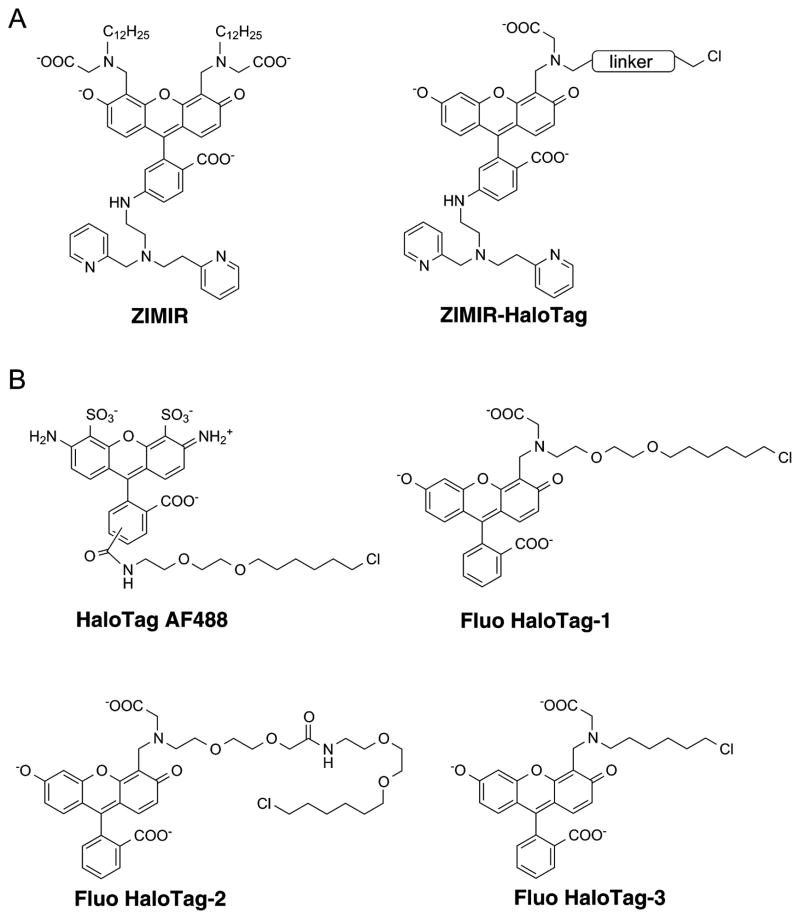
Exploiting the facts that a number of secretory granules contain a high level of zinc ion (Zn2+)7 and that Zn2+ is coreleased with secretory cargos including insulin during secretion, we recently developed a fluorescent zinc indicator, ZIMIR (Figure 1), for monitoring Zn2+/insulin release.8–11 Insulin is a peptide hormone secreted by islet beta cells in the pancreas. It forms a cocrystal with Zn2+ in the insulin granule. Malfunction of insulin secretion in beta cells represents a primary event in the pathogenesis of diabetes, a disease affecting more than 380 million people worldwide.
Figure 1.
(A) Structure of ZIMIR and the design of ZIMIR-HaloTag. ZIMIR-HaloTag contains a fluorescent zinc sensor and a reactive chloroalkane handle. (B) Structures of HaloTag AF488 and three fluorescein-based model compounds (Fluo HaloTag-1, -2, and -3) designed to optimize the linker length suitable for ZIMIR-HaloTag.
To study the physiological regulation of insulin/Zn2+ release in vivo, it would be desirable to image their secretion dynamics in intact pancreas of live animals. While ZIMIR has been successfully applied to image insulin/Zn2+ release in isolated beta cells in vitro,8–11 it remains challenging to apply ZIMIR to monitor insulin/Zn2+ release in islet beta cells in vivo. A major obstacle is how to selectively deliver ZIMIR to islet beta cells in a live animal. ZIMIR is an amphipathic molecule containing a pair of lipophilic dodecyl chains that anchors to the cell plasma membrane through hydrophobic interactions. While convenient for labeling cultured cells in vitro, this labeling strategy lacks cell specificity and can not be applied to mark beta cells in an animal through systemic administration (via tail vein injection for example).
As a part of our probe development program, we have been developing new imaging sensors and labeling strategies for studying insulin release in vivo. In the study reported here, we explored using a genetically encoded protein label, HaloTag, to confer cell targeting specificity of small synthetic fluorescent Zn2+ sensors. HaloTag is a genetically encoded protein tag based on a modified haloalkane dehalogenase from bacterium Rhodococcus.12 It is relatively small (33 kDa), monomeric, and expresses well in mammalian cells either by itself or as fusion proteins. When reacting with substrates containing a haloalkane moiety, HaloTag forms a stable covalent bond with the substrate after displacing a halide through a nucleophilic attack. Since the formation of the covalent bond between HaloTag and a haloalkane substrate is specific and occurs quickly in aqueous solutions, HaloTag has become a popular tool for tagging proteins, organelles, and cells.13
RESULTS AND DISCUSSION
Design of ZIMIR-HaloTag and Model Compounds Study
To engineer ZIMIR into a HaloTag substrate, we designed ZIMIR-HaloTag by replacing the pair of dodecyl chains in ZIMIR with a single HaloTag reactive site containing an alkyl chloride (Figure 1A). To determine a suitable linker for connecting the zinc sensing fluorophore with chloride, we initially considered using the linker that has been optimized for the majority of the commercially available HaloTag substrates.12 This linker contains two units of oxyethylene group and a hexyl chloride (Figure 1B, illustrated using HaloTag AF488 as an example). To test the suitability of using this linker for preparing ZIMIR-HaloTag, we designed a model compound, Fluo HaloTag-1 (Figure 1B), by introducing the linker to the 4′-aminomethyl group of a fluorescein derivative.
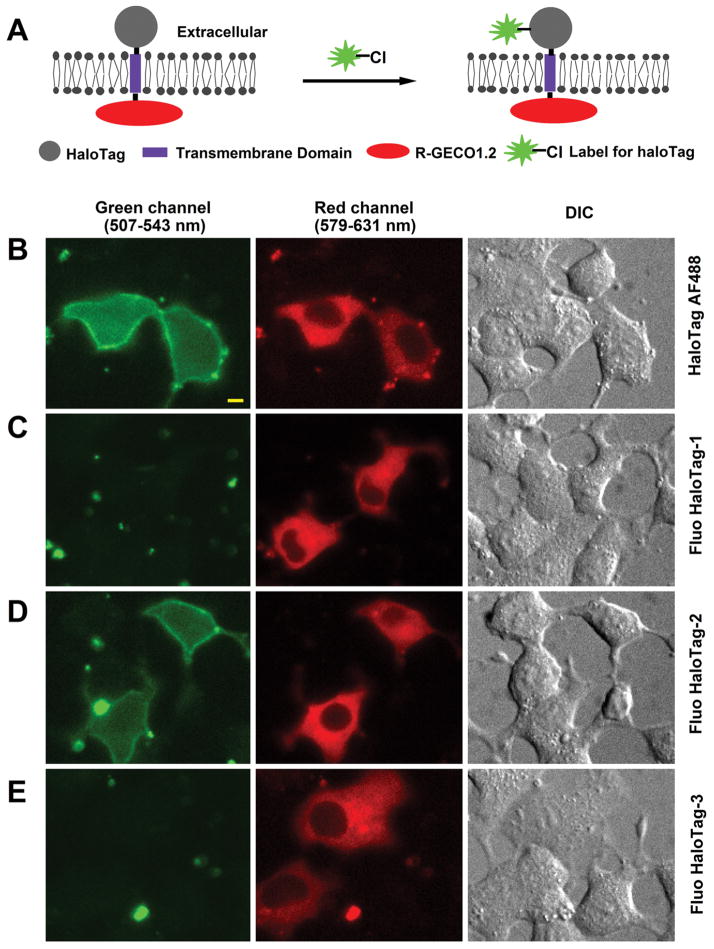
We synthesized Fluo HaloTag-1 through reductive amination of a fluorescein aldehyde (Supplementary Figure 1). To test its cell labeling property, we expressed HaloTag at the cell plasma membrane by fusing its N-terminus to a secretory leader sequence. To facilitate identifying transfected cells, we incorporated a genetically encoded red fluorescent calcium sensor, R-GECO1.2,14 to the construct by placing R-GECO1.2 to the C-terminus of the transmembrane peptide (Figure 2A). The resulting fusion protein, HaloTag/R-GECO1.2, was expected to express in the cell membrane with HaloTag targeted to the outer cell surface while having R-GECO1.2 residing in cells (Figure 2A). Subsequent addition of HaloTag substrates would then label the outer leaflet of the plasma membrane in cells expressing the fusion protein.
Figure 2.
(A) Schematic of a fusion protein (HaloTag/R-GECO1.2) containing HaloTag (extracellular) and R-GECO1.2 (intracellular) linked by a transmembrane peptide. (B–E) Two-color imaging of cells transfected with HaloTag/R-GECO1.2 and labeled with fluorescent HaloTag substrates (1–2 μM) including HaloTag AF488 (B), Fluo HaloTag-1 (C), Fluo HaloTag-2 (D), or Fluo HaloTag-3 (E). The HaloTag substrates were cell impermeable so they only labeled HaloTag displayed on the cell surface. The fusion protein, however, was found to be localized at both the plasma and intracellular membranes after transient transfection. Scale bar = 5 μm.
Adding a cell impermeable HaloTag label, HaloTag AF488 (1 μM), to the transfected beta cells (INS-1 cells) gave rise to the expected membrane labeling (Figure 2B). The labeling only occurred in cells exhibiting red fluorescence resulting from HaloTag/R-GECO1.2 expression, confirming the specificity of HaloTag reaction. Unexpectedly, we detected little cell membrane labeling after adding Fluo HaloTag-1 (Figure 2C). Increasing the concentration of Fluo HaloTag-1 by 10-fold still failed to generate any detectable labeling in cells expressing the fusion protein (data not shown), suggesting that Fluo HaloTag-1 served as a rather poor substrate for the HaloTag enzyme.
Both HaloTag AF488 and Fluo HaloTag-1 used essentially the same linker to connect the chloroalkane reactive handle to the xanthene fluorophore (Figure 1B). While this linker was believed to be optimal for several HaloTag substrates including fluorescein and rhodamine,15 our labeling result using Fluo HaloTag-1 as a model compound suggested that different linkers should be considered for constructing ZIMIR HaloTag. In general, longer linkers increase the spacing between the fluorophore and the HaloTag binding site and hence are expected to alleviate any unfavorable interactions between the fluorophore and the protein. However, a recent report suggested that increasing the linker length of the HaloTag ligands did not necessarily ensure a more efficient reaction with HaloTag. In that study, a series of positron emission tomography (PET) labels with various spacer lengths were tested as substrates of HaloTag. Interestingly, a PET ligand containing a shorter spacer reacted with HaloTag more efficiently than the other two ligands with longer spacers.16
To identify the appropriate linker for derivatizing ZIMIR, we designed two additional model compounds, Fluo HaloTag-2 and Fluo HaloTag-3 (Figure 1B). Compared to Fluo HaloTag-1, Fluo HaloTag-2 incorporated a longer linker by adding two more repeats of oxyethylene group. Fluo HaloTag-3, however, contained only a short hexyl linker. These two model compounds were synthesized similarly as Fluo HaloTag-1 (Supplementary Figures 2 and 3).
Adding Fluo HaloTag-2 to cells expressing HaloTag/R-GECO1.2 labeled their plasma membrane similarly as HaloTag AF488 (Figure 2D). In contrast, Fluo HaloTag-3 failed to show any detectable signal under the same condition (Figure 2E). This confirmed that, for fluorescein derivatives with a 4′-(N-methylcarboxy)-aminomethyl substitution, a longer linker like the one used for Fluo HaloTag-2 is required to turn them into the substrates of HaloTag, whereas shorter linkers including the one commonly used for commercially available HaloTag labels are not suitable.
Syntheses and Characterization of ZIMIR-HaloTag
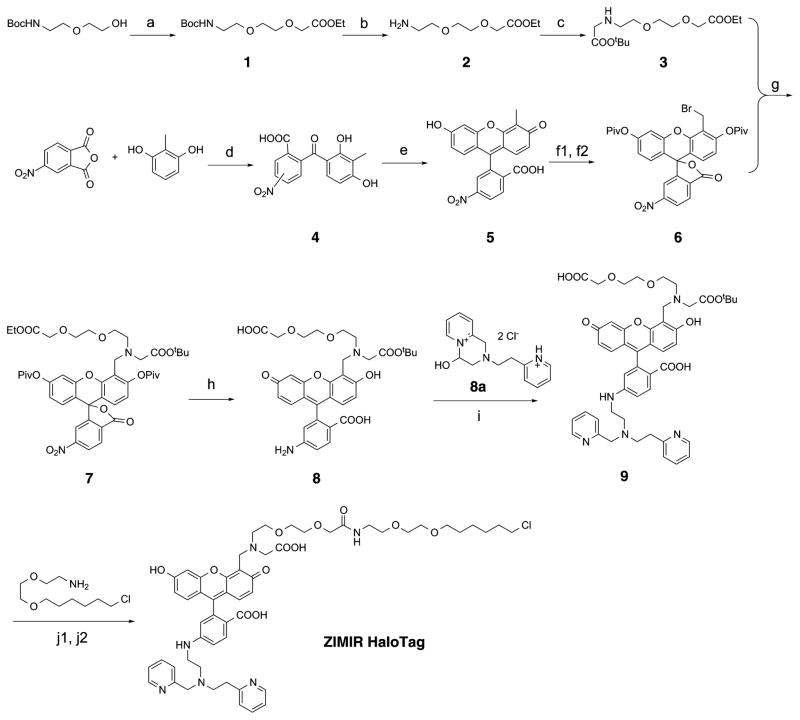
With this information in mind, we designed ZIMIR-HaloTag by incorporating the same linker used for Fluo HaloTag-2. We prepared the compound through a 12-step synthesis (Figure 3). After brominating 4′-methyl-6-nitro fluorescein (compound 5), we protected the pair of phenoxies with pivalates to generate compound 6. Subsequent nucleophilic substitution of benzyl bromide with compound 3 led to the key intermediate 7. Reduction of 6-nitro group with sodium hydrosulfide under refluxing condition simultaneously removed pivalates and the ethyl ester to deprotect the phenoxies and the carboxylate, respectively. The resulting 6-amino group was then condensed with a cyclized pyridine-aldehyde pyridinium salt (compound 8a17) under the reductive condition to yield compound 9. Finally, linker conjugation and deprotection under the acidic condition provided the target molecule, ZIMIR-HaloTag.
Figure 3.
Synthesis of ZIMIR-HaloTag. (a) KOtBu, ethyl bromoacetate, THF, r.t., overnight, 60%; (b) TFA, DCM, r.t., overnight; (c) K2CO3, tert-butyl bromoacetate, CHCl3, r.t., overnight, 50% (steps b and c); (d) AlCl3, nitrobenzene, r.t., 16 h, 91%; (e) CH3SO3H, resorcinol, 90 °C, 24 h; (f1) Cs2CO3, Piv2O, DMF, 2 h, 48%; (f2) NBS, BPO, CCl4, 4 h, 84% (both isomers); (g) NaI, proton sponge, CH3CN, reflux, overnight, 70%; (h) NaSH, MeOH/THF/H2O (4:1:1), reflux, 1 h, 90%; (i) Na2SO4, NaCNBH3, MeOH, 34%; (j1) PyBOP, DMF, r.t., overnight, 50%; (j2) TFA, DCM, r.t., 4 h.
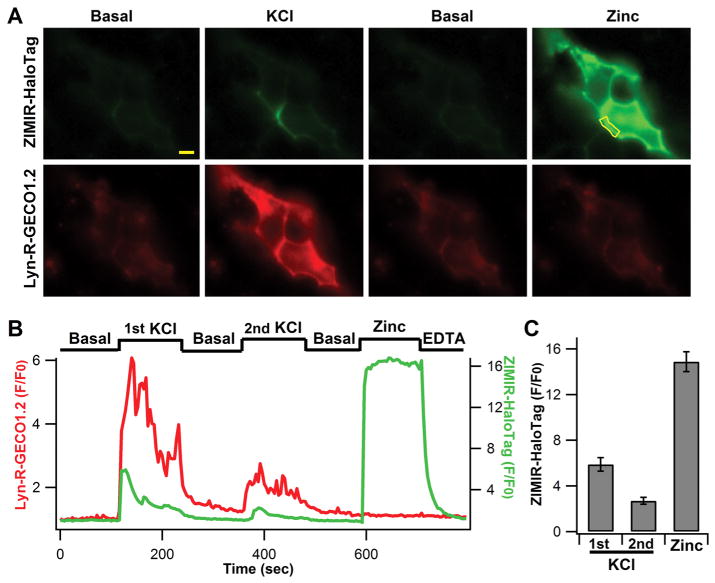
ZIMIR-HaloTag displayed a zinc concentration-dependent fluorescence increase (Figure 4). Overall its fluorescence intensity enhanced nearly 15-fold upon zinc chelation, and it bound zinc with a submicromolar affinity (Kd(Zn2+) = 0.126 μM). To test its cell labeling and imaging properties, we added ZIMIR-HaloTag (0.5–1 μM) to beta cells coinfected with the membrane targeted HaloTag (pDisplay) and Lyn-R-GECO1.2 and performed two-color imaging. Lyn-R-GECO1.2 contained a Lyn Src kinase N-terminal peptide sequence that conferred protein myristoylation for the membrane tethering.14 Compared to HaloTag/R-GECO1.2, which was found in both plasma and cytoplasmic membranes (Figure 2), Lyn-R-GECO1.2 was targeted to the plasma membrane more selectively for reporting subplasmalemmal Ca2+ activity (Figure 5A; cf. Figure 2B). At the basal condition, both ZIMIR-HaloTag and Lyn-R-GECO1.2 showed dim fluorescence (Figure 5), reflecting low [Zn2+] in the extracellular medium and low intracellular [Ca2+]. We subsequently raised KCl in the medium from 5 to 40 mM (equimolar substitution of NaCl) to depolarize cell membranes and to open voltage-gated Ca2+ channels. This caused rapid Ca2+ influx to raise subplasmalemmal [Ca2+] and to induce insulin/Zn2+ release. Both of these events were captured by two-color imaging, which showed a nearly simultaneous elevation of Lyn-R-GECO1.2 signal and ZIMIR-HaloTag fluorescence (Figure 5). However, unlike Ca2+ signal, which showed a rather uniform increase along the plasma membrane, exocytosis of Zn2+ granules was only observed at rather restricted subcellular domains (Figure 5A). This likely reflected the preferential formation of granule fusion sites in those areas. Changing the high KCl solution back to the basal medium immediately abolished cellular Ca2+ elevation and Zn2+ release, and subsequent reapplication of high KCl once again stimulated Ca2+ influx and Zn2+ secretion, albeit at lower amplitudes compared to what were seen during the first episode of KCl (Figure 5B,C). Later, we added a high Zn2+ buffer to the cells as a positive control to check the Zn2+ responsivity of ZIMIR-HaloTag. This caused a ~15-fold increase in ZIMIR-HaloTag signal throughout the plasma membranes in transfected cells, confirming that ZIMIR-HaloTag maintained a large dynamic range in sensing [Zn2+] in a cellular environment.
Figure 4.
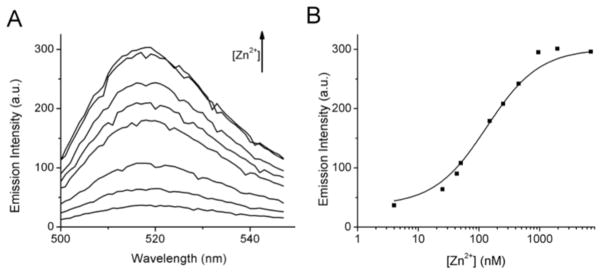
Characterization of ZIMIR-HaloTag. (A) Zn2+-dependent fluorescence enhancement of ZIMIR-HaloTag. Zn2+ concentrations (from bottom to top) were 4, 25, 50, 150, 250, 450, 950, and 1950 nM. (B) Zn2+ titration curve of ZIMIR-HaloTag as measured from its emission at 515 nm. The solid line represents the fit using the equation mentioned in the Methods.
Figure 5.
Live cell imaging of Zn2+/insulin release with ZIMIR-HaloTag. (A) Example images of MIN6 beta cells cotransfected with HaloTag (pDisplay) and Lyn-R-GECO1.2 and sequentially incubated in the basal medium with 10 μM EDTA and 2 μM DPAS, 40 mM KCl, basal medium, and a high Zn2+ buffer (1 μM). Scale bar = 5 μm. (B) Corresponding time courses of Lyn-R-GECO1.2 and ZIMIR-HaloTag fluorescence at the release site (outlined by the yellow line in A). At the end of the experiment, cells were washed with the basal medium containing 2.5 mM EDTA. (C) Average ZIMIR-HaloTag fluorescence enhancement (peak value over baseline, N = 11 cells) in response to repetitive KCl stimulations or addition of 1 μM Zn2+.
Integration of ZIMIR-HaloTag Imaging with Optogenetics for Monitoring and Controlling Zn2+/Insulin Release
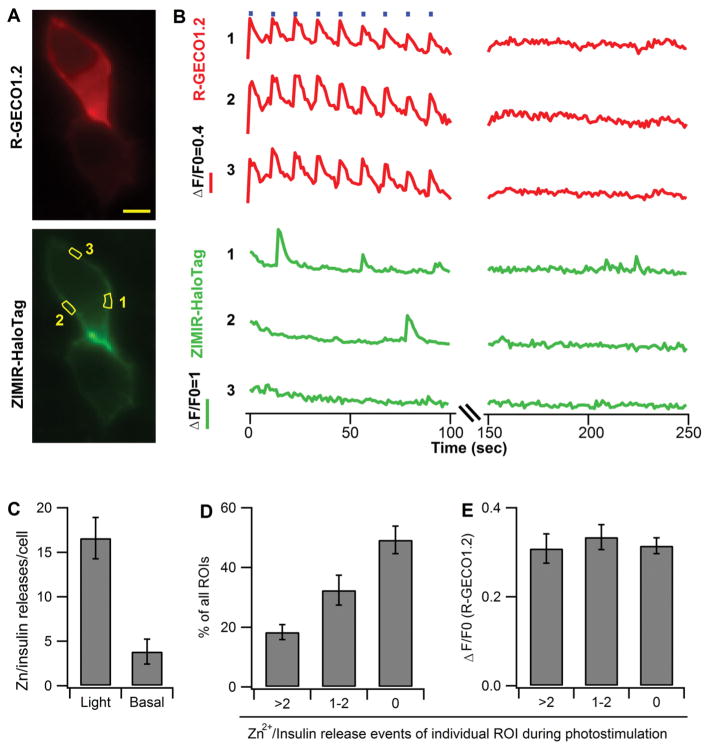
The high responsivity and sensitivity of ZIMIR-HaloTag in detecting Zn2+ changes at the cell surface motivated us to explore the possibility of combining ZIMIR-HaloTag with optogenetics for controlling and monitoring the release of insulin granules. While recent developments in optogenetics and sensor engineering have greatly expanded our ability in manipulating cell excitability for the analysis of neural circuits,18,19 there have been relatively fewer attempts of applying this powerful approach to control hormone release in endocrine cells containing large dense core granules. To explore this possibility, we first prepared a fusion construct, ChR2(T159C)-RGECO1.2, that contained a channelrhodopsin (ChR2(T159C)20) and R-GECO1.2. After infecting MIN6 beta cells with ChR2(T159C)-RGECO1.2 and HaloTag (pDisplay), we identified transfected cells by their red fluorescence and ZIMIR-HaloTag labeling (Figure 6A). We then applied a train of activating blue light (480–500 nm, 1 s × 9 repetitions) to stimulate ChR2(T159C). Each pulse of photoactivation reliably induced intracellular Ca2+ rise as monitored by R-GECO1.2 (Figure 6B and Supplementary Movie 1). Since photoactivation induced Ca2+ rise was only observed in the medium containing a millimolar level of Ca2+ but not in a Ca2+ free medium (Supplementary Figure 4), and because a membrane Ca2+ channel blocker (nifedipine, 50 μM) inhibited ChR2(T159C) induced Ca2+ elevation by more than 70% (data not shown), we concluded that the source of cellular Ca2+ elevation was from Ca2+ entry through voltage operated Ca2+ channels instead of Ca2+ release from intracellular stores. Concurrent imaging of ZIMIR-HaloTag revealed subcellular sites displaying high activity of insulin/Zn2+ release (Figure 6A,B, region of interest 1, for example). However, not every rise in the subplasmalemmal Ca2+ activity led to a secretion event. At individual release sites, it often took several photoactivations and [Ca2+]i rises before the next exocytotic events were observed. This probably reflected the limited number of readily releasable insulin granules near the cell membrane, such that after each release, it would take some time for the cell to replenish the pool before it was capable of launching the next round of granule fusion and exocytosis at the same release zone. In the second half of the experiment, we continued to image R-GECO1.2 and ZIMIR-HaloTag but no longer delivered activating blue light to stimulate ChR2(T159C). Under this condition, [Ca2+]i largely remained at the basal level, while insulin/Zn2+ releases were restricted to a few spontaneous events of rather low amplitudes (Figure 6B,6C and Supplementary Movie 2). To characterize the spatial profile of Zn2+/insulin secretory activity during photostimulation, we analyzed Zn2+/insulin release events in single cells by arbitrarily dividing the entire plasma membrane into small domains (the size of each domain is comparable to the ROIs shown in Figure 6A). The analysis revealed that half of the microdomains exhibited no detectable Zn2+/insulin release (for example, ROI-3 in Figure 6B), and another 30% of the membrane microdomains only showed sparse secretory events characterized by one or two flashes of ZIMIR-HaloTag fluorescence (Figure 6D). The remaining 20% of the cell membrane was more active in Zn2+/insulin secretion and hence represented hot release spots where secretory granules were preferably targeted for membrane fusion. Interestingly, quantification of R-GECO1.2 signal at the cell membrane revealed rather uniform elevation of subplasmalemmal Ca2+ activity during photostimulation (Figure 6E), suggesting that localized Ca2+ mobilization was unlikely to be responsible for the formation of those high activity release zones in MIN6 cells. We speculate that other biochemical events such as the localized assembly of membrane fusion proteins and/or targeted trafficking of insulin granules to selected membrane patches might underlie the observed heterogeneity in exocytotic activity along the cell membrane.
Figure 6.
Activation of channelrhodopsin led to Zn2+/insulin secretion events in discrete membrane domains in beta cells. (A) Example images of MIN6 beta cells cotransfected with ChR2(T159C)-R-GECO1.2 and HaloTag (pDisplay). Scale bar = 5 μm. (B) Time courses of R-GECO1.2 and ZIMIR-HaloTag in three example regions of interest (ROIs 1, 2, and 3 as outlined in panel A) during photostimulation (1 s × 9 repetitions, represented by blue bars at the top of the plot during the first 100 s) and post-stimulation (150–250 s). (C) Average number of observed Zn2+/insulin release events per cell either with light stimulation (1 s × 9 repetitions) or without light activation (basal). N = 6 cells. (D) Histogram of cellular membrane subdomains exhibiting different activities of Zn2+/insulin secretion during ChR2(T159C) activation. The analysis arbitrarily divided the entire plasma membrane of individual cells into small ROIs and counted Zn2+/insulin secretion events within each ROI. N = 6 cells with ~16 ROIs/cell. (E) Corresponding cellular Ca2+ activities of three classes of ROI showing different secretory activities analyzed in panel D.
Thus, we have developed a small synthetic fluorescent Zn2+ sensor that possesses cell targeting specificity through the integration with HaloTag labeling technique. To derivatize ZIMIR into a substrate for the HaloTag enzyme, we optimized the linker length by testing several model compounds. The long linker required for making ZIMIR-HaloTag likely reflected the preference of HaloTag enzyme toward neutral or positively charged substrates over negatively charged ones. For instance, it has been reported that a tetramethylrhodamine ligand (neutral) bound to HaloTag nearly an order of magnitude faster than a fluorescein ligand (negatively charged),15 and it is thought that the entrance to the HaloTag binding pocket consists of a patch of negatively charged side chains. Since the fluorescein derivatives described in this work contained a negatively charged carboxylate at the 4′-aminomethyl position, using a longer linker may help to alleviate charge repulsion when the chloroalkane approached the binding tunnel of HaloTag. There has been few systematic studies on the structure and reactivity relationship of HaloTag and its substrates. Our model compound studies presented here should serve as a useful reference for the future design of HaloTag ligands.
To better understand physiological regulation of Zn2+ granule including insulin granule release, it is highly desirable to image their secretion dynamics in vivo. To enhance the sensitivity of detection and to reduce background or non-specific signal, Zn2+ sensors need to be selectively targeted to cells of interest. Synthetic Zn2+ sensors currently available for monitoring Zn2+ changes near the cell surface all contain a hydrophobic motif for membrane anchoring;8,21,22 hence, they are promiscuous labels with no cellular selectivity. Genetically encoded Zn2+ sensors based on fluorescent proteins23,24 in principle provide an alternative solution since their expression can be controlled using tissue- or cell-specific promoter. However, compared to small synthetic Zn2+ sensors, genetically encoded Zn2+ sensors reported to date display relatively small dynamic range in their Zn2+ response,25,26 and to our knowledge, these Zn2+ sensors have not been applied to image Zn2+ granule secretion in cells. Integrating chemistry with genetics has led to recent advancements in “fusion labeling” technology including SNAP-tag and HaloTag.13 These techniques have been applied to engineer fluorescent sensors for a variety of applications including, among others, imaging secretion of signaling molecules,6,27 tagging cell surface proteins for imaging or cell tracking and capturing,28–30 and mapping Zn2+ in intracellular organelles.31 The success of developing ZIMIR-HaloTag for genetic targeting of Zn2+ sensor to cell surface further illustrates the utility and versatility of this approach and should pave the way for future imaging studies of Zn2+ or insulin release in vivo by combining with high resolution intravital fluorescence imaging techniques for monitoring islet beta cells.32–34 In addition to optical imaging, such a “fusion labeling” approach may also find applications in other imaging modalities including magnetic resonance imaging of Zn2+ secretion in live animals.35
Since ZIMIR-HaloTag only labeled a subset of cells expressing HaloTag, it displayed an impressive dynamic range (15-fold, Figure 5C) when reporting local Zn2+ fluctuations at the cell surface partially owing to the reduced background signal. The high Zn2+ responsivity and sensitivity of ZIMIR-HaloTag enabled us to demonstrate the utility of channelrhodopsin in controlling the release of large dense core granules in islet beta cells. Compared with high KCl stimulation (Figure 5B), activation of channelrhodopsins caused a modest membrane depolarization and cellular Ca2+ elevation that were more reflective of changes within the physiological range (Figure 6B). Using this stimulation protocol in beta cells expressing ChR2, we observed membrane heterogeneity in insulin granule exocytosis that was uncoupled from cellular Ca2+ activity (Figure 6D,E). Future investigation of this phenomenon in intact pancreas using transgenic animals expressing HaloTag on the surface of islet cells will address its physiological implication, which may also help us learn how cells organize and maintain their secretory machineries in vivo.
Last but not least, controlling cell secretion by optogenetics offers distinct advantages including pinpoint accuracy in the onset, duration, location, and repetition of cell activation. Combined with the technique of localized photoactivation to selectively stimulate cells of choice in three dimensions36,37 and with the recent advancements in engineering new channelrhodopsins with blue- or red-shifted action spectrum38,39 to enhance the spectral compatibility with green-emitting fluorescent sensors (like ZIMIR-HaloTag described here), this integrated photonic approach would allow us to activate and track hormone release in a single or a subset of cells while monitoring the response of nearby cells, hence providing fresh opportunities to study how paracrine signaling40,41 or gap junction communication10,42 modulates stimulus-secretion coupling in a cellular network such as the islet of Langerhans.
METHODS
Synthesis
Preparation and characterization of model compounds and ZIMIR-HaloTag are described in detail in the Supporting Information.
Spectroscopic Characterization and Zinc Titration of ZIMIR HaloTag
UV–vis spectra were recorded in a 1 cm path quartz cell on a Shimadzu 2401 PC spectrometer. Fluorescence excitation and emission spectra were recorded on a Fluorolog 3 spectrometer (Jobin-Yvon Horiba, Edison, NJ). Zinc titration was performed using the same procedure as previously reported.8 Briefly, ZIMIR-HaloTag (0.4 μM final concentration) was added to buffered Zn2+ solutions containing 100 mM Hepes (pH 7.5), 10 mM nitrilotriacetic acid (NTA), and varying concentrations of ZnSO4 (0–9 mM) to reach a free Zn2+ concentration between 0.1 and 43 nM. Zn2+ concentrations above 43 nM were not buffered. However, because the commercial Hepes contains a trace amount of divalent metal (≤5 ppm), it was necessary to add a minimum amount of NTA to chelate the residual Zn2+ present in the Hepes solution. We found that adding ~0.5 μM NTA to 100 mM Hepes solution was sufficient to reduce the fluorescence of ZIMIR-HaloTag to the same level as seen in 43 nM (buffered) free Zn2+. Further addition of known amounts of ZnSO4 yielded Zn2+ concentrations above 43 nM. The titration data were plotted and fitted to the equation F = F0 + (Fmax − F0)[Zn2+]/(Kd(Zn2+) + [Zn2+]), where Fmax is the maximum fluorescence intensity, F0 is the baseline fluorescence at free Zn2+ less than 4 nM, and F is the fluorescence intensity at the corresponding free [Zn2+]. The fitting yields an apparent Kd(Zn2+) of 126 nM.
Cell Culture and Transfection
INS-1(832/13) and MIN6 cells were cultured as previously described.8 For cell transfection, INS-1 or MIN6 cells were seeded in 35 mm Petri dishes with glass bottoms (MatTek) and cultured for ~24 h to reach ~50% confluence. Cells were then transfected with 2 μg of plasmid using Metafectene Pro (Biontex) following the manufacturer’s instruction. Cells were cultured for an additional 24–48 h before imaging.
Plasmid Construction
To construct CMVprom-HaloTag/R-GECO1.2, we amplified the HaloTag sequence by PCR from a HaloTag plasmid (NCX-Halo, gift of Dr. M.-J. Lin) using the primers (5′–3′) TCAGATCTGGATCCGAAATCGGTACAGGCTTC and ATTCTGCAGCACGGCCAGCCCGGGGAGCCAGC. The amplified fragment was then digested with BglII and PstI and inserted into the pDisplay vector (Life Technologies). The fragment that contains a Myc epitope and PDGFR transmembrane (TM) domain was amplified from pDisplay vector using the primers (5′–3′) AGTATGCATGAACAAAAACTCATCTCAGAAGAGG and GTCGACAGATCCACCTGATCCGCCACTACCTCCACGTGGC-TTCTTCTGCCAAAGCATG. We subsequently added a 9 amino acid linker (GGSGGSGGS) to the C-terminal of TM domain. Next, we amplified R-GECO1.2 sequence by PCR from pcDNA3.2-R-GECO1.2 (gift of Dr. R. E. Campbell) and assembled the TM domain and R-GECO1.2 by overlap PCR. Finally, to generate HaloTag-TM-R-GECO1.2 plasmid, the assembled TM-R-GECO1.2 fragment was digested with NsiI and XhoI, and the resulting fragment was inserted into pDisplay-HaloTag vector that has been cut with PstI and XhoI.
To generate CMVprom-ChR2(T159C)-R-GECO1.2, we amplified ChR2(T159C) sequence from vector pCI-Synapsin-ChR2(T159C) (Dr. T. Oertner) using the primers CTGGTACCACCATGGATTAT-GGAGGCGCCCTG and ACGGATCCTACCGCGCCAGCCT-CGGCCTCGTCCTC, digested with KpnI and BamHI and ligated into pcDNA3.2-R-GECO1.2 vector. To construct pDisplay-HaloTag plasmid, the HaloTag was PCR-amplified from pOPINHALO7 (Addgene, Plasmid #41117) using primers ACTAGATCTGCAG-AAATCGGTACTGGCTT and ATACTGCAGGCCGGAAATCT-CGAGCGTCGAC. The HaloTag 7 fragment was then digested with BglII and PstI and inserted into pDisplay vector.
Imaging and Photoactivation by Wide-Field Fluorescence Microscopy
Fluorescence imaging was carried out on an inverted wide-field fluorescence microscope (Axiovert 200, Carl Zeiss) equipped with an EMCCD camera (iXon 897, Andor) through a 40× oil objective. Fluorescence excitation was controlled by a lambda DG4 exciter (Sutter Instrument) equipped with a 175 W xenon lamp (PerinElmer, PE175BF). Imaging hardware and acquisition was controlled by Micromanager software (https://www.micro-manager.org/). The typical exposure time for image acquisition was 200–400 ms. Bandpass filters (Chroma Technology) were used for delivering excitation light and for collecting emission signal. ZIMIR excitation, S490/20x; emission, ET525/36; R-GECO1.2 excitation, S555/28x; emission, ET605/52m.
To test HaloTag labeling using the model compounds and HaloTag AF488, INS-1 cells infected with CMVprom-HaloTag/R-GECO1.2 were washed twice with SAB buffer (114 mM NaCl, 4.7 mM KCl, 1.2 mM KH2PO4, 2.5 mM CaCl2, 1.16 mM MgSO4, and 20 mM Hepes, pH 7.3) containing 3 mM glucose, and incubated with 1–2 μM of HaloTag AF488 (Promega) or Fluo HaloTag-1, -2, or -3 for 30 min at r.t. Cells were then washed three times with SAB buffer before imaging. When acquiring R-GECO1.2 images, ionomycin (5 μM) was added to cells to raise cellular Ca2+ level and to enhance R-GECO1.2 signal.
To image KCl stimulated insulin/Zn2+ release using ZIMIR-HaloTag, MIN6 cells were infected with Lyn-R-GECO1.2 and pDisplay-HaloTag for at least 24 h. Cells were washed twice with SAB buffer containing 10 μM EDTA, 2 μM DPAS, and 3 mM glucose. Cells were then incubated with 0.5 μM ZIMIR-HaloTag in the same buffer at r.t. for 20 min in the dark. Cells were then washed three times and imaged in SAB buffer containing 10 μM EDTA, 2 μM DPAS, and 3 mM glucose.
To image channelrhodopsin induced insulin/Zn2+ release, MIN6 cells were coinfected with ChR2(T159C)-R-GECO1.2 and pDisplay-HaloTag for at least 24 h. Cells were washed, labeled, and imaged similarly as just described. To activate ChR2(T159C), we applied a blue light (480–500 nm) for 1 s through the oil objective. To avoid or minimize ChR2(T159C) activation during image acquisition, the exposure time for capturing ZIMIR HaloTag images was reduced to 100 ms.
Supplementary Material
Acknowledgments
We thank R. Campbell and T. Oertner for providing the plasmids encoding R-GECO1.2 and ChR2(T159C), respectively. This work was supported by National Institutes of Health grant R01 GM077593 and Juvenile Diabetes Research Foundation grant 17-2013-494.
Footnotes
Notes
The authors declare no competing financial interest.
ASSOCIATED CONTENT
Additional figures and supporting movies. This material is available free of charge via the Internet at http://pubs.acs.org.
References
- 1.Rorsman P, Braun M. Regulation of insulin secretion in human pancreatic islets. Annu Rev Physiol. 2013;75:155–179. doi: 10.1146/annurev-physiol-030212-183754. [DOI] [PubMed] [Google Scholar]
- 2.Sudhof TC, Rothman JE. Membrane fusion: grappling with SNARE and SM proteins. Science. 2009;323:474–477. doi: 10.1126/science.1161748. [DOI] [PMC free article] [PubMed] [Google Scholar]
- 3.Burgess TL, Kelly RB. Constitutive and regulated secretion of proteins. Annu Rev Cell Biol. 1987;3:243–293. doi: 10.1146/annurev.cb.03.110187.001331. [DOI] [PubMed] [Google Scholar]
- 4.Rutter GA, Varadi A, Tsuboi T, Parton L, Ravier M. Insulin secretion in health and disease: genomics, proteomics and single vesicle dynamics. Biochem Soc Trans. 2006;34:247–250. doi: 10.1042/BST20060247. [DOI] [PubMed] [Google Scholar]
- 5.Lin WJ, Salton SR. The regulated secretory pathway and human disease: insights from gene variants and single nucleotide polymorphisms. Front Endocrinol. 2013;4:96. doi: 10.3389/fendo.2013.00096. [DOI] [PMC free article] [PubMed] [Google Scholar]
- 6.Li WH, Li D. Fluorescent probes for monitoring regulated secretion. Curr Opin Chem Biol. 2013;17:672–681. doi: 10.1016/j.cbpa.2013.04.026. [DOI] [PMC free article] [PubMed] [Google Scholar]
- 7.Frederickson CJ, Koh JY, Bush AI. The neurobiology of zinc in health and disease. Nat Rev Neurosci. 2005;6:449–462. doi: 10.1038/nrn1671. [DOI] [PubMed] [Google Scholar]
- 8.Li D, Chen S, Bellomo EA, Tarasov AI, Kaut C, Rutter GA, Li WH. Imaging dynamic insulin release using a fluorescent zinc indicator for monitoring induced exocytotic release (ZIMIR) Proc Natl Acad Sci USA. 2011;108:21063–21068. doi: 10.1073/pnas.1109773109. [DOI] [PMC free article] [PubMed] [Google Scholar]
- 9.Tarasov AI, Semplici F, Li D, Rizzuto R, Ravier MA, Gilon P, Rutter GA. Frequency-dependent mitochondrial Ca(2+) accumulation regulates ATP synthesis in pancreatic beta cells. Pflugers Arch. 2012;465:543–554. doi: 10.1007/s00424-012-1177-9. [DOI] [PMC free article] [PubMed] [Google Scholar]
- 10.Hodson DJ, Mitchell RK, Bellomo EA, Sun G, Vinet L, Meda P, Li D, Li WH, Bugliani M, Marchetti P, Bosco D, Piemonti L, Johnson P, Hughes SJ, Rutter GA. Lipotoxicity disrupts incretin-regulated human beta cell connectivity. J Clin Invest. 2013;123:4182–4194. doi: 10.1172/JCI68459. [DOI] [PMC free article] [PubMed] [Google Scholar]
- 11.Hodson DJ, Mitchell RK, Marselli L, Pullen TJ, Brias SG, Semplici F, Everett KL, Cooper DM, Bugliani M, Marchetti P, Lavallard V, Bosco D, Piemonti L, Johnson PR, Hughes SJ, Li D, Li WH, Shapiro AM, Rutter GA. ADCY5 couples glucose to insulin secretion in human islets. Diabetes. 2014;63:3009–3021. doi: 10.2337/db13-1607. [DOI] [PMC free article] [PubMed] [Google Scholar]
- 12.Los GV, Encell LP, McDougall MG, Hartzell DD, Karassina N, Zimprich C, Wood MG, Learish R, Ohana RF, Urh M, Simpson D, Mendez J, Zimmerman K, Otto P, Vidugiris G, Zhu J, Darzins A, Klaubert DH, Bulleit RF, Wood KV. HaloTag: a novel protein labeling technology for cell imaging and protein analysis. ACS Chem Biol. 2008;3:373–382. doi: 10.1021/cb800025k. [DOI] [PubMed] [Google Scholar]
- 13.Hinner MJ, Johnsson K. How to obtain labeled proteins and what to do with them. Curr Opin Biotechnol. 2010;21:766–776. doi: 10.1016/j.copbio.2010.09.011. [DOI] [PubMed] [Google Scholar]
- 14.Wu J, Liu L, Matsuda T, Zhao Y, Rebane A, Drobizhev M, Chang YF, Araki S, Arai Y, March K, Hughes TE, Sagou K, Miyata T, Nagai T, Li WH, Campbell RE. Improved orange and red Ca indicators and photophysical considerations for optogenetic applications. ACS Chem Neurosci. 2013;4:963–972. doi: 10.1021/cn400012b. [DOI] [PMC free article] [PubMed] [Google Scholar]
- 15.Encell LP, Friedman Ohana R, Zimmerman K, Otto P, Vidugiris G, Wood MG, Los GV, McDougall MG, Zimprich C, Karassina N, Learish RD, Hurst R, Hartnett J, Wheeler S, Stecha P, English J, Zhao K, Mendez J, Benink HA, Murphy N, Daniels DL, Slater MR, Urh M, Darzins A, Klaubert DH, Bulleit RF, Wood KV. Development of a dehalogenase-based protein fusion tag capable of rapid, selective and covalent attachment to customizable ligands. Curr Chem Genomics. 2012;6:55–71. doi: 10.2174/1875397301206010055. [DOI] [PMC free article] [PubMed] [Google Scholar]
- 16.Hong H, Benink HA, Zhang Y, Yang Y, Uyeda HT, Engle JW, Severin GW, McDougall MG, Barnhart TE, Klaubert DH, Nickles RJ, Fan F, Cai W. HaloTag: a novel reporter gene for positron emission tomography. Am J Transl Res. 2011;3:392–403. [PMC free article] [PubMed] [Google Scholar]
- 17.Zhang XA, Song D, Lippard SJ. A reversible pH-dependent intramolecular pyridine-aldehyde cyclization. J Org Chem. 2008;73:734–737. doi: 10.1021/jo702394v. [DOI] [PubMed] [Google Scholar]
- 18.Bernstein JG, Garrity PA, Boyden ES. Optogenetics and thermogenetics: technologies for controlling the activity of targeted cells within intact neural circuits. Curr Opin Neurobiol. 2012;22:61–71. doi: 10.1016/j.conb.2011.10.023. [DOI] [PMC free article] [PubMed] [Google Scholar]
- 19.Alford SC, Wu J, Zhao Y, Campbell RE, Knopfel T. Optogenetic reporters. Biol Cell. 2013;105:14–29. doi: 10.1111/boc.201200054. [DOI] [PubMed] [Google Scholar]
- 20.Berndt A, Schoenenberger P, Mattis J, Tye KM, Deisseroth K, Hegemann P, Oertner TG. High-efficiency channelrhodopsins for fast neuronal stimulation at low light levels. Proc Natl Acad Sci USA. 2011;108:7595–7600. doi: 10.1073/pnas.1017210108. [DOI] [PMC free article] [PubMed] [Google Scholar]
- 21.Iyoshi S, Taki M, Yamamoto Y. Development of a cholesterol-conjugated fluorescent sensor for site-specific detection of zinc ion at the plasma membrane. Org Lett. 2011;13:4558–4561. doi: 10.1021/ol201746p. [DOI] [PubMed] [Google Scholar]
- 22.Radford RJ, Chyan W, Lippard SJ. Peptide-based targeting of fluorescent zinc sensors to the plasma membrane of live cells. Chem Sci. 2013;4:3080–3084. doi: 10.1039/C3SC50974E. [DOI] [PMC free article] [PubMed] [Google Scholar]
- 23.Vinkenborg JL, Nicolson TJ, Bellomo EA, Koay MS, Rutter GA, Merkx M. Genetically encoded FRET sensors to monitor intracellular Zn2+ homeostasis. Nat Methods. 2009;6:737–740. doi: 10.1038/nmeth.1368. [DOI] [PMC free article] [PubMed] [Google Scholar]
- 24.Qin Y, Dittmer PJ, Park JG, Jansen KB, Palmer AE. Measuring steady-state and dynamic endoplasmic reticulum and Golgi Zn2+ with genetically encoded sensors. Proc Natl Acad Sci USA. 2011;108:7351–7356. doi: 10.1073/pnas.1015686108. [DOI] [PMC free article] [PubMed] [Google Scholar]
- 25.Vinkenborg JL, Koay MS, Merkx M. Fluorescent imaging of transition metal homeostasis using genetically encoded sensors. Curr Opin Chem Biol. 2010;14:231–237. doi: 10.1016/j.cbpa.2009.11.022. [DOI] [PubMed] [Google Scholar]
- 26.Carter KP, Young AM, Palmer AE. Fluorescent sensors for measuring metal ions in living systems. Chem Rev. 2014;114:4564–4601. doi: 10.1021/cr400546e. [DOI] [PMC free article] [PubMed] [Google Scholar]
- 27.Masharina A, Reymond L, Maurel D, Umezawa K, Johnsson K. A Fluorescent Sensor for GABA and Synthetic GABA(B) Receptor Ligands. J Am Chem Soc. 2012;134:19026–19034. doi: 10.1021/ja306320s. [DOI] [PubMed] [Google Scholar]
- 28.Kosaka N, Ogawa M, Choyke PL, Karassina N, Corona C, McDougall M, Lynch DT, Hoyt CC, Levenson RM, Los GV, Kobayashi H. In vivo stable tumor-specific painting in various colors using dehalogenase-based protein-tag fluorescent ligands. Bioconjugate Chem. 2009;20:1367–1374. doi: 10.1021/bc9001344. [DOI] [PMC free article] [PubMed] [Google Scholar]
- 29.So MK, Yao H, Rao J. HaloTag protein-mediated specific labeling of living cells with quantum dots. Biochem Biophys Res Commun. 2008;374:419–423. doi: 10.1016/j.bbrc.2008.07.004. [DOI] [PMC free article] [PubMed] [Google Scholar]
- 30.Svendsen S, Zimprich C, McDougall MG, Klaubert DH, Los GV. Spatial separation and bidirectional trafficking of proteins using a multi-functional reporter. BMC Cell Biol. 2008;9:17. doi: 10.1186/1471-2121-9-17. [DOI] [PMC free article] [PubMed] [Google Scholar]
- 31.Tomat E, Nolan EM, Jaworski J, Lippard SJ. Organelle-specific zinc detection using zinpyr-labeled fusion proteins in live cells. J Am Chem Soc. 2008;130:15776–15777. doi: 10.1021/ja806634e. [DOI] [PMC free article] [PubMed] [Google Scholar]
- 32.Reiner T, Thurber G, Gaglia J, Vinegoni C, Liew CW, Upadhyay R, Kohler RH, Li L, Kulkarni RN, Benoist C, Mathis D, Weissleder R. Accurate measurement of pancreatic islet β-cell mass using a second-generation fluorescent exendin-4 analog. Proc Natl Acad Sci USA. 2011;108:12815–12820. doi: 10.1073/pnas.1109859108. [DOI] [PMC free article] [PubMed] [Google Scholar]
- 33.Speier S, Nyqvist D, Cabrera O, Yu J, Molano RD, Pileggi A, Moede T, Kohler M, Wilbertz J, Leibiger B, Ricordi C, Leibiger IB, Caicedo A, Berggren PO. Noninvasive in vivo imaging of pancreatic islet cell biology. Nat Med. 2008;14:574–578. doi: 10.1038/nm1701. [DOI] [PMC free article] [PubMed] [Google Scholar]
- 34.Coppieters K, Amirian N, von Herrath M. Intravital imaging of CTLs killing islet cells in diabetic mice. J Clin Invest. 2012:119–131. doi: 10.1172/JCI59285. [DOI] [PMC free article] [PubMed] [Google Scholar]
- 35.Lubag AJ, De Leon-Rodriguez LM, Burgess SC, Sherry AD. Noninvasive MRI of beta-cell function using a Zn2+-responsive contrast agent. Proc Natl Acad Sci USA. 2011;108:18400–18405. doi: 10.1073/pnas.1109649108. [DOI] [PMC free article] [PubMed] [Google Scholar]
- 36.Dakin K, Zhao YR, Li WH. LAMP, a new imaging assay of gap junctional communication unveils that Ca2+ influx inhibits cell coupling. Nat Methods. 2005;2:55–62. doi: 10.1038/nmeth730. [DOI] [PubMed] [Google Scholar]
- 37.Dakin K, Li WH. Infrared-LAMP: two-photon uncaging and imaging of gap junctional communication in three dimensions. Nat Methods. 2006;3:959. doi: 10.1038/nmeth1206-959. [DOI] [PubMed] [Google Scholar]
- 38.Govorunova EG, Sineshchekov OA, Li H, Janz R, Spudich JL. Characterization of a highly efficient blue-shifted channelrhodopsin from the marine alga Platymonas subcordiformis. J Biol Chem. 2013;288:29911–29922. doi: 10.1074/jbc.M113.505495. [DOI] [PMC free article] [PubMed] [Google Scholar]
- 39.Klapoetke NC, Murata Y, Kim SS, Pulver SR, Birdsey-Benson A, Cho YK, Morimoto TK, Chuong AS, Carpenter EJ, Tian Z, Wang J, Xie Y, Yan Z, Zhang Y, Chow BY, Surek B, Melkonian M, Jayaraman V, Constantine-Paton M, Wong GK, Boyden ES. Independent optical excitation of distinct neural populations. Nat Methods. 2014;11:338–346. doi: 10.1038/nmeth.2836. [DOI] [PMC free article] [PubMed] [Google Scholar]
- 40.Unger RH, Orci L. Paracrinology of islets and the paracrinopathy of diabetes. Proc Natl Acad Sci USA. 2010;107:16009–16012. doi: 10.1073/pnas.1006639107. [DOI] [PMC free article] [PubMed] [Google Scholar]
- 41.Walker JN, Ramracheya R, Zhang Q, Johnson PR, Braun M, Rorsman P. Regulation of glucagon secretion by glucose: paracrine, intrinsic or both? Diabetes, Obes Metab. 2011;13(Suppl 1):95–105. doi: 10.1111/j.1463-1326.2011.01450.x. [DOI] [PubMed] [Google Scholar]
- 42.Cigliola V, Chellakudam V, Arabieter W, Meda P. Connexins and beta-cell functions. Diabetes Res Clin Pract. 2013;99:250–259. doi: 10.1016/j.diabres.2012.10.016. [DOI] [PubMed] [Google Scholar]
Associated Data
This section collects any data citations, data availability statements, or supplementary materials included in this article.


