

Abstract
CD8 T cells contribute to long-term protection against Listeria monocytogenes infection by differentiating into memory T cells. These rapidly respond to antigen or inflammation upon secondary infection. In this study we used CD8 T cells from OT1 mice and CD4 T cells from OT2 mice expressing a fluorescent chimeric granzyme (GZMB-Tom) protein to monitor the primary response to infection with ovalbumin-expressing L. monocytogenes (Lm-OVA). We show that, unlike poorly responding CD4 T cells, CD8 T cells readily proliferated and expressed high levels of GZMB-Tom as early as 2 days after infection. FACS analysis showed GZMB-Tom expression in undivided CD8 T cells, with its level increasing over one to four divisions. OT1 T cells were visualized in the T-cell zone by confocal microscopy. This showed GZMB-Tom-containing granules oriented towards MHCII-positive cells. Twenty hours later, most OT1 T cells had divided but their level of GZMB-Tom expression was reduced. Recently divided OT1 cells failed to express GZMB-Tom. Fourteen hours after secondary infection, GZMB-Tom was re-expressed in memory OT1 T cells responding either to Lm-OVA or L. monocytogenes. Differences in the activation phenotype and in the splenic distribution of OT1 T cells were observed, depending on the challenge. Notably, OTI T cells with polarized granules were only observed after challenge with cognate antigen. This work showed that the GZMB-Tom knock-in mice in which GZMB-Tom faithfully reproduced GZMB expression, provide useful tools to dissect mechanisms leading to the development of anti-bacterial effector and memory CD8 T cells and reactivation of the memory response to cognate antigen or inflammatory signals.
Keywords: cytolytic T lymphocyte, fluorescent granzyme B, immune response to bacteria, memory T cells
Introduction
Both innate and adaptive immunity are implicated in the immune response to the intracellular bacterium Listeria monocytogenes. Innate immunity leads to the elimination of most bacteria, but the adaptive immune response is necessary to avoid chronic infection (reviewed in ref. 1). Both CD4 and CD8 T cells respond to L.monocytogenes. Production of interferon-γ (IFN-γ) is an essential component of the response, in particular for CD4 T-cell action. CD8 T cells, however, appear to be the main contributors to long-term protective immunity to the bacteria (reviewed in ref. 2). Their expression of perforin was required to provide efficient protection against a secondary infection.3
Although L. monocytogenes normally enter an organism via the intestinal epithelium, the immune response to systemic blood-borne L. monocytogenes infection resides in the spleen and in the liver in mice.1,4 Primary infection can be fought by myeloid cells in the splenic marginal zone of the red pulp (RP), but induction of an adaptive immune response requires CD11c+ dendritic cells (DCs) that carry the bacteria to the T-zone of the splenic white pulp (WP), where antigen stimulation of effector and memory T cells occurs, probably by CD8a+ DCs.5,6 Imaging the intact splenic RP in conditions where the blood flow was maintained, a recent study7 visualized L. monocytogenes a few seconds after injection bound to DCs forming foci in the subcapsular RP. They further observed the continuous recruitment of myelomonocytic cells from the blood to the foci during the infection. From cellular depletion experiments, the authors concluded that the myelomonocytic cells contribute to the control of L. monocytogenes before development of T-cell immunity, whereas subcapsular DCs promote L. monocytogenes survival and preferentially interact with CD8 T cells at effector sites.
The rapid secretion of IFN-γ by memory CD8 T cells8 has been shown to play an important role for secondary responses to L. monocytogenes in the activation of Ly6C+ monocytes, DCs and macrophages towards microbicidal pathways that contribute to the effective protection of vaccinated hosts.9,10 Evidence for the additional contribution of the perforin/granzyme-dependent cytolysis in the protection of vaccinated hosts to L. monocytogenes stems from early studies using perforin-deficient mice (reviewed in ref. 11).3 More recently, mice deficient for synaptotagmin VII, a Ca2+ sensor regulating exocytosis, were found to be impaired in their ability to clear L. monocytogenes. Their CD8 T cells developed normally, presented no defect in cytokine production and formed a normal immune synapse, but were selectively affected in their capacity to degranulate their cytolytic enzymes.12 Mice deficient for interferon regulatory factor 4, a transcription factor necessary for CD8 T cells to acquire effector functions including cytolytic function, were also deficient in L. monocytogenes clearance and development of memory T cells, at least in part through CD8 T-cell-intrinsic characteristics.13
The perforin/granzyme (GZM)-dependent cytolytic function is acquired during differentiation of naive CD8 T cells into cytolytic T lymphocytes (CTL) in response to antigenic stimulation. Perforin and GZMs are localized in cytoplasmic granules of CTL (and natural killer cells) and are released at the immune synapse by degranulation upon CTL interaction with antigen-presenting target cells.14–16 Through a mechanism dependent on perforin, a pore-forming protein, GZMs (of which GZMs A and B are the most abundant) enter target cells and induce their apoptosis.17
Studies of the immune response to L. monocytogenes were initially performed in BALB/c mice in which strong L. monocytogenes MHC I epitopes were identified (reviewed in ref. 2). The absence of strong epitopes in C57BL/6 mice led to the construction of recombinant L. monocytogenes expressing model antigens such as the ovalbumin protein (Lm-OVA).18,19 An attenuated strain of L. monocytogenes was also developed (ActA− Lm) that was shown to induce a CD8 T-cell-dependent protection against the wild-type L. monocytogenes in C57BL/6 mice.20
CD8 memory T cells expressing the OT-1 OVA-specific T-cell receptor (TCR) generated in response to Lm-OVA have been shown to produce a rapid recall response with production of IFN-γ, whether challenged with Lm-OVA or L. monocytogenes.8,10 The OVA-independent recall response was mediated by inflammatory cytokines and also induced a rapid up-regulation of GZMB expression in the OT-1 T cells, but failed to induce T-cell proliferation, which required specific antigen re-stimulation.10
In the present study we were interested in analysing the kinetics of expression of GZMB in OT-1 CD8 T cells during their primary response to infection with ActA−-OVA and during their recall response to either ActA−-OVA or ActA− alone. The use of CD8 T cells from knock in (KI) mice expressing a functional fluorescent chimeric GZMB-Tomato (GZMB-Tom) protein in place of GZMB16 allowed the evaluation of the induction of GZMB during CD8 T-cell differentiation as a function of T-cell division. Using confocal analysis, GZMB-Tom-expressing CD8 T cells were visualized in splenic compartments and the polarization of their GZMB-Tom containing cytolytic granules was evaluated.
Materials and methods
Mice
Mice were housed under specific pathogen-free conditions in the Centre d'Immunologie de Marseille-Luminy facility. The GZMB-Tom KI mice that express the fusion protein GZMB-tdTomato in place of GZMB have been described.16 They were established on the C57BL/6 (CD45.2) background. They were crossed with OT1-TCR (here designated as WT-OT1) or OT2-TCR (WT-OT2) transgenic mice. Mice homozygous for GZMB-Tom and heterozygous for the OT1 (GZMB-Tom-OT1) or OT2 (GZMB-Tom-OT2) transgenic TCRs were used. Congenic C57BL/6 (CD45.1) mice were used as recipients. All procedures were approved by the Regional ‘Provence-Alpes-Cote d'Azur’ Committee on Ethics for Animal Experimentation (authorization: no. 13.521, date: 08/10/2012) and were in accordance with French and European directives. All efforts were made to minimize animal suffering.
In vitro T-cell activation
CD8 T cells purified from GZMB-Tom-OT1 or WT-OT1 mice were loaded with Cell tracker Violet (CTV; Molecular Probes, Eugene, OR), 2·5 μm final as described by the manufacturer) to follow cell division. C57BL/6 rag-2−/− splenocytes were loaded with the OVA peptide (OVA257–264: SIINFEKL) recognized by the OT1-TCR (OT1p) and added to 3 × 10⁵ CTV-loaded CD8 T cells. FACS analysis was performed at days 1, 2 and 3. For the activation of GZMB-Tom-OT2 CD4 T cells, C57BL/6 bone marrow-derived DCs were obtained by culturing bone marrow cells with FLT3L containing supernatant for 9 days as described previously.21 Then 2·5 × 105 bone marrow-derived DCs (per well of 24-well culture plates) were loaded with 1 or 0·1 µm OT2p (OVA323–339: SQAVHAAHAEINEAGR) and added to 3 × 10⁵ GZMB-Tom-OT2 purified CD4 T cells labelled with CTV.
Bacteria
The attenuated ΔActA Lm-OVA mutated Listeria22 transfected (ActA−-OVA) or not (ActA−) to express the gene encoding the full length OVA protein18,19 was a kind gift from Grégoire Lauveau and Saïdi M Soudja (Albert Einstein College of Medicine, Bronx, NY).
Immunizations
T cells were purified by negative selection using CD8 or CD4 kits (Dynabeads, Dynal, Invitrogen, Carlsbad, NM). For primary responses to ActA−-OVA 106 T cells (OT1-WT, OT1-GZMB-Tom or OT2-GZMB-Tom) labelled with CTV (as above) were injected intravenously. One day later, 106 ActA−-OVA bacteria were injected intravenously. The response was analysed 40 and 60 hr later. For the secondary immune response analysis, 5000 OT1-GZMB-Tom CD8 T cells were injected intravenously 1 day before injection of 106 ActA−-OVA or ActA− bacteria. Mice were left resting for 30 days before secondary injection of 106 ActA−-OVA or ActA− bacteria.
FACS analysis
Half of the collected spleens were kept for confocal analysis, the other half were dissociated for the FACS analysis, treated with 2.4.G2 anti-CD16 monoclonal antibody (mAb) to minimize unspecific binding to Fc receptors. Labelling at 4° was performed as described elsewhere23 with fluorescent anti-CD45.2 (clone 104 FITC; BD Pharmingen, San Diego, CA), anti-CD8 (53.6.7 A700; eBioscience, San Diego, CA), anti-CD44 (IM7 phycoerythrin-Cy7; eBioscience) or anti-CD25 (7D4-FITC; BD Pharmingen) mAbs. For GZMB (MHGB05-allophycocyanin; Invitrogen) and IFN-γ (XMG1.2-allophycocyanin; BD Pharmingen) labelling, cells were fixed for 10 min at room temperature with 2% platelet-activating factor pH 7·4 in PBS, followed by two washes in PBS. The mAbs were diluted in 0·5% Saponin in PBS buffer. Analyses were run with the LSRII (Becton Dickinson, Franklin Lakes, NJ) set with a 561-nm laser for optimal tdTomato detection.
Confocal analysis
Collected spleen fragments were immediately fixed with Antigenfix (Microm Microtech France, Francheville, France) for 3 hr at room temperature, followed by two washes in PBS 0·1 m pH 7·4 and a 30% sucrose bath at 4°, before embedding in OCT. Pieces were kept at −80° and sliced at 8-µm thickness. The mAbs CD45.2 (FITC clone 104; BD Pharmingen), B220 (RA3-6B2 A-647; BD Pharmingen), F4-80 (purified, clone SF12; BD Pharmingen), anti-MHC class II (M5/114-biotin; eBioscience), CD11c (N418 purified; eBioscience) Ki67 (SolA15 purifed; eBioscience) were diluted in PBS, at a pre-established concentration. Slices were incubated overnight at 4°. Secondary labelling was for 2 hr at room temperature. Prolong anti-fade (Invitrogen) containing or not DAPI was used to keep the coloured slices. Confocal microscopy was performed with the Zeiss 780 microscope with a 40× oil objective and a 0·6× zoom.
Results
GZMB-Tom expression during the primary immune response of OT1 CD8 T cells and OT2 CD4 T cells to ActA−-OVA bacteria
To visualize early steps of cell division and GZMB-Tom expression during the primary response of OT1 and OT2 T cells to ActA−-OVA in vivo, we performed FACS analysis at 40 and 60 hr after ActA−-OVA injection in C57BL/6 (CD45.1) mice that received GZMB-Tom-OT1 and GZMB-Tom-OT2 CTV-labelled T cells 1 day earlier (Fig.1). In the spleens of mice that had not been injected with ActA−-OVA, a minor population of OT1 cells went through one division without expressing GZMB-Tom (Fig.1a,c). When ActA−-OVA bacteria were injected, GZMB-Tom-OT1 CD8 T cells rapidly divided, with half of the population going through one to four divisions after 40 hr (Fig.1a,c). GZMB, as measured directly on live cells (GZMB-Tom) or with an anti-GZMB mAb on fixed and permeabilized cells, was expressed by 70–80% of immunized GZMB-Tom-OT1 splenic T cells at 40 hr (Fig.1a,c). Some of these cells were still undivided. At 60 hr after bacterial infection, most of the GZMB-Tom-OT1 T cells had divided (95–99%, Fig.1a,c), but not all expressed GZMB-Tom (about 64% GZMB-Tom-positive, Fig.1a,c). In particular, the newly divided cells (at the first or second division) were low expressors or did not express GZMB-Tom at this time-point, whereas the cells at the same degree of division at 40 hr were high GZMB-Tom expressors. All T cells were activated, as they became CD44hi (Fig.1a,c). These characteristics of the GZMB-Tom-OT1 response to ActA−-OVA bacteria were similar to those observed for WT-OT1 T cells (see Supporting information, Fig. S1). Data in Fig. S1 compare the response of GZMB-Tom-OT1 (Fig. S1A,C) to that of WT-OT1 (Fig. S1B,D) CD8 T cells in the same protocol as Fig.1, except that no GZMB-Tom-OT2 CD4 T cells were present. The results therefore also indicated that the presence of GZMB-Tom-OT2 CD4 T cells did not alter the response of the GZMB-Tom-OT1 CD8 T cells in the present setting (comparison of Fig.1a,c to Fig. S1A,C).
Figure 1.
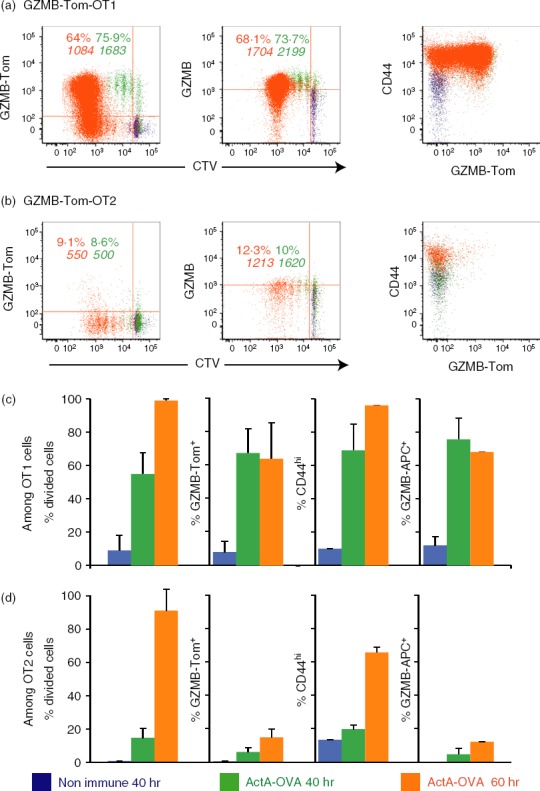
Analysis of the primary immune response to ActA−-ovalbumin (OVA) infection using chimeric granzyme B-Tomato protein (GZMB-Tom) -OT1 CD8 T cells and GZMB-Tom-OT2 CD4 T cells. Recipient C57BL/6 (CD45.1) mice were injected with Cell tracker Violet (CTV) -labelled CD8 T cells purified from GZMB-Tom-OT1 (CD45.2) mice and CTV-labelled CD4 T cells purified from GZMB-Tom-OT2 (CD45.2) mice (106 cells for each population). At 40 hr (green) and 60 hr (orange) after ActA−-OVA injection (106 bacteria), spleens were collected and analysed by cytometry. Gating was on CD45.2 and CD8-positive (a) or CD45.2 and CD4-positive (b) cell populations. GZMB-Tom fluorescence excited with the 561 nm laser was collected in the G610-20 channel (left), anti-GZMB monoclonal antibody was used to reveal GZMB expression in fixed and permeabilized cells (middle), both being shown as a function of CTV (left, middle) and anti-CD44 expression is shown as a function of GZMB-Tom expression (right). Numbers represent the % positive cells or the mean fluorescence intensity (MFI) of positive cells for the marker on the ordinate. Results from four mice in two different experiments are shown as % divided cells (first set of columns) or % of positive cells for the indicated marker (for the 3 other sets of columns) ± SD for OT1 (c) or OT2 (d) T cells.
The analysis of the response of GZMB-Tom-OT2 CD4 T cells to ActA−-OVA infection showed that although the OT2 CD4 T cells were induced to divide (with 1-day delay as compared with OT1-CD8 T cells), they very poorly expressed GZMB-Tom (Fig.1b,d). Although different requirements for antigen presentation to CD4 versus CD8 T cells could be invoked to explain this difference, poor stimulation of OT2 CD4 T cells with absence of GZMB-Tom expression was also observed upon in vitro stimulation with DCs pulsed with the relevant OVA peptide (see Supporting information, Fig. S2). Similar observations were previously reported for DO11.10 OVA-specific CD4 T cells.18
Altogether this analysis showed that, using the GZMB-Tom-OT1 T cells, we could observe rapid CD8 T-cell division and expression of GZMB-Tom following intravenous infection with ActA−-OVA bacteria. This response faithfully reproduced the OT1-WT response. Similar results were obtained when Lm-OVA instead of ActA−-OVA infection was performed (not shown).
Splenic localization of the GZMB-Tom-OT1 CD8 T cells during the primary response to ActA−-OVA analysed by confocal microscopy
Spleens from immunized mice were fixed with Antigenfix and embedded in OCT for confocal fluorescence analysis as described in the Materials and methods. Results are reported in Fig.2 and the Supporting information, Fig. S3. Spleen slices were labelled with anti-CD45.2-FITC mAb (green) to visualize the GZMB-Tom-OT1 T cells and anti-CD45R (B220) mAb (light grey) to define the B-cell zone surrounding the T-cell zone in the splenic WP (Fig.2a,b). At 40 hr after ActA−-OVA injection, OT1 T cells were localized in the T-cell zone surrounded by the B-cell follicles. Some T cells were still positive for the CTV dye, and most cells presented GZMB-Tom-positive granules (red), as shown more clearly in the enlarged red (near B cells) and yellow (central T-cell zone) rectangles (1, 2, Fig.2a). This is in agreement with the FACS results (Fig.1). At 60 hr after ActA−-OVA injection (Fig.2b), many OT1 T cells were present, in agreement with the high rate of cell division between 40 and 60 hr (Fig.1). Furthermore, the B-cell and T-cell zones appear leaky with B and T cells in close proximity (Fig.2b, red rectangle enlarged, 1). A few T cells with GZMB-Tom-positive granules were visible in that zone, whereas those localized inside the ‘true’ T-cell zone (yellow rectangle) were mostly GZMB-Tom negative. When the spleen samples were labelled with anti-MHCII and anti-CD45.2 mAb, most of the GZMB-Tom-positive OT1 T cells detected at 40 hr appeared to have their GZMB-Tom-positive cytolytic granules oriented towards an MHCII-positive cell (most probably DCs within the T-cell zone) (Fig.2c). However, at 60 hr (Fig.2d), the few visible GZMB-Tom-positive T cells did not present granules relocalized towards an MHCII-positive cell. At 60 hr it is possible that OT1 T cells expressed low GZMB-Tom following their degranulation and were en route to peripheral organs.
Figure 2.
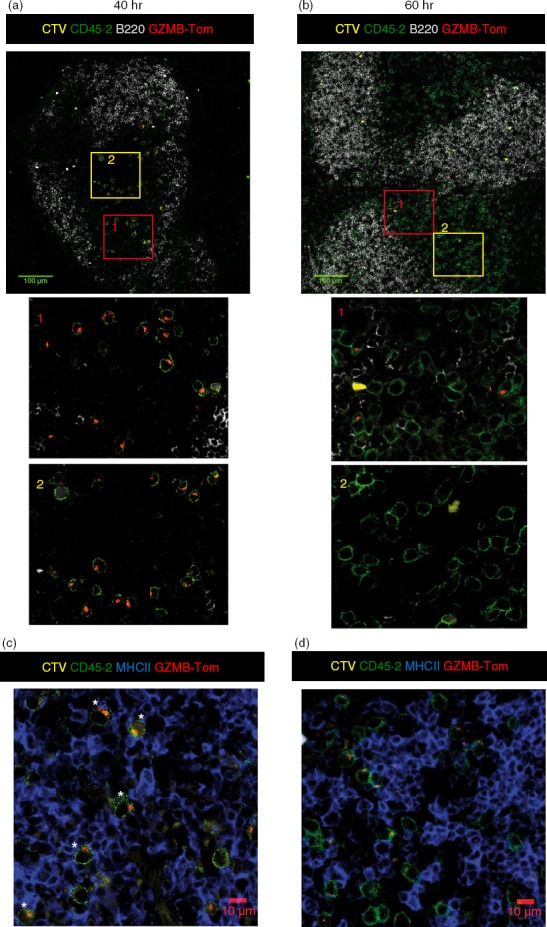
Splenic localization of chimeric granzyme B-Tomato protein (GZMB-Tom) -positive OT1 T cells responding to a primary infection with ActA−-ovalbumin (OVA). Recipient C57BL/6 (CD45.1) mice were injected with Cell tracker Violet (CTV) -labelled CD8 T cells purified from GZMB-Tom-OT1 (CD45.2) mice (106 cells). At 40 hr (a, c) and 60 hr (b, d) after ActA−-OVA injection, spleens were collected. Spleen samples were fixed for 3 hr with Antigenfix (see Materials and methods), embedded in OCT and cut into 8-µm slices for immunohistology. Labelling with anti-CD45.2 (green, a–d), anti-B220 (a, b) and anti-MHCII (blue, c, d) was performed on non-permeabilized slices. GZMB-Tom (red, a–d) was excited with the 561-nm laser of the Zeiss 740 confocal microscope. Confocal analyses used a 40× oil objective. Zoom 0·6×. Tiles (4 × 4 or 2 × 2) of mosaic images are also shown. The scale bars are 100 μm for a and b, 10 μm for c and d. Images are representative of three experiments.
Although CTV labelling is a precious tool for FACS analysis, the dye was mostly not detectable by confocal microscopy, especially at 60 hr (Fig.2). To visualize the localization of newly divided cells, we performed labelling with the anti-Ki67 mAb. This mAb detects a protein expressed during cell division at the S2-M phases.24 Results at 40 hr (see Supporting information, Fig. S3A) show that most GZMB-Tom-positive OT1 cells were Ki67 positive (white and yellow asterisks), some of them being also CTV positive (white asterisks). At 60 hr (Fig. S3B) some OT1 cells were positive for Ki67, but most of these were negative for GZMB-Tom expression (among 26 Ki67-positive OT1 cells, five were also GZMB-Tom positive). These results confirm the FACS data (Fig.1) indicating that newly dividing OT1 cells at 60 hr do not express GZMB-Tom. The reason for this is not defined. One possibility is that the antigen-presenting cells present at 60 hr in the zone where the OT1 cells proliferate do not present adequate ligands for co-stimulatory molecules such as CD28 that are required to induce high GZMB expression in CD8 T cells.16
Our results therefore showed that at 40 hr following ActA−-OVA injection, GZMB or GZMB-Tom were expressed in WT- or GZMB-Tom-OT1 CD8 T cells before the first cell division, with their levels of expression increasing after one to four divisions. At this time, OT1 cells were present in the T-cell zone, with GZMB-Tom containing granules oriented towards MHCII-positive cells. At 60 hr after bacteria injection, most of the OT1 cells went through multiple divisions and their level of GZMB-Tom expression was lower than at 40 hr, possibly as a result of their degranulation or slowed protein synthesis during active cell division. In addition, recently divided OT1 cells were very low in GZMB-Tom expression, suggesting that some co-stimulatory ligand was missing on the antigen-presenting cells. At that time the OT1 cells were still localized in the T-cell zone, but the T and B regions were partially overlapping and most of the GZMB-Tom-positive OT1 cells appeared to be in this overlapping region, perhaps ‘en route’ to the RP and peripheral organs.
Activation of GZMB-Tom OT1 memory CD8 T cells after challenge with ActA− or ActA−-OVA
ActA−-OVA-immunized mice were left resting for 30 days before challenge with ActA− or ActA−-OVA bacteria. Spleens were analysed 14 hr after intravenous injection of bacteria. As reported previously by others,8,10 OT1 memory T cells could be activated by either antigen-specific or inflammatory signals. FACS analysis showed that both ActA− and ActA−-OVA challenges reactivated primed GZMB-Tom-OT1 CD8 T cells as measured by CD25 and GZMB-Tom expression on the OT1 cells from the challenged compared with the resting OT1 cells from unchallenged mice (Fig.3a,c,d). Production of IFN-γ was also induced to similar levels after ActA− or ActA−-OVA challenge (Fig.3d). Although the % CD25-positive cells was similar after ActA− or ActA−-OVA challenge (Fig.3a), it is interesting to note that challenge with ActA− induced a sizable fraction (21%) of GZMB-Tom-positive T cells that lacked CD25 expression, whereas this population corresponded to only 3% of the ActA−-OVA-challenged OT1 cells (Fig.3a,c). In contrast a higher proportion of CD25-positive GZMB-Tom-negative OT1 cells were induced after ActA−-OVA (29%) compared with ActA− (13%) challenge (Fig.3a). This dichotomy suggests that different mechanisms are involved in the activation of the memory OT1 cells when cognate recognition is involved or not. It can be observed that the level of expression of GZMB-Tom is low in the GZMB-Tom+ CD25– subpopulation induced by ActA−, whereas the highest level of GZMB-Tom was observed in the CD25hi subpopulation, in particular in response to ActA−-OVA (Fig.3c,d).
Figure 3.
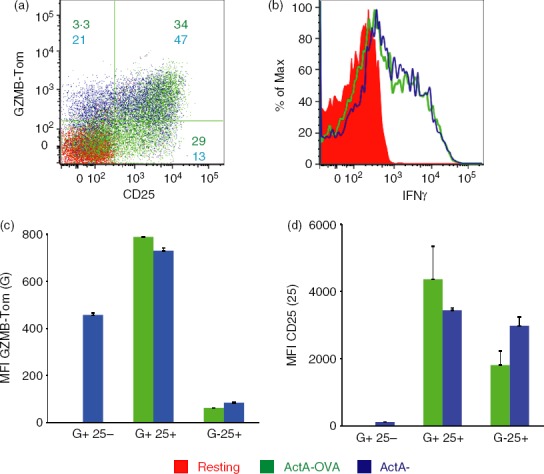
Analysis of the response to ActA−-ovalbumin (OVA) or to ActA− bacteria of ActA−-OVA-primed chimeric granzyme B-Tomato protein (GZMB-Tom) -OT1 CD8 memory T cells. Recipient CD45.1 mice were injected with 5000 GZMB-Tom-OT1 (CD45.2) CD8 T cells 1 day before infection with ActA−-OVA (106 bacteria). Thirty days later, they were either unchallenged (red) or injected with 106 ActA−-OVA (green) or ActA− (blue) bacteria and their spleens were collected 14 hr later and analysed by cytometry. With gating on CD45.2 and CD8-positive cells, a dot plot shows expression of GZMB-Tom and CD25 on live cells (a) and an histogram shows interferon-γ (IFN-γ) analysis on fixed and permeabilized cells (b). Representative of two experiments. In (a), numbers represent % cells in a given quadrant for ActA−-OVA (green) or ActA− (blue) challenges. Mean fluorescence intensity (MFI) for GZMB-Tom (c) and for CD25 (d) expression is shown within quadrants represented in (a) as GZMB+ CD25−, GZMB+ CD25+ and GZMB− CD25+, respectively.
Spleens were prepared for confocal analysis 14 hr after their challenge with ActA− or ActA−-OVA bacteria to analyse the localization of the OT1 memory T cells and their expression of GZMB-Tom (Fig.4 and see Supporting information, Fig. S4). Anti-CD45.2 mAb labelled the GZMB-Tom-OT1 CD8 T cells (green, lines 1 and 2) and anti-B220 labelling defined the B-cell zone (magenta, line 1). It should be noted that, since detection of the GZMB-Tom fluorescence by immunohistology is less sensitive than by FACS, only high expressors are detected by the former technique.
Figure 4.
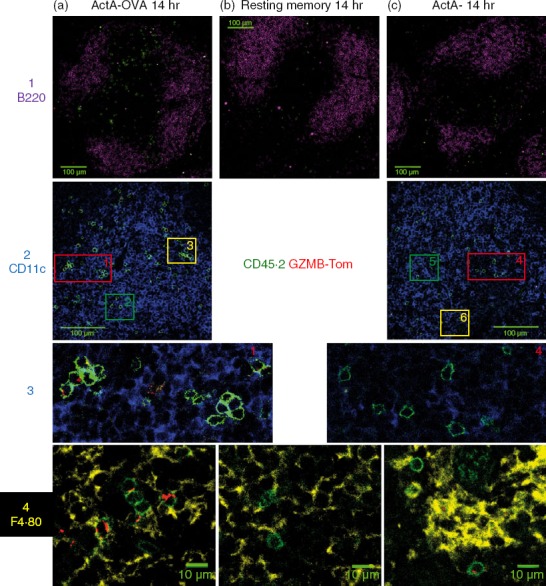
Splenic localization of chimeric granzyme B-Tomato protein (GZMB-Tom) -positive OT1 memory T cells responding to a challenge infection with ActA−-ovalbumin (OVA) or ActA− bacteria. Spleens of mice described in the legend of Fig.3 were treated for confocal analysis as described for Fig.2. Columns (a–c) show spleen samples from mice 14 hr after challenge with ActA−-OVA (a) or ActA− (c) bacteria, or unchallenged (b). Staining for CD45.2 (green) reveals OT1 T cells, and GZMB-Tom (red) is revealed as in Fig.2. The first line shows anti-B220 (Magenta) in a 2 × 2 Tile analysis with a 100-µm scale bar and lines 2–3 show staining for CD11c (blue) with a 100 µm scale bar (line 2). Regions marked 1, 2, 3 are enlarged from column A and regions marked 4, 5, 6 are enlarged from column B and are shown in line 3 (for regions 1 and 4) or in the Supporting information (Fig. S4, line 1; for regions 2, 3, 5, 6). The fourth line shows anti-F4.80 staining (yellow) (crop 1, zoom 0·6), an enlargement in an area of the red pulp (presence of F4.80+ macrophages) (see Fig. S4, line 2).
Most of the ActA−-OVA challenged OT1 cells appeared to be present in the WP (Fig.4a, line 1) although some were found in the RP (see Fig. S4A). Both unchallenged (Fig.4b, line 1, and Fig. S4B) and ActA−-challenged (Fig.4c, line 1, Fig. S4C) OT1 cells appeared more dispersed and distributed in both the RP and the WP. Labelling with anti-CD11c shows DCs within the WP (Fig.4, line 2). Although ActA−-OVA-challenged OT1 cells appeared in clusters in regions dense in CD11c+ cells, their GZMB-Tom-containing granules did not appear to be oriented towards the CD11c+ cells (Fig.4a, lines 2 and 3; Fig. S4A, line 1). Clusters of OT1 cells were not detected at the 14 hr time-point after challenge with ActA− bacteria and their GZMB-Tom containing granules were not re-localized towards CD11c+ cells either (Fig.4c, line 2–3; Fig. S4C, line 1). With anti-F4.80 labelling that identified RP macrophages (Fig. S4, line 2; Fig.4a, line 4), some OT1 T cells challenged with ActA−-OVA were observed in the RP that appeared to express bright and polarized GZMB-Tom-containing granules (Fig.4a, line 4), whereas GZMB-Tom expression appeared less bright and unpolarized in OT1 T cells challenged with ActA− (Fig.4c, line 4) and no GZMB-Tom was detected in the unchallenged OT1 T cells (Fig.4b, line 4).
At 14 hr after challenge with either bacteria, no OT1 cycling cells could be detected by Ki67 labeling (not shown).
Discussion
In this study we used CD8 T cells from GZMB-Tom-OT1 mice and CD4 T cells from GZMB-Tom-OT2 mice to monitor the primary response of mice to ActA−-OVA L. monocytogenes bacteria. We show that, unlike CD4 T cells that responded poorly, CD8 T cells readily proliferated and expressed high levels of GZMB-Tom as soon as 2 days after infection. The pattern of proliferation and GZMB expression was similar to that observed when CD8 T cells from WT-OT1 mice were tested in the same protocol using anti-GZMB mAb to detect GZMB in permeabilized cells. The sensitivity of the GZMB-Tom detection by FACS on live cells together with identification of divided cells with CTV dye indicates that it will be possible to use this model to address further questions concerning the development of memory T cells from CD8 T cells that express distinct characteristics during the primary response.
In particular, it was previously proposed that CD8 T-cell engagement with peptide/MHC of sufficient affinity25 promoted long-lasting contacts between T cells and antigen-presenting cells required for T-cell polarization and asymmetrical T-cell division, generating CD8hi proximal and CD8lo distal daughter cells.26,27 The CD8hi T cells differentiated into short-lived effector cells25 with poor capacity to generate memory cells capable of affording protection to secondary bacterial challenge.27 On the other hand, the use of transgenic mice with T cells that permanently expressed a yellow fluorescent protein (YFP) once GZMB transcription was activated allowed the elegant demonstration that CD8 T cells acquiring an effector phenotype during a primary infection could function as memory cells with replicative function.28 However, due to incomplete efficiency of the Cre recombination in that model, the question of the fate of the T cells that failed to express GZMB transcripts during the response could not be addressed. It would therefore be interesting to combine the latter transgenic model with the GZMB-Tom KI model to further study both primary effector and memory responses to infection.
In our study, at 40 hr after infection GZMB-Tom expression was already detected in undivided OT1 T cells. Analysis of CD8hi and CD8lo subpopulations showed selective GZMB-Tom expression in the CD8hi fraction (see Supporting information, Fig. S5). The CD8lo GZMB-Tom-negative population might correspond to unstimulated T cells that have not yet encountered an antigen-presenting cell. OT1 cells that went through one division at 40 hr were mostly CD8hi and GZMB-Tomhi, suggesting that they originate from undivided CD8hi T cells, while the potential distal CD8lo GZMB-Tomlo product to be expected from an asymmetrical cell division was not observed. Therefore, in the present setting, we have no evidence for asymmetrical division of OT1 CD8 T cells. Cells that went through two cycles of division were heterogeneous for CD8 expression, as cell surface CD8 expression was returning to its pre-activation level, but the cells were all GZMBhi. In contrast, at 60 hr after infection undivided (< 3%) cells as well those that went through one or two divisions were CD8hi or CD8lo and GZMB-negative. One possibility is that the OT1 cells with delayed proliferation were late in their encounter with an antigen-presenting cell, which may express less antigen or fewer co-stimulatory molecules later in the infection. The fate of CD8 T cells that had not divided and expressed high or low GZMB-Tom at 40 hr, or that went through one or two cycles of division with high expression of GZMB-Tom (40 hr after infection) or without expression of GZMB-Tom (60 hr after infection) could be determined by FACS sorting and analysis after their titrated transfer in a naive host. The quality of the memory response upon infection of the host could be monitored in terms of acquisition of effector function and proliferative capacity.
Use of the GZMB-Tom CD8 T cells in the present study also enabled detection of the intracellular localization of GZMB-Tom-containing cytolytic granules. During the primary infection the orientation of granules towards MHCII high cells, presumably DCs, in the splenic WP could be observed 40 hr after infection, but not 20 hr later. As also observed by FACS analysis, the level of expression of GZMB-Tom was lower at that time and some of the cells were negative for GZMB-Tom expression, even though they had gone through multiple divisions. It is possible that the latter cells had been engaged (between 40 and 60 hr after infection) in a cognate interaction with infected cells that resulted in exocytosis of their granules. That time interval may be appropriate to image the interaction of the GZMB-Tom-OT1 CD8 T cells with infected cells by confocal intravital microscopy, ideally by using fluorescently labelled bacteria as well as intrinsically labelled DCs.7 This technique may further reveal whether CD8 T cells actually kill infected cells in the primary response in this setting.
Concerning the recall response to infection, it was previously reported that memory OT1 CD8 T cells could respond to either specific antigen triggering or to inflammatory cues.8,10 However, the OVA-independent recall response that was mediated by inflammatory cytokines, notably interleukin-15, and led to a rapid up-regulation of GZMB expression in memory OT-1 T cells, failed to induce T-cell proliferation. The latter requiring specific antigen-dependent re-stimulation.10
Differences in initial activation events in CD8 T memory cells in response to cognate or inflammatory stimuli have yet to be established, however. We confirmed that 14 hr following challenge with either ActA−-OVA or ActA− bacteria, GZMB-Tom and IFN-γ expression were similarly re-induced. Analysis of CD8 T-cell subpopulations in terms of CD25/GZMB-Tom expression showed differences, however. While antigen-independent re-stimulation induced a sizable population (21%) of GZMB-Tom-positive T cells that lacked CD25 expression, this was a minor population (3%) upon antigen-dependent re-stimulation. Furthermore this CD25– GZMB– Tom+ population was low in GZMB-Tom expression in comparison with the CD25+ population. In the present setting, engagement of TCR signalling through cognate stimulation may reinitiate a full programme of gene expression including CD25 expression,29–32 induction of proliferation and sustained expression of GZMB, whereas inflammatory monocyte-derived IL-15 would fail to induce signals for proliferation.10,29,30 Alternatively, different subpopulations of memory CD8 T cells may preferentially be reactivated by cognate engagement (central memory T cells) versus cytokines (effector memory T cells).33,34
Related to the mode of activation of CD8 T memory cells with cognate versus inflammatory stimuli, we asked whether differences could be observed in terms of polarization of GZM-Tom containing granules during the recall response.
When ActA−-OVA was injected, some of the GZMB-Tom-OT1 T cells were found in clusters in the spleen WP. Among those GZMB-Tom-expressing cells were found, but no significant relocalization of their granules towards CD11C+ antigen-presenting cells was observed at this time-point. No T-cell clusters were apparent in the WP upon challenge with ActA−. Clusters of re-stimulated memory T cells have been described by others. In particular, at earlier time-points after infection (6–12 hr) with either Lm-OVA or L. monocytogenes, OT1 memory T cells were observed in large clusters with antigen-presenting cells in the RP.8 When focusing on the RP, some OT1 T cells challenged with ActA−-OVA were observed that appeared to express bright and polarized GZMB-Tom-containing granules, whereas GZMB-Tom expression appeared less bright and unpolarized in OT1 T cells challenged with ActA−. This suggests that cognate recognition occurs in the RP 14 hr after challenge with ActA−-OVA bacteria, consistent with the report that only high-avidity interactions between TCR and cognate peptide-MHC give rise to granule recruitment at the immune synapse.35
Further dissection of the mechanisms that lead to immediate reactivation of anti-bacterial memory CD8 T cells and/or to their long-term maintenance in response to cognate or inflammatory signals will contribute to improved vaccination protocols. The GZMB-Tom KI mice in which GZMB-Tom expression faithfully reproduced that of GZMB during an immune response to bacterial infection may provide a useful tool for such studies.
Acknowledgments
This work was supported by institutional funding from INSERM and CNRS, and by grants from ‘Association pour la Recherche sur le Cancer (ARC)’ and the ‘Institut National du Cancer’ (INCA) PROCAN programme (to AMSV). PM received a doctoral fellowship from ARC and MF was the recipient of a Fulbright fellowship. We thank Marc Bajénoff, Isabelle Mondor, Mohamed Habbedine and Karine Crozat for help with Lm-OVA infection and for discussions, Saïdi M Soudja and Grégoire Lauvau for providing the attenuated L. monocytogenes ActA− and ActA−-OVA, and Hughes Lelouard for reagents. We also thank the Centre d'Immunologie de Marseille-Luminy imaging and animal facilities personnel for assistance.
Glossary
- CTL
cytolytic T lymphocyte
- CTV
Cell Tracker Violet
- DCs
dendritic cells
- GZMB
granzyme B
- Lm
Listeria monocytogenes
- MFI
mean fluorescence intensity
- OVA
ovalbumin
- RP
red pulp
- Tom
tomato
- WP
white pulp
Contribution to authorship
CB and AMSV designed the experiments. PM and CB performed the in vivo experiments. MF and CF helped with some of the in vitro experiments and LC helped with histology. CB and AMSV wrote the paper.
Disclosures
The authors have no potential conflicts of interest.
Supporting Information
Additional Supporting Information may be found in the online version of this article:
Figure S1. Comparison of the primary immune response to ActA−-ovalbumin (OVA) infection using chimeric granzyme B-Tomato protein (GZMB-Tom)-OT1 or wild-type (WT)-OT1 CD8 T cells.
Figure S2. In vitro stimulation of chimeric granzyme B-Tomato protein (GZMB-Tom) OT1 CD8 and GZMB-Tom OT2 CD4 T cells.
Figure S3. Evaluation of dividing cells using anti-Ki67 monoclonal antibody at 40 and 60 hr after primary infection with ActA−-ovalbumin (OVA).
Figure S5. Analysis of the CD8 and chimeric granzyme B-Tomato protein (GZMB-Tom) expression by OT1 CD8 T cells as a function of cell division in the primary immune response to ActA−-ovalbumin (OVA) infection.
Figure S4. Red pulp (RP) localized chimeric granzyme B-Tomato protein (GZMB-Tom) -positive OT1 memory T cells responding to a challenge infection with ActA−-ovalbumin (OVA) or ActA− bacteria.
References
- Condotta SA, Richer MJ, Badovinac VP, Harty JT. Probing CD8 T cell responses with Listeria monocytogenes infection. Adv Immunol. 2012;113:51–80. doi: 10.1016/B978-0-12-394590-7.00005-1. [DOI] [PubMed] [Google Scholar]
- Pamer EG. Immune responses to Listeria monocytogenes. Nat Rev Immunol. 2004;4:812–23. doi: 10.1038/nri1461. [DOI] [PubMed] [Google Scholar]
- Kagi D, Ledermann B, Burki K, Hengartner H, Zinkernagel RM. CD8+ T cell-mediated protection against an intracellular bacterium by perforin-dependent cytotoxicity. Eur J Immunol. 1994;24:3068–72. doi: 10.1002/eji.1830241223. [DOI] [PubMed] [Google Scholar]
- Conlan JW. Early pathogenesis of Listeria monocytogenes infection in the mouse spleen. J Med Microbiol. 1996;44:295–302. doi: 10.1099/00222615-44-4-295. [DOI] [PubMed] [Google Scholar]
- Aoshi T, Zinselmeyer BH, Konjufca V, Lynch JN, Zhang X, Koide Y, Miller MJ. Bacterial entry to the splenic white pulp initiates antigen presentation to CD8+ T cells. Immunity. 2008;29:476–86. doi: 10.1016/j.immuni.2008.06.013. [DOI] [PubMed] [Google Scholar]
- Edelson BT, Bradstreet TR, Hildner K, et al. CD8α+ dendritic cells are an obligate cellular entry point for productive infection by Listeria monocytogenes. Immunity. 2011;35:236–48. doi: 10.1016/j.immuni.2011.06.012. [DOI] [PMC free article] [PubMed] [Google Scholar]
- Waite JC, Leiner I, Lauer P, et al. Dynamic imaging of the effector immune response to Listeria infection in vivo. PLoS Pathog. 2011;7:e1001326. doi: 10.1371/journal.ppat.1001326. [DOI] [PMC free article] [PubMed] [Google Scholar]
- Bajenoff M, Narni-Mancinelli E, Brau F, Lauvau G. Visualizing early splenic memory CD8+ T cells reactivation against intracellular bacteria in the mouse. PLoS One. 2010;5:e11524. doi: 10.1371/journal.pone.0011524. [DOI] [PMC free article] [PubMed] [Google Scholar]
- Soudja SM, Chandrabos C, Yakob E, Veenstra M, Palliser D, Lauvau G. Memory-T-cell-derived interferon-gamma instructs potent innate cell activation for protective immunity. Immunity. 2014;40:1–15. doi: 10.1016/j.immuni.2014.05.005. [DOI] [PMC free article] [PubMed] [Google Scholar]
- Soudja SM, Ruiz AL, Marie JC, Lauvau G. Inflammatory monocytes activate memory CD8+ T and innate NK lymphocytes independent of cognate antigen during microbial pathogen invasion. Immunity. 2012;37:549–62. doi: 10.1016/j.immuni.2012.05.029. [DOI] [PMC free article] [PubMed] [Google Scholar]
- Harty JT, Tvinnereim AR, White DW. CD8+ T cell effector mechanisms in resistance to infection. Annu Rev Immunol. 2000;18:275–308. doi: 10.1146/annurev.immunol.18.1.275. [DOI] [PubMed] [Google Scholar]
- Fowler KT, Andrews NW, Huleatt JW. Expression and function of synaptotagmin VII in CTLs. J Immunol. 2007;178:1498–504. doi: 10.4049/jimmunol.178.3.1498. [DOI] [PMC free article] [PubMed] [Google Scholar]
- Raczkowski F, Ritter J, Heesch K, et al. The transcription factor Interferon Regulatory Factor 4 is required for the generation of protective effector CD8+ T cells. Proc Natl Acad Sci USA. 2013;110:15019–24. doi: 10.1073/pnas.1309378110. [DOI] [PMC free article] [PubMed] [Google Scholar]
- Bossi G, Trambas C, Booth S, Clark R, Stinchcombe J, Griffiths GM. The secretory synapse: the secrets of a serial killer. Immunol Rev. 2002;189:152–60. doi: 10.1034/j.1600-065x.2002.18913.x. [DOI] [PubMed] [Google Scholar]
- Faroudi M, Utzny C, Salio M, Cerundolo V, Guiraud M, Muller S, Valitutti S. Lytic versus stimulatory synapse in cytotoxic T lymphocyte/target cell interaction: manifestation of a dual activation threshold. Proc Natl Acad Sci USA. 2003;100:14145–50. doi: 10.1073/pnas.2334336100. [DOI] [PMC free article] [PubMed] [Google Scholar]
- Mouchacca P, Schmitt-Verhulst AM, Boyer C. Visualization of cytolytic T cell differentiation and granule exocytosis with T cells from mice expressing active fluorescent granzyme B. PLoS ONE. 2013;8:e67239. doi: 10.1371/journal.pone.0067239. [DOI] [PMC free article] [PubMed] [Google Scholar]
- Chowdhury D, Lieberman J. Death by a thousand cuts: granzyme pathways of programmed cell death. Annu Rev Immunol. 2008;26:389–420. doi: 10.1146/annurev.immunol.26.021607.090404. [DOI] [PMC free article] [PubMed] [Google Scholar]
- Foulds KE, Zenewicz LA, Shedlock DJ, Jiang J, Troy AE, Shen H. Cutting edge: CD4 and CD8 T cells are intrinsically different in their proliferative responses. J Immunol. 2002;168:1528–32. doi: 10.4049/jimmunol.168.4.1528. [DOI] [PubMed] [Google Scholar]
- Pope C, Kim SK, Marzo A, Masopust D, Williams K, Jiang J, Shen H, Lefrançois L. Organ-specific regulation of the CD8 T cell response to Listeria monocytogenes infection. J Immunol. 2001;166:3402–9. doi: 10.4049/jimmunol.166.5.3402. [DOI] [PubMed] [Google Scholar]
- Goossens PL, Milon G. Induction of protective CD8+ T lymphocytes by an attenuated Listeria monocytogenes actA mutant. Int Immunol. 1992;4:1413–8. doi: 10.1093/intimm/4.12.1413. [DOI] [PubMed] [Google Scholar]
- Desnues B, Macedo AB, Roussel-Queval A, Bonnardel J, Henri S, Demaria O, Alexopoulou L. TLR8 on dendritic cells and TLR9 on B cells restrain TLR7-mediated spontaneous autoimmunity in C57BL/6 mice. Proc Natl Acad Sci USA. 2014;111:1497–502. doi: 10.1073/pnas.1314121111. [DOI] [PMC free article] [PubMed] [Google Scholar]
- Kocks C, Gouin E, Tabouret M, Berche P, Ohayon H, Cossart P. L. monocytogenes-induced actin assembly requires the actA gene product, a surface protein. Cell. 1992;68:521–31. doi: 10.1016/0092-8674(92)90188-i. [DOI] [PubMed] [Google Scholar]
- Davanture S, Leignadier J, Milani P, Soubeyran P, Malissen B, Malissen M, Schmitt-Verhulst AM, Boyer C. Selective defect in antigen-induced TCR internalization at the immune synapse of CD8 T cells bearing the ZAP-70(Y292F) mutation. J Immunol. 2005;175:3140–9. doi: 10.4049/jimmunol.175.5.3140. [DOI] [PubMed] [Google Scholar]
- Brown DC, Gatter KC. Ki67 protein: the immaculate deception? Histopathology. 2002;40:2–11. doi: 10.1046/j.1365-2559.2002.01343.x. [DOI] [PubMed] [Google Scholar]
- King CG, Koehli S, Hausmann B, Schmaler M, Zehn D, Palmer E. T cell affinity regulates asymmetric division, effector cell differentiation, and tissue pathology. Immunity. 2012;37:709–20. doi: 10.1016/j.immuni.2012.06.021. [DOI] [PMC free article] [PubMed] [Google Scholar]
- Chang JT, Ciocca ML, Kinjyo I, et al. Asymmetric proteasome segregation as a mechanism for unequal partitioning of the transcription factor T-bet during T lymphocyte division. Immunity. 2011;34:492–504. doi: 10.1016/j.immuni.2011.03.017. [DOI] [PMC free article] [PubMed] [Google Scholar]
- Chang JT, Palanivel VR, Kinjyo I, et al. Asymmetric T lymphocyte division in the initiation of adaptive immune responses. Science. 2007;315:1687–91. doi: 10.1126/science.1139393. [DOI] [PubMed] [Google Scholar]
- Bannard O, Kraman M, Fearon D. Pathways of memory CD8+ T-cell development. Eur J Immunol. 2009;39:2083–7. doi: 10.1002/eji.200939555. [DOI] [PubMed] [Google Scholar]
- Castro I, Yu A, Dee MJ, Malek TR. The basis of distinctive IL-2- and IL-15-dependent signaling: weak CD122-dependent signaling favors CD8+ T central-memory cell survival but not T effector-memory cell development. J Immunol. 2011;187:5170–82. doi: 10.4049/jimmunol.1003961. [DOI] [PMC free article] [PubMed] [Google Scholar]
- Pipkin ME, Sacks JA, Cruz-Guilloty F, Lichtenheld MG, Bevan MJ, Rao A. Interleukin-2 and inflammation induce distinct transcriptional programs that promote the differentiation of effector cytolytic T cells. Immunity. 2010;32:79–90. doi: 10.1016/j.immuni.2009.11.012. [DOI] [PMC free article] [PubMed] [Google Scholar]
- Tietze JK, Wilkins DE, Sckisel GD, et al. Delineation of antigen-specific and antigen-nonspecific CD8+ memory T-cell responses after cytokine-based cancer immunotherapy. Blood. 2012;119:3073–83. doi: 10.1182/blood-2011-07-369736. [DOI] [PMC free article] [PubMed] [Google Scholar]
- Verdeil G, Puthier D, Nguyen C, Schmitt-Verhulst AM, Auphan-Anezin N. STAT5-mediated signals sustain a TCR-initiated gene expression program toward differentiation of CD8 T cell effectors. J Immunol. 2006;176:4834–42. doi: 10.4049/jimmunol.176.8.4834. [DOI] [PubMed] [Google Scholar]
- Judge AD, Zhang X, Fujii H, Surh CD, Sprent J. Interleukin 15 controls both proliferation and survival of a subset of memory-phenotype CD8+ T cells. J Exp Med. 2002;196:935–46. doi: 10.1084/jem.20020772. [DOI] [PMC free article] [PubMed] [Google Scholar]
- Boudousquie C, Danilo M, Pousse L, Jeevan-Raj B, Angelov GS, Chennupati V, Zehn D, Held W. Differences in the transduction of canonical wnt signals demarcate effector and memory CD8 T cells with distinct recall proliferation capacity. J Immunol. 2014;193:2784–91. doi: 10.4049/jimmunol.1400465. [DOI] [PubMed] [Google Scholar]
- Jenkins MR, Tsun A, Stinchcombe JC, Griffiths GM. The strength of T cell receptor signal controls the polarization of cytotoxic machinery to the immunological synapse. Immunity. 2009;31:621–31. doi: 10.1016/j.immuni.2009.08.024. [DOI] [PMC free article] [PubMed] [Google Scholar]
Associated Data
This section collects any data citations, data availability statements, or supplementary materials included in this article.
Supplementary Materials
Figure S1. Comparison of the primary immune response to ActA−-ovalbumin (OVA) infection using chimeric granzyme B-Tomato protein (GZMB-Tom)-OT1 or wild-type (WT)-OT1 CD8 T cells.
Figure S2. In vitro stimulation of chimeric granzyme B-Tomato protein (GZMB-Tom) OT1 CD8 and GZMB-Tom OT2 CD4 T cells.
Figure S3. Evaluation of dividing cells using anti-Ki67 monoclonal antibody at 40 and 60 hr after primary infection with ActA−-ovalbumin (OVA).
Figure S5. Analysis of the CD8 and chimeric granzyme B-Tomato protein (GZMB-Tom) expression by OT1 CD8 T cells as a function of cell division in the primary immune response to ActA−-ovalbumin (OVA) infection.
Figure S4. Red pulp (RP) localized chimeric granzyme B-Tomato protein (GZMB-Tom) -positive OT1 memory T cells responding to a challenge infection with ActA−-ovalbumin (OVA) or ActA− bacteria.