

Abstract
Episodic memory decline is one of the earliest preclinical symptoms of AD, and has been associated with an upregulation in the BOLD response in the prodromal stage (e.g. MCI) of AD. In a previous study, we observed upregulation in cognitively normal (CN) subjects with subclinical episodic memory decline compared to non-decliners. In light of this finding, we sought to determine if a separate cohort of Decliners will show increased brain activation compared to Stable subjects during episodic memory processing, and determine whether the BOLD effect was influenced by cerebral blood flow (CBF) or gray matter volume (GMV). Individuals were classified as a “Decliner” if scores on the Rey Auditory Verbal Learning Test (RAVLT) consistently fell≥1.5 SD below expected intra- or inter-individual levels. FMRI was used to compare activation during a facial recognition memory task in 90 Stable (age=59.1) and 34 Decliner (age=62.1, SD=5.9) CN middle-aged adults and 10 MCI patients (age=72.1, SD= 9.4). Arterial spin labeling and anatomical T1 MRI were used to measure resting CBF and GMV, respectively. Stables and Decliners performed similarly on the episodic recognition memory task and significantly better than MCI patients. Compared to Stables, Decliners showed increased BOLD signal in the left precuneus on the episodic memory task that was not explained by CBF or GMV, familial AD risk factors, or neuropsychological measures. These findings suggest that subtle changes in the BOLD signal reflecting altered neural function may be a relatively early phenomenon associated with memory decline.
Keywords: Alzheimer’s, Preclinical, Cognition, Functional neuroimaging, Neuropsychological
Introduction
Functional magnetic resonance imaging (fMRI) during episodic memory recognition and retrieval tasks provides the opportunity to non-invasively measure activity in the brain regions associated with episodic memory that are most vulnerable to Alzheimer’s Disease (AD) neuropathology. Studies employing fMRI have demonstrated differential activation patterns allowing one to distinguish cognitively normal (CN) individuals from early prodromal AD (mild cognitive impairment; MCI) and predict progression to AD (Petrella et al. 2007). Given that episodic memory is one of the earliest signs of memory decline in AD (Albert et al. 2001; Bäckman et al. 2001; Chen et al. 2001; Dudas et al. 2005; Greene et al. 1996), using fMRI to measure the blood oxygen-level-dependent (BOLD) response during episodic memory processing may have clinical utility in characterizing AD-related preclinical neurocognitive and functional changes (Wierenga and Bondi 2007) that could potentially inform early disease identification and prevention strategies for at-risk individuals.
Along the continuum from normal cognition to dementia, there is an epoch where individuals at-risk for AD exhibit a heightened BOLD response during fMRI episodic memory tasks (Dickerson and Sperling 2008). Specifically, studies of MCI subjects have shown a non-linear relationship between the BOLD response and cognitive impairment, where less-impaired MCI subjects show increased activation compared to CN individuals and AD patients, and more impaired MCI subjects show reduced activation similar to patterns observed in mild AD. There is also evidence that increased activation in MCI positively predicts the degree and rate of cognitive decline (Miller et al. 2008), further suggesting that there is an early preclinical epoch, where up-regulation in the BOLD response is indicative of cognitive decline and conversion to AD. However, to date, there is a paucity of longitudinal studies that have explored this preclinical time-frame.
We recently employed a multimodal imaging paradigm (FDG- PET, MRI, and PIB-PET) to investigate early cognitive decline in subjects from the Wisconsin Registry for Alzheimer’s Prevention (WRAP), a longitudinal registry of CN middle–aged adults (ages 40–65 years at study entry) with and without parental family history (FH) of AD. We found that a neuronal function composite score derived from 18F-fluorodeoxyglucose (FDG) and fMRI episodic recognition memory task significantly differentiated CN subjects with subclinical episodic memory decline (“Decliners”) from non-decliners (“Stables”; Okonkwo et al. 2014a). While no single imaging measure significantly differentiated Stables from Decliners, we did observe a non-significant trend of BOLD upregulation in Decliners that may be similar to patterns observed in early MCI.
In light of this recent fMRI finding, we sought to explore whether the BOLD response in Decliners could be replicated. A separate cohort of CN subjects from the WRAP (mean age=53 at enrollment; mean age 60 at the time of imaging) who had undergone the same fMRI protocol as described in Okonkwo et al. (2014a) were selected to undergo MRI only (no PET amyloid or FDG imaging). All subjects had prior longitudinal neuropsychological data allowing us to classify the CN subjects as either “Stable” or “Decliner” based on the Rey Auditory Verbal Learning Test (RAVLT). Stables and Decliners were then compared on an fMRI episodic recognition memory task that has been shown to activate regions within the posteromedial cortex (posterior cingulate gyrus & precuneus) and hippocampus (Huijbers et al. 2012; Vannini et al. 2011; Wagner et al. 2005).
The primary aim of this study was to more completely investigate the effect of subclinical episodic memory decline on functional brain activity. To address potential confounds that may obscure the effect of group status (Stable or Decliner) on the BOLD signal we included additional imaging sequences to measure basal cerebral blood flow (CBF) and gray matter volume (GMV). Likewise, we also assessed for the effect of familial risk factors (family history and APOE4 status), neuropsychological performance and symptoms of depression. Given our previous findings in a separate, yet similar cohort of subjects, our overarching hypothesis is that Decliners, classified by scoring broadly within normal limits on an array of cognitive testing, but displaying episodic memory decline over multiple time points, will show increased brain activation during episodic memory processing compared to Stable subjects.
Methods
Subjects
Subjects were recruited by telephone or letter from the WRAP, a longitudinal registry of >1,500 CN, middle-aged adults (40–65) with and without FH of AD (Sager et al. 2005). The primary subjects in this study were 124 WRAP subjects who had baseline, 4-year, and 6-year follow-up cognitive assessments and functional MRI proximal to the 6-year assessment. These subjects were then sub-classified into a “Stable” (n=90) or “Decliner” (n=34) group if they met the cognitive assessment criteria defined below. To more completely represent the spectrum of pre-dementia, we included 10 MCI patients who were recruited from the Wisconsin ADRC as a positive control, disease-comparison to the Stable and Decliner groups. Finally, we also included 107 additional WRAP subjects as a “task-effect reference” group to define the space of fMRI task-related activation on the facial recognition memory task described below. These were subjects who did not yet have sufficient longitudinal follow-up cognitive testing to be classified as either Stable or Decliner, but were nevertheless CN based on cross-sectional cognitive testing and utilized to create an independent normative map of activation on the fMRI task using unique subjects. For all subjects, study exclusion criteria included contraindications to MRI; major neurologic disorder (e.g. head trauma, neoplasm, and seizure disorder), current major psychiatric disorder (e.g. schizophrenia, substance dependence, major depressive disorder), or abnormal structural MRI (e.g. ventriculomegaly) that would interfere with preprocessing and second level image analysis. All subjects included in the statistical analysis were required to have usable behavioral and imaging data free from artifacts or unacceptable motion (movement in the x-, y-, or z-plane> 3 mm).
Classification as a Decliner was based on RAVLT Total Learning and Long Delay scores, as early deficits in list learning/retention have been shown to be particularly prognostic of future clinical decline (Blacker et al. 2007; Elias et al. 2000). Specifically, we first derived age-, sex-, and education-adjusted RAVLT norms using baseline data from WRAP subjects (n=408) who were FH- and also free from all major neurological and psychiatric conditions that could compromise cognition across all their study visits (spanning November 2001 to April 2012). An individual was labeled a “Decliner” if they met one or both of the following criteria: 1) if their scores on the RAVLT Total Learning or Long Delay dropped≥1.5 SD below the WRAP population-based norms and remained within this range on any subsequent testing occasions prior to scanning; and/or 2) if their own within-subject score on RAVLT Total Learning or Long Delay dropped≥1.5 SD below any prior testing and likewise remained within this range on any subsequent testing occasions prior to scanning. Conversely, subjects were considered Stable if their RAVLT Total Learning and Long Delay scores never dropped −1 SD below based on the WRAP population-based norms. At no time-point leading up to the time of scanning were Decliner subjects considered cognitively abnormal or meeting criteria for amnestic MCI as their declining scores on the RAVLT (and additional neuropsychological tests described below) are still considered to be subclinical and within a normal range of cognitive functioning. Based on our classification criteria of the 124 subjects who provided data for this study, 90 were classified as a Stable and 34 were classified as a Decliner.
Ten MCI subjects were recruited from the Wisconsin ADRC to be included as a positive control disease comparison group. These individuals were diagnostically characterized in the Wisconsin ADRC multidisciplinary consensus conference consisting of neurologists, geriatricians, neuropsychologists, and nurse practitioners using established diagnostic criteria for MCI (Albert et al. 2011). Cognitive impairment was determined using an established ADRC battery and aged-normed scores on tests of executive functioning, immediate and delayed memory, attention, verbal fluency, and visuospatial/ constructional abilities.
The University of Wisconsin Institutional Review Board approved all study procedures and each subject provided signed informed consent before participation. The study was carried out in accordance with the Helsinki Declaration.
Neuropsychological assessment
The 124 Stable and Decliner WRAP subjects completed a comprehensive neuropsychological battery consisting of the Clinical Dementia Rating Scale (CDR), the Mini-Mental State Exam (MMSE; Folstein et al. 1975), Rey Auditory Verbal Learning Test (RAVLT; Schmidt 1996), Trail Making Test (Reitan and Wolfson 1993), and other psychometric measures that span traditional cognitive domains of memory, attention, executive function, language, and visuospatial ability (see Tables 1 and 2 for demographic and neuropsychological data). The 10 MCI also underwent an extensive neuropsychological evaluation, consisting of all components of the National Alzheimer’s Coordinating Center Uniform Data Set (Weintraub et al. 2009). Stable and Decliner WRAP subjects on average were assessed 4.9 (SD=4.04) and 6.5 (SD=5.9) months respectively, before or after their fMRI scan. MCI WADRC subjects were assessed on average 3.5 (SD=11.5) months before or after their fMRI scan.
Table 1.
Patient characteristics at time of fMRI
| Variable | Stable n=90 |
Decliner n=34 |
MCI n=10 |
p value |
|---|---|---|---|---|
| Age | ||||
| Mean±SD | 59.11±6.88 | 62.14±5.99 | 72.07±9.42 | 0.000abc |
| Min, max | 43, 73 | 49, 71 | 52, 84 | |
| Education | ||||
| Mean±SD | 15.88±2.36 | 16.24±2.31 | 17.22±2.77 | 0.241 |
| Min, max | 12, 22 | 12, 21 | 13, 20 | |
| FH positive, % | 75.5 | 88.2 | 70.0 | 0.248 |
| APOE4 positive, % | 41.1 | 47.1 | 70.0 | 0.218 |
| Female, % | 74.4 | 50.0 | 50.0 | 0.019ab |
APOE4 the varepsilon 4 allele of the apolipoprotein E gene, FH family history of Alzheimer’s disease, MMSE Mini mental status exam, RAVLT Rey Auditory Verbal Learning Test
p-value for omnibus test;
Stables significantly different from Decliners;
Stables significantly different from MCI;
Decliners significantly different from MCI
Table 2.
Neuropsychological data
| Variable | Stable n=90 |
Decliner n=34 |
MCI n=10 |
p value |
|---|---|---|---|---|
| MMSE | ||||
| Mean±SD | 29.59±1.13 | 28.70±1.09 | 27.37±1.22 | .000abc |
| Min, max | 27, 30 | 23, 30 | 24, 29 | |
| RAVLT total | ||||
| Mean±SD | 54.42±5.82 | 43.89±6.65 | 41.73±7.17 | .000ab |
| Min, max | 35, 69 | 28, 63 | 34, 49 | |
| RAVLT long delay | ||||
| Mean±SD | 11.68±2.62 | 7.10±2.60 | 4.14±2.79 | .000abc |
| Min, max | 7, 15 | 0, 15 | 0, 9 | |
| RAVLT recognition | ||||
| Mean±SD | 14.07±1.74 | 12.47±1.73 | 10.70±1.90 | .000ab |
| Min, max | 10, 15 | 5, 15 | 7, 14 | |
| Trails A | ||||
| Mean±SD | 25.80±0.983 | 25.70±9.33 | 31.01±9.96 | ns |
| Min, max | 13, 68 | 15, 60 | 18, 60 | |
| Trails B | ||||
| Mean±SD | 58.43±23.43 | 69.63±23.32 | 72.66±25.23 | ns |
| Min, max | 29, 135 | 38, 162 | 44, 194 | |
| WRAT-III | ||||
| Mean±SD | 106.97±8.97 | 104.03±9.74 | 0.118 | |
| CESD-R | ||||
| Mean±SD | 5.96±6.18 | 7.76±6.30 | 0.109 | |
| WASI vocabulary | ||||
| Mean±SD | 65.1±7.48 | 63.46±2.60 | 0.274 | |
| WASI block design | ||||
| Mean±SD | 48.53±12.00 | 44.13±12.30 | 0.080 | |
| WASI matrix reasoning | ||||
| Mean±SD | 26.15±3.89 | 25.57±3.97 | 0.469 | |
Values are statistically adjusted for age and sex and were Bonferroni corrected
RAVLT Rey Auditory Verbal Learning Test, MMSE Mini-Mental State Exam, WRAT III, Wide-Range Achievement Test, 3rd edition, CESDR Center for Epidemiologic Studies Depression Scale Revised, WASI Wechsler Abbreviated Scale of Intelligence
p-value for omnibus test;
Stables significantly different from Decliners;
Stables significantly different from MCI;
Decliners significantly different from MCI
Imaging task
fMRI task description
The fMRI paradigm consisted of an event-related task involving episodic recognition of previously viewed (PV) faces. The task required an encoding session that took place outside of the scanner during which 48 faces were viewed five times during five discrete encoding contexts (Okonkwo et al. 2014a). Approximately 30 min later during fMRI, a recognition task was administered that required subjects to discriminate between PV faces from the encoding session and novel (NV) faces. As noted above, this is the same paradigm used in the Okonkwo et al. (2014a) study but with different subjects. The task evokes activation in posteromedial cortex and medial temporal lobe, regions known to be vulnerable to pathological changes associated with AD (Buckner et al. 2005).
Stimuli
The stimuli for this task consisted of color photographs of forward-looking faces (50 % female) taken from the Center for Vital Longevity Face Database (Minear & Park 2004). The stimuli were presented with the stimulus delivery program, Presentation software V10.3 (NeuroBehavioral Systems Inc., Albany, CA), via a laptop computer (during the training sessions) and with a high-resolution MRI compatible goggle system during the scan (Resonance Technologies, Northridge, CA, USA). The display screen was 600×800 pixels. Each picture was presented at 400× 400 pixels in the center of a black screen. A cross-hair fixation point appeared in the center of the screen when faces were not displayed and was used as a default background. The stimulus presentation computer and the scanner were synchronized with a coaxial cable using the TTL pulse generated by the scanner for each slice acquisition to maintain precise synchronization.
Encoding session
Stimulus encoding took place in a pre-scan task outside of the scanner. The training session required 15 min to complete and began approximately 30 min prior to the scan. Forty-eight faces were presented in five discrete viewing contexts and subjects made decisions about each face to ensure they attended to and deeply encoded the faces. These contexts were attractiveness, likability, distinctiveness, energy, and age. Each face was presented for 3,000 ms with a 500 ms interstimulus interval. Cues at the bottom and top of the screen reminded subjects of the encoding context. Because this was designed to be a passive encoding task, subjects were not instructed to remember the faces, but to simply rate the faces according to the viewing context. Subjects were also informed that there were no correct or incorrect responses to the viewing contexts. For each trial the subject made a decision on a 1–4 scale using a labeled keyboard with only keys 1, 2, 3, and 4 responsive. The order of the five encoding contexts was randomly chosen by the software; similarly, the order of presentation of the 48 faces was also randomly assigned and differed from subject to subject. During each context, a cue was presented at the top of the screen “How [attractive; likeable; distinctive, energetic, old] is this face?” using white font on the black background at the top of the screen. The response was a rating on a 1–4 scale where 1 was “not at all” and 4 was “very much” (for the Age context, the 1–4 categories were discrete age brackets). Responses were recorded for each trial using a 3,495 ms response window from the onset of the face display within the trial.
fMRI recognition task
During fMRI scanning, subjects were shown NV faces intermixed with the PV faces and were instructed to make an old or new decision for each face. Subjects used a two-button response box in their right hand and pressed either their index finger to identify PV items or their middle finger to identify NV items resulting in their respective selection being highlighted on-screen. All responses were logged using Presentation software V10.3. Subjects performed two runs of the task with each lasting 5 min and 34 s. Each run consisted of 24 PV faces and 24 NV faces. Faces presented in one run were not presented in the other run. The faces were presented in clusters ranging from a single trial to three consecutive trials of the same face type with each face appearing for 2,200 ms. A white crosshair with a black background appeared after the face and stayed on until the subsequent face appeared. All faces were projected to the goggle system as 280×280 pixel arrays centered on an 800×600 black screen. The average stimulus onset asynchrony was 6.8 s (range 4–11 s) with most stimulus onset asynchrony being 5, 6 or 7 s. The order of the runs was counterbalanced across subjects. The response to the previously viewed items versus novel items was the a priori contrast of interest.
Neuroimaging protocol
fMRI
All subjects were scanned on a GE 3.0 T MR750 (Waukesha, WI) using an 8 channel head coil. Blood Oxygen Level Dependent (BOLD) imaging was achieved through a gradient echo pulse sequence with the following parameters: echo time (TE)=25 ms; repetition time (TR)=2,000 ms; flip angle=60°; acquisition matrix=64×64; field of view=240 mm. Thirty six 4 mm thick sagittal slices (no skip) were acquired interleaved within each TR. The resulting voxel size was 3.75× 3.75×4 mm3. One hundred and sixty-seven temporal volume images (of which the initial three image volumes of each scan were discarded) were collected during each of two runs.
Structural MRI
A T1-weighted brain volume was acquired in the axial plane with a 3D inversion recovery prepared fast spoiled gradient-echo (3D IR-FSGRE) sequence using the following parameters: TI=450 ms; TR=8.1 ms; TE=3.2 ms; flip angle=12°; acquisition matrix=256×256×156 mm, FOV=256 mm; slice thickness=1.0 mm. Voxels were 1 mm isotropic. The image acquisition protocol also included T2 weighted and T2FLAIR anatomical scans which were reviewed by a neuroradiologist (H.A.R.) for exclusionary abnormalities.
ASL
Resting CBF assessments were made using background-suppressed pseudo-continuous ASL (pcASL; Dai et al. 2008; Ye et al. 2000) featuring a 3-D fast spin echo spiral sequence that utilizes a stack of variable-density spiral 4 ms-readout and 8 interleaves. Scan parameters included TE/TR=10.5 ms/ 4.9 s, slice thickness=4 mm no gap, FOV=240, matrix size=128×128, NEX=3, and labeling RF amplitude= 0.24mG. Multi-slice spin labeling was implemented using a single coil that eliminates off-resonance errors (Garcia et al. 2005) and included a post-labeling delay of 1,525 ms. The sequence also included a fluid-suppressed proton density (PD) acquisition, with the same imaging sequence/image slab location as the pcASL but without the RF labeling preparation, for CBF flow quantitation and image registration. The entire pcASL sequence—all 3 excitations plus PD scan—was acquired under 5 min. To preserve the fidelity of the CBF assessment, scanning was done after a minimum 4-h fast from food, tobacco, caffeine, and medications with vasomodulatory properties. We have previously reported excellent test-retest reliability (r>0.95) of this pcASL procedure (Okonkwo et al. 2014b; Xu et al. 2010).
Image processing
fMRI
All fMRI EPI data were slice-time corrected using the Analysis of Functional NeuroImages (AFNI) software and then motion corrected to the first volume image of the first time series using Statistical Parametric Mapping software (SPM8) (www.fil.ion.ucl.ac.uk/spm). Next, the data were spatially normalized to the Montreal Neurological Institute (MNI) EPI template image, resampled to 2 mm isotropic voxels, and smoothed with a Gaussian kernel (8 mm FWHM) using SPM8. To obtain single-subject activations, a fixed effects analysis was performed for each subject using the general linear model which included regressors for each task convolved with the SPM canonical hemodynamic response function, the motion correction parameters as well as a mean term per run in order to estimate the mean BOLD response associated with recognition of PV versus NV faces. Additionally, the model included a high-pass filter (1/128 s) and a first-order autoregressive function to account for temporal autocorrelation. The PV>NV contrast from the stimulus-specific regressors was created for use in a second-level analysis.
Structural MRI
Processing of the T1-weighted images was performed using a six-class segmentation processing stream in SPM8 (Wellcome Trust Centre for Neuroimaging, Institute of Neurology, UCL, London UK, http://www.fil.ion.ucl.ac.uk/spm). Processing involved bias correction and iterative normalization and segmentation of the original anatomic images (Ashburner and Friston 2005) into distinct tissue classes (gray matter, white matter, cerebrospinal fluid, skull, fat tissue, and image background) using spatial prior information. GM tissue segments were normalized to MNI template space via a 12-parameter affine transformation and nonlinear deformation (with a warp frequency cutoff of 25). The segmented and normalized GM maps were “modulated”, which involves scaling the final GM maps by the amount of contraction or expansion required to warp the images to the template. The final result was a GM probability map for each participant in which the total amount of GM remained the same as in the original images. The spatially normalized GM maps were smoothed using an 8-mm Gaussian kernel before being entered into the statistical analysis to determine whether there were any regional GMV differences that could confound the interpretation of the BOLD response differences.
ASL
The CBF images were processed using SPM8. The procedure essentially involved registering each subject’s co-localized PD image to their T1 volume, applying the derived transformation matrix to their average quantitative CBF map, then spatially normalizing the T1 volume and associated CBF image to the MNI template, with resampling to a 2×2×2 mm voxel size. The normalized CBF maps were then smoothed using an 8-mm FWHM Gaussian kernel. We corrected for inter-individual variations in global perfusion by scaling each voxel in the CBF map by the mean whole-brain CBF.
APOE
DNA was extracted from blood samples that were aliquoted on 96-well plates for determination of APOE genotypes at Polymorphic DNA Technologies (polymorphicdna.com, Alameda, CA). Three different polymorphisms (E2, E3, and E4) were determined for each subject and binarized as either E4 positive (+) or negative (−).
Statistical analysis
Neuropsychological and demographic data analysis
Group differences between Stables, Decliners, and MCI subjects on demographic and neuropsychological assessment measures were tested using ANOVA, ANCOVA, and χ2 analyses as appropriate (See Table 1). While our primary aim was to measure differences between Stables and Decliners, MCI subjects were included in this analysis to provide a clinical reference point relative to Decliners.
fMRI task performance data analysis
The average accuracy and reaction time for NV and PV faces for each group were calculated from behavioral response data during the fMRI task. The hit rate (HR), miss rate (MR), false alarm rate (FAR) and correct rejection rate (CRR) were also calculated. HR is defined as the conditional probability that the subject pressed the old button (index finger) when a PV face was presented; miss rate is the probability that the new button was pressed when a PV face was presented; FAR is the probability that the subject pressed the old button when a NV face was presented; and CRR is the probability that the new button was pressed when a NV face was presented. The statistic d′, which is a measure of the distance between the signal and the signal plus noise, is interpreted as a measure of memory sensitivity. It was calculated according to signal detection theory (Harvey 1992): d′=ZHR-ZFAR, where the HR and FAR are transformed from probabilities into Z-scores. Differences between Stable, Decliner and MCI subjects were tested with an ANCOVA with age and sex as covariates.
fMRI task analysis
SPM8 was used to statistically analyze all neuroimaging data. To demonstrate the facial episodic recognition memory task-effect, the additional 107 CN subjects from the WRAP, included as a task-effect reference group, were examined using an unadjusted one sample t-test of PV>NV. The task-effect is reported at a PFWE-voxel <0.05 level with a 100 voxel extent-threshold. The map of the task-effect was then used to generate a binary mask to restrict the subsequent group analyses to only those voxels with task-positive activation.
fMRI group analysis
To investigate differences in the BOLD signal on the face recognition task between Stables and Decliners, we conducted an ANCOVA modeled with the covariates of age, sex, APOE4, FH, and d′. Task-positive regions of activation were constrained by an empirically derived binary mask from the task-effect reference group and thresholded at an uncorrected Pvoxel<0.005 with an extent threshold of 50 voxels. We also conducted the same analyses with the MCI subjects added to the model in order to plot the relative activation between Stables and Decliners and a clinical reference point (MCI subjects). Lastly, we performed a multiple regression analysis with Stables and Decliners in the model to determine if d′ (task performance) was associated with any task positive regions of activation thresholded at an uncorrected Pvoxel<0.005.
ASL analysis
To assess differences in cerebral blood flow (CBF) between Stables and Decliners, we used an ANCOVA thresholded at a Pvoxel<0.005 with age, sex, APOE4, and FH as covariates to examine voxels within a gray matter mask. The same analysis was also conducted with MCI subjects added to the model (Pvoxel<0.005).
Structural MRI analysis
To assess differences in GMV between Stables and Decliners, gray matter probability maps from T1-weighted images included in an ANCOVA thresholded at a a Pvoxel<0.005 with age, sex, APOE4, FH and intracranial volume (ICV) as covariates. The same analysis was also conducted with MCI subjects added to the model (Pvoxel<0.005).
Results
Demographic data
An ANOVA with Stables, Decliners, and MCI subjects (results were similar between Stables and Decliners when modeled without MCI) revealed significant differences in the age of the MCI group and percentage of females in the Stable group (see Table 1). The three groups did not significantly differ in the amount of education. A chi-square analysis did not reveal any significant differences in the percentage of APOE4 or FH positive individuals across the three groups.
Neuropsychological data
A t-test with Stables and Decliners did not reveal differences on the Wide Range Achievement Test-III (WRAT-3rd), Wechsler Abbreviated Scale of Intelligence (WASI), and Center for Epidemiologic Studies Depression Scale-Revised (CESD-R) (see Table 2). An ANCOVA of neuropsychological data between Stables, Decliners, and MCI subjects showed Stables had significantly better scores than Decliners and MCI subjects on all measures except Trails A and B (see Table 2). Decliners had significantly better scores than the MCI subjects on the MMSE and RAVLT Long Delay.
fMRI task performance data
An ANCOVA of fMRI task performance data revealed MCI subjects were significantly less accurate at distinguishing between PV and NV faces than Stables and Decliners (see Table 3). There were no significant group differences with respect to reaction time to PV faces; however the MCI subjects were significantly slower than Stables when responding to NV faces. MCI subjects had significantly poorer d′, false alarm, and hit rates than Stables and Decliners. Importantly, these analyses did not reveal any significant differences between the Stables and Decliners across all fMRI task performance measures.
Table 3.
Performance on fMRI episodic memory task
| Variable | Stable n=90 |
Decliner n=34 |
MCI n=10 |
p value |
|---|---|---|---|---|
| Mean | ||||
| Overall accuracy | 89.23 (9.17) | 86.99 (7.93) | 74.12 (8.25) | 0.000bc |
| NV accuracy | 87.37 (13.34) | 83.60 (11.60) | 66.48 (12.06) | 0.000bc |
| PV accuracy | 91.09 (9.58) | 90.39 (8.34) | 81.81 (8.61) | 0.012bc |
| NV RT | 1244.17 (380.42) | 1336.17 (329.97) | 1548.98 (342.27) | 0.039b |
| PV RT | 1168.75 (328.81) | 1181.75 (325.48) | 1399.92 (337.56) | ns |
| d′ | 2.73 (0.816) | 2.56 (0.705) | 0.76 (0.732) | 0.002bc |
| False alarm rate | 0.124 (1.18) | 0.153 (0.110) | 0.327 (1.17) | 0.000bc |
| Hit rate | 0.915 (8.68) | 0.908 (0.014) | 0.826 (0.081) | 0.012bc |
Indicates values are statistically adjusted for age and sex and Bonferroni corrected
NV novel, PV previously viewed
p-value is for omnibus test;
Stables significantly different from Decliners,
Stables significantly different from MCI,
Decliners significantly different from MCI
Imaging results
Brain response to fMRI episodic memory recognition task in cognitively normal (task-effect reference group)
An ANOVA between Stables and the 107 CN task-effect reference group on demographic variables did not reveal any significant differences. A one-sample t-test comparing PV>NV faces in 107 CN subjects from the WRAP cohort revealed significant activation spanning the posteromedial cortex (PMC) and additional medial and frontal regions (Table 4; Fig. 1).
Table 4.
Task Effect in cognitively normal subjects
| Contrast | Brain region | Hemisphere | BA | Voxels | Coordinates (MNI, x,y,z) | T (Peak) | P (FWE) | ||
|---|---|---|---|---|---|---|---|---|---|
| PV >NV | Cuneus | R | 18 | 15,120 | 10 | −90 | 20 | 14.07 | <0.001 |
| Precuneus | L | 31 | −8 | −62 | 26 | 13.07 | |||
| Cingulate Gyrus | L | 31 | −6 | −40 | 38 | 11.50 | |||
| Precuneus | L | 19 | 3,402 | −44 | −74 | 44 | 12.69 | <0.001 | |
| Precuneus | L | 19 | −38 | −80 | 44 | 11.97 | |||
| Middle Temporal Gyrus | R | 21 | 807 | −64 | −38 | −12 | 8.59 | <0.001 | |
| Middle Temporal Gyrus | L | 21 | −56 | −20 | −16 | 6.69 | |||
| Middle Frontal Gyrus | L | 6 | 1,300 | −42 | 8 | 46 | 8.29 | <0.001 | |
| Medial Frontal Gyrus | L | 6 | −18 | 26 | 52 | 5.72 | |||
| Superior Frontal Gyrus | L | 6 | −10 | 20 | 54 | 5.68 | |||
| Inferior Frontal Gyrus | L | 13 | 2,461 | −46 | 32 | 4 | 7.72 | <0.001 | |
| Medial Frontal Gyrus | L | 10 | −6 | 56 | 2 | 7.50 | |||
| Superior Frontal Gyrus | L | 10 | −20 | 58 | 14 | 7.13 | |||
| Anterior Cingulate Gyrus | R | na | 414 | 8 | 12 | −8 | 7.24 | <0.001 | |
| Caudate | R | 12 | 14 | 6 | 6.48 | ||||
| Caudate | L | na | 390 | −10 | 12 | −10 | 7.02 | <0.001 | |
| Caudate | L | −12 | 10 | 8 | 6.91 | ||||
| Parahippocampal Gryus | L | 30 | 182 | −22 | −40 | 0 | 6.34 | <0.001 | |
| Parahippocampal Gyrus | L | 36 | −28 | −36 | −12 | 5.90 | |||
Indented regions subsumed under bolded regions of activation are part of the same cluster. One-hundred and seven cognitively normal individuals from the WRAP were included in a separate analysis to demonstrate the episodic memory task-effect
PV previously viewed faces, NV novel faces, BA Brodmann’s Area, MNI Montreal Neurological Institute, FWE Family Wise Error, L Left
Fig. 1.

Activation during the episodic memory recognition task in cognitively normal middle-aged adults. Top row: Left lateral to medial. Bottom row: Medial to right lateral. One sample t-test of 107 CN Stable subjects from WRAP comparing PV>NV (cluster-level family wise error rate of p<0.05, t=4.68)
Group comparison of fMRI episodic memory recognition task
An ANCOVA, thresholded with an empirically derived binary mask to examine differences in the BOLD response between Stables and Decliners (Decliners>Stables) revealed increased activation in the left precuneus (uncorrected p<0.005) (see Table 5, Figs 2 and 3). This result did not survive a family-wise (FWE) or false discovery rate (FDR) error correction (p<0.05) at either a voxel or cluster level. The remaining group comparisons (Stable>Decliner, Stable>MCI, Stable<MCI, Decliner>MCI, Decliner<MCI) did not reveal any differences in activation. Lastly a multiple regression with d′ did not yield any significant regions of activation at an uncorrected p<0.005.
Table 5.
Comparison between stables and decliners
| Contrast | Brain region | Hemisphere | BA | Voxels | Coordinates (MNI, x, y, z) | T (Peak) | P (uncorrected) | ||
|---|---|---|---|---|---|---|---|---|---|
| Decliner (n=34)>Stable (n=90) | Precuneus/Paracentral Lobule | L | 5 | 231 | −8 | −44 | 48 | 3.69 | 0.000 |
| Cingulate Gyrus | L | 31 | −10 | −30 | 44 | 3.42 | 0.000 | ||
| Cingulate Gyrus | L | 24 | −8 | −18 | 40 | 2.88 | 0.000 | ||
| Medial Frontal Gyrus | R | 50 | 50 | 2 | 54 | −4 | 3.22 | 0.000 | |
BA Brodmann’s Area, MNI Montreal Neurological Institute, L Left
Indented regions subsumed under bolded regions of activation are part of the same cluster
Fig. 2.

Region of increased activation in Decliners relative to Stables. a ANCOVA analysis with age, sex, FH, APOEA status, and d′ covariates between Decliner>Stables showed a cluster of activation in the left precuneus. b Plot of BOLD signal from this cluster across Stables, Decliners, and MCI subjects. c Plot of BOLD signal from this cluster across Stable and Decliners varying by ApoE+
Fig. 3.
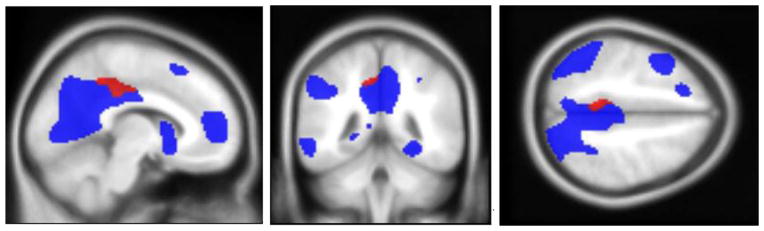
Left precuneus activation (Decliners>Stables) overlaid on the task effect map produced from the cognitively normal reference group
The effect of cerebral perfusion and atrophy
Analyses of ASL-CBF and gray matter estimates derived from T1-weighted structural data restricted to the Decliner>Stable cluster of precuneus activation did not reveal any significant differences in CBF or GMV (uncorrected p<0.005) between groups (see Fig. 4 for scatterplot of CBF and precuneus activation across three groups) Also, whole brain analysis of ASL data and T1-weighted images did not reveal differences between Stables and Decliners at an uncorrected p<0.005. Whole brain analysis of ASL data between Stables and MCI subjects revealed decreased CBF in MCI subjects within an area of the posterior cingulate cortex (PCC) that was not included in the task-effect reference mask (uncorrected p<0.005). Similarly, analysis of T1-weighted images between Stables and MCI subjects revealed significant hypotrophy in the hippocampus of MCI subjects (uncorrected p<0.005). No additional group effects were found at uncorrected p<0.005 threshold.
Fig. 4.

Plot of the cluster of activation (precuneus) from the Decliner>Stable contrast with age, sex, APOE4, and FH as covariates, showing a Decreased task performance in MCI, but no difference between Stables and Decliners, and b Plot of this cluster of activation and cerebral blood flow showing no significant group effects
The effect familial risk factors on Decliners and Stables
We used an ANCOVA with age and sex as covariates, to examine the relationship between the Stable/Decliner group status and APOE4. There was no significant interaction between group and APOE4 status in any region within the empirically derived mask or after a whole brain analysis (Fig. 2). We were unable to examine the relationship between FH status and Stable/Decliner status due to inadequate number of subjects in the Decliner/FH negative group (n=4).
Discussion
Early detection of biomarkers associated with the onset and progression of AD will help identify individuals who may benefit from potential early disease-mitigating interventions. Toward this aim, we classified a “Decliner” subset of longitudinally assessed middle-aged adults who showed very mild memory decline, but are otherwise considered to be CN. Our overall hypothesis that Decliners would show increased functional activation compared to Stables was supported. Decliners, relative to Stables, showed increased activation in the precuneus which replicated findings from our previous study (Okonkwo et al. 2014a). While there were no significant voxels in our clinical comparison model with MCI subjects, eigenvalues from the precuneus cluster plotted across all three groups demonstrated an inverted-U function showing a relative upregulation of the BOLD response in Decliners (see Fig. 2.). This finding could not be explained by fMRI task performance, basal CBF and GMV, nor common AD risk-factors (family history and APOE4) and measures of intelligence and mood.
Our finding of precuneus activation during the facial episodic memory recognition task is consistent with functional imaging studies implicating the precuneus across a variety of episodic memory retrieval tasks (Cavanna and Trimble 2006; Huijbers et al. 2012) as well as facial familiarity tasks (Natu and O’Toole 2011). While no study has specifically examined episodic recognition memory in subclinical memory decline, studies of at-risk individuals (APOE4, FH, PiB) have observed increased activation in brain regions (medial temporal lobe, parietal, prefrontal) involved in both episodic encoding and retrieval/recall (Cabeza et al. 2002; Filippini et al. 2009a; Han et al. 2007; Mormino et al. 2012). Similar to our Decliner subjects, these studies also reported preserved fMRI task-performance, suggesting that increased activation may be associated with a compensatory process (Dickerson and Sperling 2008; Wierenga and Bondi 2007). The subjects in these studies did not show neurocogntive decline as observed in both Decliners described in the present study and in studies of early MCI subjects, thus the underlying mechanism and function of compensation may vary depending on cognitive status and age (Han and Bondi 2008).
ASL-MRI was included to measure potential group differences in basal CBF as research has shown that resting CBF is inversely related to the BOLD signal and therefore should be accounted for when interpreting fMRI task-related group differences (Fleisher et al. 2009). Our analyses of ASL-MRI data did not reveal a significant group effect, suggesting hyperactivation was not associated with relatively lower basal CBF in Decliners. Similarly, studies of MCI have shown an inverse relationship between the BOLD response and hippocampal GMV, where atrophy was associated with hyperactivation and subsequent cognitive decline (Dickerson et al. 2004; Hämäläinen et al. 2007). Our analysis of GMV derived from T1-weighted structural data did not reveal differences between Stables and Decliners. We did observe an expected decrease in hippocampal GMV in MCI patients compared to Stables (Nho et al. 2012; Pennanen et al. 2005). Given the relatively younger age of our Stables and Decliners, we can infer that age and/or disease-related changes in CBF and atrophy in this sample have yet to progress to a degree that would significantly differentiate these subjects.
A number of studies have reported altered activation patterns associated with common AD-risk factors (APOE4 and FH) during episodic memory processing (Dickerson et al. 2005; Filippini et al. 2009b; Trivedi et al. 2006, 2008; Xu et al. 2009). We evaluated the influence of APOE4 on differential activation in Stables and Decliners (small sample size of Decliner/FH- precluded analysis of FH) and did not observe a significant interaction effect for APOE4 status. A plot of the precuneus cluster across each group stratified by APOE4 status revealed a within-group trend (nonsignificant) in Stables subjects, where the APOE4 genotype was associated with relatively greater task-related activation (Fig. 2), a finding observed in previous studies comparing the effect of APOE status on episodic memory processing in CN individuals (Burggren et al. 2002).
Studies of subjects along the spectrum from normal cognition to dementia show that episodic memory processing elicits an inverted-U BOLD response in which early stage MCI subjects show hyperactivation relative to CN and late-stage MCI/AD subjects (Dickerson and Sperling 2008). Based on our observation of hyperactivation in two separate groups of equivalently defined Decliner subjects, we propose that the phase of hyperactivation along this continuum may be expanded to include the earliest indication of decline in CN normal individuals (Decliners) to early MCI. This is supported by the fact that 1) Decliners underwent neuropsychological assessment over multiple longitudinal time points to confirm memory scores that were progressively worse than Stables (but still within aged-normed limits); 2) Decliners performed similar to Stables (though trended to be poorer) on fMRI task performance measures, but significantly better than MCI subjects; and 3) Decliners were slightly, yet significantly older than Stables (62.1 versus 59.1), possibly situating them closer in temporal proximity to the earliest onset of incipient neuropathological changes. Decliners will continue to be longitudinally assessed by the WRAP study in order to further test this hypothesis and elucidate their cognitive trajectory.
There are limitations to our study that deserve mention. First, the cut-point used to define cognitive decline on the RAVLT in Decliners may be susceptible to classification errors. However, it is likely that any bias or classification errors used to determine decline was randomly rather than systematically distributed throughout our cohorts. Second, neither the fMRI BOLD nor ASL data are considered clinically useful at the single-subject level due to several potential sources of variance including issues with susceptibility artifacts, variability in the cognitive demands (difficulty) of the task and strategies used, variability in age-related comorbidities in this sample affecting the hemodynamic response or the cerebral tissue itself. These data only speak to group-level comparisons, which minimize single-subject variance, but are limited to a single premorbid time-point where any clinically meaningful overlap along the continuum of cognitive decline between subjects may be obscured. Also, while our main objective was the comparison between Stable and Decliner subjects, the small number of MCI subjects reduced our statistical power to make comparisons between all three groups. Finally, our precuneus activation was significant at an uncorrected voxel level p<0.005 and did not survive multiple comparison correction, thus we must interpret any group difference in activation with caution because of the potential of false positives when using an uncorrected threshold with fMRI data. As stated above, a possible explanation is that differences between Stable and Decliner subjects are currently too subtle to survive a correction for multiple comparisons given their relatively younger age (mean age of 60 at time of imaging).
In conclusion, our study explored the influence of subtle memory changes in a middle-aged CN cohort on episodic memory functioning. Individuals classified as Decliners based on consistent memory decline on the RAVLTshowed increased precuneus activation relative to Stables on an episodic recognition memory task. This finding was not explained by basal GMV, CBF, APOE4 status, or psychological and neuropsychological measures. Increased activation in Decliners relative to Stable and MCI patients demonstrates the inverted-U function suggesting that aberrant task-induced activation patterns may be related to a phase of preclinical AD and occur within the context of subtle memory changes at an even earlier time point along the continuum from normal cognition to more clinically-apparent cognitive decline. The possible absence of significant age/disease-related changes in this relatively younger cohort may have restricted the power of our fMRI analyses, thus continued longitudinal follow-up will be necessary to determine if the subtle changes predict more severe decline.
Acknowledgments
This research was supported by NIA grants R01 AG021155 and R01 AG027161 (SCJ); by a Veterans Administration Merit Review Grant I01CX000165 (SCJ); and by a Veterans Administration Geriatrics Research and Clinical Center (GRECC) Advanced Fellowship in Geriatrics and Aging at the William S. Middleton Memorial Veterans Hospital, Madison, WI (CRN). Portions of this research were supported by the Helen Bader Foundation, Northwestern Mutual Foundation, Extendicare Foundation, and from the Veterans Administration including facilities and resources at the GRECC, Madison, WI.
We gratefully acknowledge the support of researchers and staff at the Waisman Center, University of Wisconsin–Madison, where the brain scans took place. Finally, we thank participants in the Wisconsin Registry for Alzheimer’s Prevention for their continued dedication.
Footnotes
Disclosure statement Nicholas, Okonkwo, Oh, Bendlin, Hermann, Asthana, Sager, and Johnson report no conflicts of interest.
Rowley has provided consultation to and/or received honoraria from GE Healthcare, Bracco, Lundbeck, HL Gore, and Eli Lilly.
All procedures followed were in accordance with the ethical standards of the responsible committee on human experimentation (institutional and national) and with the Helsinki Declaration of 1975, as revised in 2000. Informed consent was obtained from all patients for being included in the study.
Contributor Information
Christopher R. Nicholas, GRECC, William S. Middleton Memorial VA Hospital, Madison, WI, USA. Wisconsin Alzheimer’s Institute, University of Wisconsin School of Medicine and Public Health, Madison, WI, USA. Alzheimer’s Disease Research Center, University of Wisconsin School of Medicine and Public Health, Madison, WI, USA
Ozioma C. Okonkwo, GRECC, William S. Middleton Memorial VA Hospital, Madison, WI, USA. Wisconsin Alzheimer’s Institute, University of Wisconsin School of Medicine and Public Health, Madison, WI, USA. Alzheimer’s Disease Research Center, University of Wisconsin School of Medicine and Public Health, Madison, WI, USA
Barbara B. Bendlin, Wisconsin Alzheimer’s Institute, University of Wisconsin School of Medicine and Public Health, Madison, WI, USA. Alzheimer’s Disease Research Center, University of Wisconsin School of Medicine and Public Health, Madison, WI, USA
Jennifer M. Oh, Alzheimer’s Disease Research Center, University of Wisconsin School of Medicine and Public Health, Madison, WI, USA
Sanjay Asthana, GRECC, William S. Middleton Memorial VA Hospital, Madison, WI, USA. Alzheimer’s Disease Research Center, University of Wisconsin School of Medicine and Public Health, Madison, WI, USA.
Howard A. Rowley, Alzheimer’s Disease Research Center, University of Wisconsin School of Medicine and Public Health, Madison, WI, USA
Bruce Hermann, Wisconsin Alzheimer’s Institute, University of Wisconsin School of Medicine and Public Health, Madison, WI, USA.
Mark A. Sager, Wisconsin Alzheimer’s Institute, University of Wisconsin School of Medicine and Public Health, Madison, WI, USA. Alzheimer’s Disease Research Center, University of Wisconsin School of Medicine and Public Health, Madison, WI, USA
Sterling C. Johnson, Email: scj@medicine.wisc.edu, GRECC, William S. Middleton Memorial VA Hospital, Madison, WI, USA. Wisconsin Alzheimer’s Institute, University of Wisconsin School of Medicine and Public Health, Madison, WI, USA. Alzheimer’s Disease Research Center, University of Wisconsin School of Medicine and Public Health, Madison, WI, USA. William S. Middleton Memorial VA Hospital, 2500 Overlook Terrace (11G), GRECC, Madison, WI 53705, USA
References
- Albert MS, Moss MB, Tanzi R, Jones K. Preclinical prediction of AD using neuropsychological tests. Journal of International Neuropsychological Society. 2001;7(5):631–639. doi: 10.1017/s1355617701755105. [DOI] [PubMed] [Google Scholar]
- Albert MS, DeKosky ST, Dickson D, Dubois B, Feldman HH, Fox NC, Gamst A, Holtzman DM, Jagust WJ, Petersen RC, Snyder PJ, Carrillo MC, Thies B, Phelps CH. The diagnosis of mild cognitive impairment due to Alzheimer’s disease: recommendations from the National Institute on Aging-Alzheimer’s Association workgroups on diagnostic guidelines for Alzheimer’s disease. Alzheimer’s & Dementia. 2011;7(3):270–279. doi: 10.1016/j.jalz.2011.03.008. [DOI] [PMC free article] [PubMed] [Google Scholar]
- Ashburner J, Friston KJ. Unified segmentation. NeuroImage. 2005;26(3):839–851. doi: 10.1016/j.neuroimage.2005.02.018. [DOI] [PubMed] [Google Scholar]
- Bäckman L, Small BJ, Fratiglioni L. Stability of the preclinical episodic memory deficit in Alzheimer’s disease. Brain. 2001;124(1):96–102. doi: 10.1093/brain/124.1.96. [DOI] [PubMed] [Google Scholar]
- Blacker D, Lee H, Muzikansky A, Martin EC, Tanzi R, McArdle JJ, Albert M. Neuropsychological measures in normal individuals that predict subsequent cognitive decline. Archives of Neurology. 2007;64(6):862–871. doi: 10.1001/archneur.64.6.862. [DOI] [PubMed] [Google Scholar]
- Buckner RL, Snyder AZ, Shannon BJ, LaRossa G, Sachs R, Fotenos AF, Mintun MA. Molecular, structural, and functional characterization of Alzheimer’s disease: evidence for a relationship between default activity, amyloid, and memory. Journal of Neuroscience. 2005;25(34):7709–7717. doi: 10.1523/JNEUROSCI.2177-05.2005. [DOI] [PMC free article] [PubMed] [Google Scholar]
- Burggren AC, Small GW, Sabb FW, Bookheimer SY. Specificity of brain activation patterns in people at genetic risk for Alzheimer disease. American Journal of Geriatric Psychiatry. 2002;10(1):44–51. doi: 10.1176/appi.ajgp.10.1.44. [DOI] [PubMed] [Google Scholar]
- Cabeza R, Anderson ND, Locantore JK, McIntosh AR. Aging gracefully: compensatory brain activity in high-performing older adults. NeuroImage. 2002;17(3):1394–1402. doi: 10.1006/nimg.2002.1280. [DOI] [PubMed] [Google Scholar]
- Cavanna AE, Trimble MR. The precuneus: a review of its functional anatomy and behavioural correlates. Brain. 2006;129(3):564–583. doi: 10.1093/brain/awl004. [DOI] [PubMed] [Google Scholar]
- Chen P, Ratcliff G, Belle SH, Cauley JA, DeKosky ST, Ganguli M. Patterns of cognitive decline in presymptomatic Alzheimer disease: a prospective community study. Archives of General Psychiatry. 2001;58(9):853–858. doi: 10.1001/archpsyc.58.9.853. [DOI] [PubMed] [Google Scholar]
- Dai W, Garcia D, de Bazelaire C, Alsop DC. Continuous flow-driven inversion for arterial spin labeling using pulsed radio frequency and gradient fields. Magnetic Resonance in Medicine. 2008;60(6):1488–1497. doi: 10.1002/mrm.21790. [DOI] [PMC free article] [PubMed] [Google Scholar]
- Dickerson BC, Sperling RA. Functional abnormalities of the medial temporal lobe memory system in mild cognitive impairment and Alzheimer’s disease: insights from functional MRI studies. Neuropsychologia. 2008;46(6):1624–1635. doi: 10.1016/j.neuropsychologia.2007.11.030. [DOI] [PMC free article] [PubMed] [Google Scholar]
- Dickerson BC, Salat DH, Bates JF, Atiya M, Killiany RJ, Greve DN, Sperling RA. Medial temporal lobe function and structure in mild cognitive impairment. Annals of Neurology. 2004;56(1):27–35. doi: 10.1002/ana.20163. [DOI] [PMC free article] [PubMed] [Google Scholar]
- Dickerson BC, Salat DHP, Greve DNP, Chua EFB, Rand-Giovannetti EB, Rentz DMP, Sperling RAM. Increased hippocampal activation in mild cognitive impairment compared to normal aging and AD. Neurology. 2005;65(3):404–411. doi: 10.1212/01.wnl.0000171450.97464.49. [DOI] [PMC free article] [PubMed] [Google Scholar]
- Dudas RB, Clague F, Thompson SA, Graham KS, Hodges JR. Episodic and semantic memory in mild cognitive impairment. Neuropsychologia. 2005;43(9):1266–1276. doi: 10.1016/j.neuropsychologia.2004.12.005. [DOI] [PubMed] [Google Scholar]
- Elias MF, Beiser A, Wolf PA, Au R, White RF, D’Agostino RB. The preclinical phase of alzheimer disease: a 22-year prospective study of the Framingham Cohort. Archives of Neurology. 2000;57(6):808–813. doi: 10.1001/archneur.57.6.808. [DOI] [PubMed] [Google Scholar]
- Filippini N, MacIntosh BJ, Hough MG, Goodwin GM, Frisoni GB, Smith SM, Mackay CE. Distinct patterns of brain activity in young carriers of the APOE-epsilon4 allele. Proceedings of the National Academy of Sciences of the United States of America. 2009a;106(17):7209–7214. doi: 10.1073/pnas.0811879106. [DOI] [PMC free article] [PubMed] [Google Scholar]
- Filippini N, MacIntosh BJ, Hough MG, Goodwin GM, Frisoni GB, Smith SM, Mackay CE. Distinct patterns of brain activity in young carriers of the APOE-ε4 allele. Proceedings of the National Academy of Sciences. 2009b;106(17):7209–7214. doi: 10.1073/pnas.0811879106. [DOI] [PMC free article] [PubMed] [Google Scholar]
- Fleisher AS, Podraza KM, Bangen KJ, Taylor C, Sherzai A, Sidhar K, Buxton RB. Cerebral perfusion and oxygenation differences in Alzheimer’s disease risk. Neurobiology of Aging. 2009;30(11):1737–1748. doi: 10.1016/j.neurobiolaging.2008.01.012. [DOI] [PMC free article] [PubMed] [Google Scholar]
- Folstein MF, Folstein SE, McHugh PR. Mini-mental state: a practical method for grading the cognitive state of patients for the clinician. Journal of Psychiatric Research. 1975;12:189–198. doi: 10.1016/0022-3956(75)90026-6. [DOI] [PubMed] [Google Scholar]
- Garcia DM, Duhamel G, Alsop DC. Efficiency of inversion pulses for background suppressed arterial spin labeling. Magnetic Resonance in Medicine. 2005;54(2):366–372. doi: 10.1002/mrm.20556. [DOI] [PubMed] [Google Scholar]
- Greene JD, Baddeley AD, Hodges JR. Analysis of the episodic memory deficit in early Alzheimer’s disease: evidence from the doors and people test. Neuropsychologia. 1996;34(6):537–551. doi: 10.1016/0028-3932(95)00151-4. [DOI] [PubMed] [Google Scholar]
- Hämäläinen A, Pihlajamäki M, Tanila H, Hänninen T, Niskanen E, Tervo S, Karjalainen PA, Vanninen RL, Soininen H. Increased fMRI responses during encoding in mild cognitive impairment. Neurobiology of Aging. 2007;28(12):1889–1903. doi: 10.1016/j.neurobiolaging.2006.08.008. [DOI] [PubMed] [Google Scholar]
- Han SD, Bondi MW. Revision of the apolipoprotein E compensatory mechanism recruitment hypothesis. Alzheimers Dement. 2008;4(4):251–254. doi: 10.1016/j.jalz.2008.02.006. [DOI] [PubMed] [Google Scholar]
- Han SD, Houston WS, Jak AJ, Eyler LT, Nagel BJ, Fleisher AS, Bondi MW. Verbal paired-associate learning by APOE genotype in non-demented older adults: fMRI evidence of a right hemispheric compensatory response. Neurobiology of Aging. 2007;28(2):238–247. doi: 10.1016/j.neurobiolaging.2005.12.013. [DOI] [PMC free article] [PubMed] [Google Scholar]
- Harvey LO., Jr The critical operating characteristic and the evaluation of expert judgment. Organizational Behavior and Human Decision Processes. 1992;53:229–251. [Google Scholar]
- Huijbers W, Vannini P, Sperling RA, Pennartz CM, Cabeza R, Daselaar SM. Explaining the encoding/retrieval flip: memory-related deactivations and activations in the posteromedial cortex. Neuropsychologia. 2012;50(14):3764–3774. doi: 10.1016/j.neuropsychologia.2012.08.021. [DOI] [PMC free article] [PubMed] [Google Scholar]
- Miller SL, Fenstermacher E, Bates J, Blacker D, Sperling RA, Dickerson BC. Hippocampal activation in adults with mild cognitive impairment predicts subsequent cognitive decline. Journal of Neurology, Neurosurgery & Psychiatry. 2008;79(6):630–635. doi: 10.1136/jnnp.2007.124149. [DOI] [PMC free article] [PubMed] [Google Scholar]
- Minear M, Park D. A lifespan database of adult facial stimuli. Behavior Research Methods, Instruments, & Computers. 2004;36(4):630–633. doi: 10.3758/bf03206543. [DOI] [PubMed] [Google Scholar]
- Mormino EC, Brandel MG, Madison CM, Marks S, Baker SL, Jagust WJ. Aβ deposition in aging is associated with increases in brain activation during successful memory encoding. Cerebral Cortex. 2012;22(8):1813–1823. doi: 10.1093/cercor/bhr255. [DOI] [PMC free article] [PubMed] [Google Scholar]
- Natu V, O’Toole AJ. The neural processing of familiar and unfamiliar faces: a review and synopsis. British Journal of Psychology. 2011;102(4):726–747. doi: 10.1111/j.2044-8295.2011.02053.x. [DOI] [PubMed] [Google Scholar]
- Nho K, Risacher SL, Crane PK, DeCarli C, Glymour MM, Habeck C, Saykin AJ. Voxel and surface-based topography of memory and executive deficits in mild cognitive impairment and Alzheimer’s disease. Brain Imaging and Behavior. 2012;6(4):551–567. doi: 10.1007/s11682-012-9203-2. [DOI] [PMC free article] [PubMed] [Google Scholar]
- Okonkwo OC, Oh JM, Koscik R, Jonaitis E, Cleary CA, Dowling NM, Johnson SC. Amyloid burden, neuronal function, and cognitive decline in middle-aged adults at risk for Alzheimer’s disease. Journal of International Neuropsychological Society. 2014a;20(4):422–433. doi: 10.1017/S1355617714000113. [DOI] [PMC free article] [PubMed] [Google Scholar]
- Okonkwo OC, Xu G, Oh JM, Dowling NM, Carlsson CM, Gallagher CL, Johnson SC. Cerebral blood flow is diminished in asymptomatic middle-aged adults with maternal history of Alzheimer’s disease. Cerebral Cortex. 2014b;24(4):978–988. doi: 10.1093/cercor/bhs381. [DOI] [PMC free article] [PubMed] [Google Scholar]
- Pennanen C, Testa C, Laakso MP, Hallikainen M, Helkala EL, Hänninen T, Soininen H. A voxel based morphometry study on mild cognitive impairment. Journal of Neurology, Neurosurgery & Psychiatry. 2005;76(1):11–14. doi: 10.1136/jnnp.2004.035600. [DOI] [PMC free article] [PubMed] [Google Scholar]
- Petrella JR, Prince SE, Wang L, Hellegers C, Doraiswamy PM. Prognostic value of posteromedial cortex deactivation in mild cognitive impairment. PLoS ONE. 2007;2(10):e1104. doi: 10.1371/journal.pone.0001104. [DOI] [PMC free article] [PubMed] [Google Scholar]
- Reitan R, Wolfson D. The Halstead-Reitan neuropsychological test battery: theory and clinical interpretation. Tucson: Neuropsychology Press; 1993. [Google Scholar]
- Sager MA, Hermann B, La Rue A. Middle-aged children of persons with Alzheimer’s disease: APOE genotypes and cognitive function in the Wisconsin Registry for Alzheimer’s Prevention. Journal of Geriatric Psychiatry and Neurology. 2005;18(4):245–249. doi: 10.1177/0891988705281882. [DOI] [PubMed] [Google Scholar]
- Schmidt M. Rey auditory verbal learning test: a handbook. Torrance, CA: Western Psychological Services; 1996. [Google Scholar]
- Trivedi MA, Schmitz TW, Ries ML, Torgerson BM, Sager MA, Hermann BP, Johnson SC. Reduced hippocampal activation during episodic encoding in middle-aged individuals at genetic risk of Alzheimer’s disease: a cross-sectional study. BMC Medicine. 2006;4:1. doi: 10.1186/1741-7015-4-1. [DOI] [PMC free article] [PubMed] [Google Scholar]
- Trivedi MA, Schmitz TW, Ries ML, Hess TM, Fitzgerald ME, Atwood CS, Johnson SC. fMRI activation during episodic encoding and metacognitive appraisal across the lifespan: risk factors for Alzheimer’s disease. Neuropsychologia. 2008;46(6):1667–1678. doi: 10.1016/j.neuropsychologia.2007.11.035. [DOI] [PMC free article] [PubMed] [Google Scholar]
- Vannini P, O’Brien J, O’Keefe K, Pihlajamaki M, Laviolette P, Sperling RA. What goes down must come up: role of the posteromedial cortices in encoding and retrieval. Cerebral Cortex. 2011;21(1):22–34. doi: 10.1093/cercor/bhq051. [DOI] [PMC free article] [PubMed] [Google Scholar]
- Wagner AD, Shannon BJ, Kahn I, Buckner RL. Parietal lobe contributions to episodic memory retrieval. Trends in Cognitive Sciences. 2005;9(9):445–453. doi: 10.1016/j.tics.2005.07.001. [DOI] [PubMed] [Google Scholar]
- Weintraub S, Salmon D, Mercaldo N, Ferris S, Graff-Radford NR, Chui H, Morris JC. The Alzheimer’s disease centers’ Uniform Data Set (UDS): the neuropsychologic test battery. Alzheimer Disease and Associated Disorders. 2009;23(2):91–101. doi: 10.1097/WAD.0b013e318191c7dd. [DOI] [PMC free article] [PubMed] [Google Scholar]
- Wierenga CE, Bondi MW. Use of functional magnetic resonance imaging in the early identification of Alzheimer’s disease. Neuropsychology Review. 2007;17(2):127–143. doi: 10.1007/s11065-007-9025-y. [DOI] [PMC free article] [PubMed] [Google Scholar]
- Xu G, McLaren DG, Ries ML, Fitzgerald ME, Bendlin BB, Rowley HA, Johnson SC. The influence of parental history of Alzheimer’s disease and apolipoprotein E epsilon4 on the BOLD signal during recognition memory. Brain. 2009;132(Pt 2):383–391. doi: 10.1093/brain/awn254. [DOI] [PMC free article] [PubMed] [Google Scholar]
- Xu G, Rowley HA, Wu G, Alsop DC, Shankaranarayanan A, Dowling M, Johnson SC. Reliability and precision of pseudo-continuous arterial spin labeling perfusion MRI on 3.0T and comparison with 15O-water PET in elderly subjects at risk for Alzheimer’s disease. NMR in Biomedicine. 2010;23(3):286–293. doi: 10.1002/nbm.1462. [DOI] [PMC free article] [PubMed] [Google Scholar]
- Ye FQ, Frank JA, Weinberger DR, McLaughlin AC. Noise reduction in 3D perfusion imaging by attenuating the static signal in arterial spin tagging (ASSIST) Magnetic Resonance in Medicine. 2000;44(1):92–100. doi: 10.1002/1522-2594(200007)44:1<92::aid-mrm14>3.0.co;2-m. [DOI] [PubMed] [Google Scholar]