

Abstract
While early-life body leanness is associated with increased breast cancer risk, early-life physical activity may protect against breast cancer. We examined whether the excess risk among lean girls is modified by their levels of prior, concurrent, or future physical activity. We conducted an analysis among 74,723 women in the Nurses’ Health Study II (follow-up 1997–2011). Participants recalled their body size at ages 5, 10, and 20 years in 1989 using a 9-level pictogram (level 1: most lean). In 1997, they reported adolescent levels of physical activity (ages 12–13 and 14–17 years). Cox proportional hazards models estimated the overall association of body size with breast cancer risk and assessed interactions of adolescent physical activity with body size at three different age periods (5–10, 10–20, and 20 years), adjusting for early-life and adult risk factors for breast cancer. Regardless of levels of adolescent physical activity, early-life body leanness (level 1–2 vs. 4.5+) was significantly associated with higher breast cancer risk. The association was slightly attenuated among those who were active (60+ MET-hr/wk) during adolescence compared to those who were inactive (<30 MET-hr/wk) (body size at ages 5–10 years: hazard ratio=1.37, 95% confidence interval=1.04–1.81 vs. 1.66, 1.29–2.12), but the interaction was not significant (p=0.72). The results were similar for body size at three different age periods. Being lean during early life is a risk factor for breast cancer among both inactive and active girls. Adolescent physical activity did not significantly modify the association, although some interaction cannot be excluded.
Keywords: early life, body fatness, overweight, physical activity, breast cancer
INTRODUCTION
Evidence consistently supports that early-life body fatness is associated with decreased breast cancer risk in both premenopausal 1–5 and postmenopausal 1, 2, 4–7 women. In our prior analysis in the Nurses’ Health Study (NHS) and NHSII cohorts we observed that childhood and adolescent body fatness was significantly associated with a 20–50% decreased breast cancer risk regardless of menopausal status 4. The association did not change after adjustment for adult body mass index (BMI) 4 suggesting an independent, lifelong protection from breast cancer. Although most studies were conducted among Caucasian women 3–6, 8, 9, the inverse association was confirmed in African American 2, 10, Hispanic 11, and Asian women 1, 7. This finding contrasts with adult obesity, which increases the risk of postmenopausal breast cancer 12. The hypothesized underlying mechanisms are increased anovulation 13, 14, altered circulating levels of hormones (e.g., estrogen, IGF-1) 15, 16, altered development of breast tissue (e.g., breast density) 17, 18, and decelerated adolescent growth 19 in heavier girls.
While early-life body leanness may be a risk factor for breast cancer, some evidence suggests a modest inverse association between early-life physical activity and later breast cancer risk 20. In a recent analysis in the NHSII, we observed that physical activity (highest vs. lowest quintiles) at ages 14–17 years was associated with a 15% lower risk of premenopausal breast cancer 21. Thus, we hypothesized that an excess risk associated with early-life body leanness may be attenuated among women who engaged in high levels of activity during their adolescence. An interaction between these two factors is biologically plausible because they share potential mechanisms such as change in IGF-1 and sex hormones levels 15, 16, 22, age at menarche 23–25, and menstrual cycle patterns 23, 26. Furthermore, high levels of physical activity may help maintain a lean body weight, which we hypothesized may not increase the risk among girls who became lean as a result of physical activity. In contrast, being lean despite being inactive may result from a carcinogenic hormonal profile (e.g., high androgen).
To our knowledge, only one study to date has examined the potential interaction between early-life body size and physical activity on breast cancer risk (p-interaction=0.02) 27. However, this study was a retrospective, case-control study where participants recalled their body size and activity levels after their diagnosis of breast cancer. In a prospective analysis within the NHSII cohort, we considered three different questions when assessing the interactions between body size and physical activity on the risk of breast cancer, with respect to the timing of each. First, we assessed an interaction between body size and ‘future’ physical activity to address the question of whether a girl with a given body size could alter her risk profile by engaging in high levels of activity immediately afterward. Next, we assessed an interaction between ‘concurrent’ body size and physical activity. Finally, we assessed physical activity ‘prior’ to body size to address the question of risk among lean girls who may have been lean as a result of physical activity.
MATERIALS AND METHODS
Study population
The NHSII is an ongoing cohort study that began in 1989, including 116,430 female registered nurses aged 25–42 years. An initial self-administered questionnaire was mailed to collect information on health behaviors, lifestyle and reproductive factors, and medical histories. Biennial follow-up questionnaires updated information on known and suspected risk factors for breast cancer, as well as new disease diagnoses. Response rates are >90% based on cumulative person-time of follow-up.
The follow-up of this analysis began in 1997 when adolescent physical activity was assessed. We excluded women who died or had a diagnosis of cancer, other than nonmelanoma skin cancer, prior to 1997, or did not report their early-life body size or physical activity.
This study was approved by the Committee on the Use of Human Subjects in Research at Brigham and Women’s Hospital (Boston, Massachusetts). Completion of the self-administered questionnaire was considered to imply informed consent.
Assessment of body size
In 1989, participants were asked to recall their body size at ages 5, 10, and 20 years using a 9-level pictogram (Figure 1) 28. According to a validation study conducted within the Third Harvard Growth study, a Boston-area longitudinal study of schoolchildren initiated in 1922, recalled body size using this pictogram by older women at ages 71–76 years (n=100) has a good correlation with their BMI measured while they were at ages 5 (Pearson r=0.60), 10 (r=0.65), and 20 years (r=0.66) 29. We averaged body size at ages 5 and 10 years and ages 10 and 20 years to obtain estimates of childhood and adolescent body size, respectively. Higher levels (>5) of body size were collapsed because there were fewer women in those levels. For stratification analyses, the levels with a similar risk (i.e., level 1 and 2) were collapsed to increase power.
Figure 1.
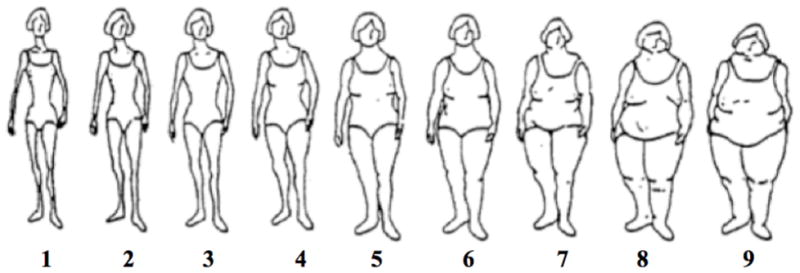
A 9-level figure drawing used to assess body fatness at ages 5, 10, 20 years in the Nurses’ Health Study II (Reproduced from Stunkard et al. 1983 28).
Assessment of physical activity
In 1997, participants were asked to recall their average hours per week spent on strenuous (e.g. running, swimming laps) and moderate (e.g. hiking, casual cycling) recreational activities, and walking (to and from school or work) during grades 7–8 (ages 12–13) and 9–12 (ages 14–17). Within a subsample of 160 NHSII participants, the 4-year reproducibility of recalled activities using this questionnaire was good (r=0.64 for total activity) 30.
We calculated participants’ metabolic equivalent (MET)-hour/week of total physical activity by multiplying the number of hours per week of each activity with its corresponding average MET values (strenuous = 7 METs; moderate = 4.5 METs; walking=3 METs) 31 and then summing the values from all activities. We averaged total activity (sum of recreational activities and walking) at ages 12–13 and 14–17 years to obtain an estimate of adolescent activity. Because we previously observed the strongest association with breast cancer by activity at ages 14–17 years 21, we conducted a sensitivity analysis using only physical activity at ages 14–17 years.
Ascertainment of breast cancer cases
Breast cancer cases diagnosed through May 31, 2011 were identified by self-administered biennial questionnaire and the National Death Index, and confirmed by reviewing medical records. Information on tumor characteristics was abstracted from the pathology reports. The analysis included both premenopausal and postmenopausal cases and both invasive and in situ cases because the association with early-life body size did not vary by these characteristics 4. A total of 2,641 cases were identified during 1997–2011 follow-up (622 in situ and 1,769 invasive cases confirmed by medical records; 1,683 estrogen receptor-positive and 381 estrogen receptor-negative tumors). Among those with medical records, 99% of reported cases were confirmed; therefore, we included 250 breast cancer cases for whom the medical records were missing and only verbally confirmed by telephone.
Covariate assessment
Height, adolescent alcohol intake, adolescent smoking status, age at menarche, menstrual length and pattern at ages 18–22 years, and BMI at age 18 were reported once via the 1989 baseline questionnaire. Age, parity/age at first birth, personal history of benign breast disease, oral contraceptive use, smoking, menopausal status, and current BMI were updated biennially and family history of breast cancer was updated every 4 years since 1989. Birth weight was assessed in 1991 and adolescent physical activity in 1997. Adult alcohol intake was reported in 1991 and updated every 4 years. Adult physical activity was reported in 1989, 1991, 1997, 2001, 2005 and 2009.
Statistical analysis
Each woman contributed person-time from the return date of her questionnaire in 1997 until a diagnosis of cancer except nonmelanoma skin cancer, death, or the end of follow-up on June 1, 2011, whichever came earlier. Cox proportional hazards models were used to estimate hazard ratios (HR) and their 95% confidence intervals (CI) for categories of body size. We performed tests for trend by modeling body size as a continuous variable (level 1–9).
Multivariate-adjusted models included both early-life and adult risk factors for breast cancer. Body size at different age periods during early-life were not simultaneously adjusted in the model because they were strongly correlated with each other (r = 0.5–0.8). Covariates that were reported more than once during the follow up were treated as time-varying covariates. Because age at menarche, menstrual pattern at ages 18–22 years, BMI at age 18 (for body size at ages 5–10 years only), and current BMI could be intermediate variables through which early-life body size is associated with breast cancer, we adjusted for them only in secondary analyses.
To assess whether the association varied by the level of adolescent physical activity, we stratified the participants by approximate tertiles (inactive, moderately active, active: <30, 30–59.9, 60+ MET-hr/wk). To assess the joint effect of body size and physical activity, we cross-classified by both body size and physical activity and estimated the HR using the most overweight and inactive (<30 MET-hr/wk) group as a reference. The same analyses were performed on: 1) childhood body size and adolescent (‘future’) physical activity, 2) adolescent body size and adolescent (‘concurrent’) physical activity, and 3) body size at age 20 years and adolescent (‘prior’) physical activity. Likelihood ratio tests compared models with and without interaction terms to determine significance of the interactions. We repeated the analyses after restricting to premenopausal women (1,364 cases) because adolescent activity is suggestively more strongly associated with the risk of premenopausal breast cancer 21. For these analyses, women contributed person-time only while they were premenopausal.
Lastly, we used a competing risks Cox proportional hazards model 32, 33, using a data augmentation method 34, to assess whether the interaction differed by estrogen receptor (ER) status of tumor. A separate observation was created for each subject for each type of tumor (ER+/−) and stratified the data on event type, allowing for estimation of separate associations with each type of tumor. Likelihood ratio tests compared models that assumed different associations for each type of tumor with models that assumed the same association. All statistical tests were two-sided with 5% type I error and performed using SAS software version 9.
RESULTS
The mean age at the beginning of follow-up was 42 years for the 74,723 women who were included in our analysis. Compared with women who were overweight during childhood, those who were lean were more likely to be older at menarche, engage in higher levels of physical activity, and have lower BMI later in life (Table 1). These women were also less likely to have weighed 3.9 kg or more at birth and have smoked during adolescence and adulthood, and more likely to have a personal history of benign breast disease.
Table 1.
Baseline characteristics of study population in 1997 by average childhood (ages 5–10 years) self-reported body size in the Nurses’ Health Study II (N=74,723)a
| Average body size at ages 5–10 years (Levelb) | |||||
|---|---|---|---|---|---|
| 1 | 1.5–2 | 2.5–3 | 3.5–4 | 4.5+ c | |
| N | 12,609 | 22,846 | 18,960 | 12,759 | 7,549 |
| Mean (SD) or Percentage | |||||
| Age (years) | 42.5 (4.8) | 41.8 (4.7) | 42.0 (4.6) | 42.3 (4.6) | 42.5 (4.6) |
| Height (inches) | 64.9 (2.6) | 64.9 (2.6) | 64.8 (2.6) | 64.9 (2.6) | 65.1 (2.6) |
| Birth weight ≥ 3.9 kg, % | 10.0 | 11.5 | 13.9 | 16.2 | 18.7 |
| Age at menarche (years) | 12.8 (1.4) | 12.6 (1.4) | 12.3 (1.4) | 12.1 (1.4) | 12.0 (1.4) |
| Menstrual cycle pattern at ages 18–22 years | |||||
| - Irregular or no periods, % | 24.5 | 23.3 | 23.9 | 24.4 | 26.5 |
| Time to menstrual regularity since menarche | |||||
| - 5+ years, % | 23.3 | 21.8 | 21.7 | 22.4 | 24.8 |
| BMI at age 18 years (kg/m2) | 19.4 (2.1) | 20.2 (2.3) | 21.5 (2.8) | 22.7 (3.3) | 24.4 (4.7) |
| Total physical activity at ages 12–17 years (MET-hr/wk) | 56.3 (37.9) | 54.5 (35.9) | 51.9 (35.2) | 48.4 (33.9) | 46.0 (33.8) |
| Alcohol drinkers at ages 15–17 years, % | 22.8 | 23.0 | 23.0 | 23.6 | 23.2 |
| Alcohol intake at ages 15–17 years among drinkers (g/day) | 4.6 (6.3) | 4.2(5.4) | 4.3(5.4) | 4.7(6.5) | 4.9(7.5) |
| Total caloric intake during high school, kcal/d | 2465 (580) | 2488 (566) | 2493 (557) | 2486 (573) | 2505 (561) |
| Smoking at ages 10–20 years, % | 31.0 | 30.1 | 31.4 | 34.1 | 38.0 |
| Current BMI (kg/m2) | 23.8 (4.2) | 24.6 (4.8) | 26.4 (5.9) | 28.1 (6.7) | 30.0 (7.7) |
| Current total physical activity (MET-hr/wk) | 19.1 (24.7) | 18.7 (22.3) | 18.2 (22.2) | 18.3 (22.5) | 17.5 (21.8) |
| Current alcohol intake (g/day) | 3.5 (6.6) | 3.5 (6.4) | 3.5 (6.6) | 3.5 (6.9) | 3.3 (6.7) |
| Current smoking status | |||||
| - Never, % | 66.7 | 68.0 | 66.6 | 63.8 | 59.6 |
| - Past, % | 22.9 | 23.4 | 24.4 | 25.4 | 27.2 |
| - Current, % | 10.3 | 8.6 | 9.0 | 10.8 | 13.2 |
| Ever use of oral contraceptives | |||||
| - Never, % | 11.7 | 12.9 | 14.0 | 14.2 | 15.6 |
| - Past users, % | 79.1 | 78.4 | 77.9 | 77.5 | 76.6 |
| - Current users, % | 9.1 | 8.7 | 8.1 | 8.3 | 7.7 |
| Parous, % | 80.7 | 82.4 | 81.1 | 78.9 | 73.1 |
| Parity among parous women | 2.2 (0.9) | 2.3 (0.9) | 2.3 (0.9) | 2.2 (0.9) | 2.2 (0.9) |
| Age at first birth among parous women (years) | 26.3 (4.6) | 26.5 (4.6) | 26.5 (4.6) | 26.5 (4.6) | 26.5 (4.7) |
| Premenopausal women, % | 88.2 | 89.2 | 89.7 | 89.4 | 88.7 |
| First-degree family history of breast cancer, % | 9.6 | 9.7 | 9.3 | 9.3 | 9.5 |
| Personal history of benign breast disease, % | 46.9 | 45.5 | 44.7 | 43.4 | 43.3 |
Values are standardized to the age distribution of the study population. Abbreviations: SD: standard deviation; kg: kilograms; g: grams; m: meters; BMI: body mass index; MET-hr/wk: metabolic equivalent of task-hour/week; kcal/d: kilocalorie per day.
Participants recalled their body size at ages 5 and 10 years using a 9-level pictogram (level 1: most lean; level 9: most overweight). We averaged body size at ages 5 and 10 years to obtain an estimate of childhood body size.
Higher levels (4.5 to 9) were collapsed because there were fewer women in those levels.
Body size at ages 5 to 20 years were all significantly inversely associated with breast cancer risk (Table 2). Women who were lean (level 1 vs. 4.5+) during their childhood had a 55% higher risk compared to the women who were overweight, adjusting for adolescent and adult risk factors for breast cancer (HR=1.55, 95% CI=1.31–1.83; p-trend<0.0001). The estimates were similar to those from age-adjusted models. The association became slightly stronger when menstrual characteristics were added to the model; the change was primarily driven by age at menarche. Adjustment for current adult BMI only slightly attenuated the association (HR=1.48, 95% CI=1.24–1.75) and adjustment for BMI at age 18 somewhat attenuated the association (HR=1.38, 95% CI=1.15–1.65).
Table 2.
Hazard ratios of breast cancer according to self-reported early-life body size in the Nurses’ Health Study II, 1997–2011
| Average body size (level)a | Per 1-unit decrease in body size | p-trendf | |||||
|---|---|---|---|---|---|---|---|
| 1 | 1.5 – 2 | 2.5 – 3 | 3.5 – 4 | 4.5+ | |||
| Hazard Ratio (95% Confidence Interval) | |||||||
|
|
|||||||
| AGES 5–10 YEARS | |||||||
| No. of cases | 503 | 895 | 643 | 404 | 196 | ||
| Person-years | 168,232 | 305,585 | 253,570 | 170,207 | 100,788 | ||
| Age-adjusted | 1.53 (1.30, 1.81) | 1.57 (1.34, 1.83) | 1.35 (1.15, 1.58) | 1.24 (1.04, 1.47) | 1.00 (Ref) | 1.10 (1.07, 1.14) | <0.0001 |
| MVb -adjusted | 1.55 (1.31, 1.83) | 1.56 (1.33, 1.82) | 1.35 (1.15, 1.58) | 1.24 (1.04, 1.47) | 1.00 (Ref) | 1.11 (1.07, 1.14) | <0.0001 |
| MVb without physical activityc | 1.53 (1.30, 1.81) | 1.54 (1.32, 1.80) | 1.34 (1.14, 1.57) | 1.24 (1.04, 1.47) | 1.00 (Ref) | 1.10 (1.07, 1.14) | <0.0001 |
| MVb + Menstrual characteristicsd | 1.63 (1.38, 1.93) | 1.61 (1.38, 1.89) | 1.38 (1.17, 1.62) | 1.25 (1.05, 1.48) | 1.00 (Ref) | 1.12 (1.08, 1.16) | <0.0001 |
| MVb + Current BMIe | 1.48 (1.24, 1.75) | 1.49 (1.27, 1.75) | 1.31 (1.11, 1.54) | 1.22 (1.03, 1.45) | 1.00 (Ref) | 1.09 (1.06, 1.13) | <0.0001 |
| MVb + BMI at age 18 | 1.38 (1.15, 1.65) | 1.41 (1.19, 1.67) | 1.26 (1.07, 1.49) | 1.19 (1.00, 1.41) | 1.00 (Ref) | 1.07 (1.03, 1.11) | 0.0002 |
| AGES 10–20 YEARS | |||||||
| No. of cases | 110 | 768 | 935 | 590 | 238 | ||
| Person-years | 33,311 | 253,995 | 348,090 | 233,982 | 129,004 | ||
| Age-adjusted | 1.64 (1.31, 2.06) | 1.63 (1.41, 1.88) | 1.49 (1.29, 1.72) | 1.37 (1.18, 1.60) | 1.00 (Ref) | 1.14 (1.10, 1.18) | <0.0001 |
| MVb –adjusted | 1.64 (1.30, 2.06) | 1.63 (1.40, 1.89) | 1.49 (1.29, 1.72) | 1.38 (1.19, 1.61) | 1.00 (Ref) | 1.14 (1.09, 1.18) | <0.0001 |
| MVb without physical activityc | 1.62 (1.29, 2.03) | 1.60 (1.38, 1.86) | 1.48 (1.28, 1.70) | 1.38 (1.18, 1.60) | 1.00 (Ref) | 1.13 (1.09, 1.17) | <0.0001 |
| MVb + Menstrual characteristicsd | 1.74 (1.38, 2.19) | 1.70 (1.47, 1.98) | 1.53 (1.32, 1.77) | 1.40 (1.20, 1.62) | 1.00 (Ref) | 1.15 (1.11, 1.20) | <0.0001 |
| MVb + current BMIe | 1.56 (1.23, 1.97) | 1.56 (1.33, 1.82) | 1.44 (1.24, 1.67) | 1.36 (1.17, 1.58) | 1.00 (Ref) | 1.12 (1.08, 1.17) | <0.0001 |
| Body size (level)a | Per 1-unit decrease in body size | p-trendf | |||||
|---|---|---|---|---|---|---|---|
| 1 | 2 | 3 | 4 | 5+ | |||
| Hazard Ratio (95% Confidence Interval) | |||||||
|
|
|||||||
| AGE 20 YEARS | |||||||
| No. of cases | 135 | 778 | 996 | 526 | 206 | ||
| Person-years | 42,612 | 258,124 | 378,017 | 210,564 | 109,065 | ||
| Age-adjusted | 1.53 (1.23, 1.90) | 1.55 (1.33, 1.81) | 1.39 (1.20, 1.62) | 1.32 (1.12, 1.55) | 1.00 (Ref) | 1.10 (1.07, 1.14) | <0.0001 |
| MVb –adjusted | 1.54 (1.23, 1.91) | 1.56 (1.34, 1.82) | 1.40 (1.21, 1.64) | 1.33 (1.13, 1.57) | 1.00 (Ref) | 1.10 (1.07, 1.14) | <0.0001 |
| MVb without physical activityc | 1.52 (1.22, 1.89) | 1.54 (1.32, 1.80) | 1.39 (1.19, 1.62) | 1.33 (1.13, 1.56) | 1.00 (Ref) | 1.10 (1.06, 1.14) | <0.0001 |
| MVb + Menstrual characteristicsd | 1.61 (1.29, 2.00) | 1.61 (1.38, 1.88) | 1.43 (1.23, 1.66) | 1.34 (1.14, 1.58) | 1.00 (Ref) | 1.11 (1.08, 1.16) | <0.0001 |
| MVb + current BMIe | 1.44 (1.15, 1.81) | 1.47 (1.25, 1.74) | 1.34 (1.15, 1.57) | 1.30 (1.10, 1.53) | 1.00 (Ref) | 1.09 (1.05, 1.13) | <0.0001 |
Participants recalled their body size at ages 5, 10, and 20 years using a 9-level pictogram (level 1: most lean; level 9: most overweight). Higher levels (4.5+ or 5+) were collapsed because there were fewer women in those levels.
Multivariate (MV)-adjusted model includes age (years, continuous), average alcohol intake between ages 15–18 years (g/day, continuous), average physical activity between ages 12–17 years (MET-hr/wk, continuous), birthweight (<5.5/5.5–6.9/7–8.4/8.5+), height (inches, continuous), parity/age at first birth (nulliparous/1–2 at < 25 years/1–2 at 25–29 years/1–2 at 30+ years/3+ at <25 years/3+ at 25+ years), ever oral contraceptive use (never/past/current), smoking status (never/past with adolescent smoking/past with no adolescent smoking/current with adolescent smoking/current with no adolescent smoking), adult alcohol intake (g/d, continuous), family history of breast cancer (yes/no), personal history of benign breast disease (yes/no), adult physical activity (MET-hr/wk, continuous), menopausal status/postmenopausal hormone use (premenopausal/postmenopausal never user/postmenopausal past user/postmenopausal current user/dubious), and age at menopause (year, continuous).
Adolescent physical activity (average MET-hr/wk at ages 12–17 years, continuous) and adult physical activity (MET-hr/wk, continuous).
Menstrual characteristics includes age at menarche (<12/12/13/14/15+ years), menstrual pattern at ages 18–22 years (regular/irregular or no periods), time to menstrual regularity since menarche (<1/1–4/5+ years or never).
Current adult BMI (kg/m2, continuous)
p-trend was estimated using a Wald test for a continuous variable of body size (level 1–9).
Within each stratum of adolescent activity, early-life body leanness was significantly associated with higher breast cancer risk (Table 3). Multivariate-adjusted HR for women who were lean (level 1–2 vs. 4.5+) during their childhood were 1.66 (95% CI=1.29–2.12) among inactive women, 1.59 (95% CI=1.22–2.08) among moderately active women, and 1.37 (95% CI=1.04–1.81) among active women. Similar patterns were observed for each time comparison of body size and physical activity, with slightly attenuated positive associations for body leanness among women who engaged in higher levels of activity during adolescence. However, the interactions were not statistically significant.
Table 3.
Hazard ratios of breast cancer according to self-reported body size, stratified by adolescent physical activity (average between ages 12–17 years) in the Nurses’ Health Study II, 1997–2011
| Average body size (level)a | Per 1-unit decrease in body size | |||||
|---|---|---|---|---|---|---|
| 1–2 | 2.5–3 | 3.5–4 | 4.5+ | |||
| Multivariate hazard ratio (95% confidence interval)b | ||||||
|
|
||||||
| Stratified by ‘future’ physical activity: | ||||||
| Average childhood body size (ages 5–10 years) and average adolescent physical activity (ages 12–17 years) | ||||||
| All women | Cases HR 95% CI |
1,398 1.55 (1.33, 1.81) |
643 1.35 (1.15, 1.58) |
404 1.24 (1.04, 1.47) |
196 1.00 (Ref) |
1.11 (1.07, 1.14) |
| Inactive women: <30 MET-hr/wk | Cases HR 95% CI |
431 1.66 (1.29, 2.12) |
216 1.45 (1.11, 1.89) |
145 1.22 (0.92, 1.62) |
76 1.00 (Ref) |
1.12 (1.06, 1.19) |
| Moderately active women: 30–59.9 MET-hr/wk | Cases HR 95% CI |
479 1.59 (1.22, 2.08) |
229 1.40 (1.06, 1.86) |
149 1.34 (1.00, 1.81) |
63 1.00 (Ref) |
1.11 (1.05, 1.18) |
| Active women: 60+ MET-hr/wk | Cases HR 95% CI |
488 1.37 (1.04, 1.81) |
198 1.18 (0.88, 1.59) |
110 1.09 (0.79, 1.51) |
57 1.00 (Ref) |
1.08 (1.02, 1.15) |
| p-interactionc = 0.72 | ||||||
| Stratified by ‘concurrent’ physical activity: | ||||||
| Average adolescent body size (ages 10–20 years) and average adolescent physical activity (ages 12–17 years) | ||||||
| All women | Cases HR 95% CI |
878 1.63 (1.41, 1.88) |
935 1.49 (1.29, 1.72) |
590 1.38 (1.19, 1.61) |
238 1.00 (Ref) |
1.14 (1.09, 1.18) |
| Inactive women: <30 MET-hr/wk | Cases HR 95% CI |
264 1.74 (1.37, 2.21) |
294 1.67 (1.32, 2.11) |
215 1.52 (1.19, 1.94) |
95 1.00 (Ref) |
1.16 (1.09, 1.23) |
| Moderately active women: 30–59.9 MET-hr/wk | Cases HR 95% CI |
314 1.59 (1.24, 2.04) |
323 1.40 (1.09, 1.79) |
202 1.26 (0.97, 1.63) |
81 1.00 (Ref) |
1.14 (1.07, 1.21) |
| Active women: 60+ MET-hr/wk | Cases HR 95% CI |
300 1.52 (1.15, 2.00) |
318 1.41 (1.07, 1.86) |
173 1.38 (1.03, 1.85) |
62 1.00 (Ref) |
1.11 (1.03, 1.18) |
| p-interactionc = 0.72 | ||||||
| Body size (level)a | Per 1-unit decrease in body size | |||||
|---|---|---|---|---|---|---|
| 1–2 | 3 | 4 | 5+ | |||
| Multivariate hazard ratio (95% confidence interval)b | ||||||
|
|
||||||
| Stratified by ‘prior’ physical activity: | ||||||
| Body size at age 20 years and average adolescent physical activity (ages 12–17 years) | ||||||
| All women | Cases HR 95% CI |
913 1.56 (1.34, 1.82) |
996 1.40 (1.21, 1.64) |
526 1.33 (1.13, 1.57) |
206 1.00 (Ref) |
1.10 (1.07, 1.14) |
| Inactive women: <30 MET-hr/wk | Cases HR 95% CI |
271 1.73 (1.33, 2.25) |
330 1.72 (1.33, 2.22) |
193 1.52 (1.16, 1.99) |
74 1.00 (Ref) |
1.12 (1.06, 1.19) |
| Moderately active women: 30–59.9 MET-hr/wk | Cases HR 95% CI |
331 1.39 (1.08, 1.79) |
337 1.17 (0.91, 1.51) |
176 1.11 (0.85, 1.46) |
76 1.00 (Ref) |
1.10 (1.04, 1.17) |
| Active women: 60+ MET-hr/wk | Cases HR 95% CI |
311 1.48 (1.11, 1.98) |
329 1.32 (0.99, 1.76) |
157 1.37 (1.00, 1.86) |
56 1.00 (Ref) |
1.08 (1.01, 1.15) |
| p-interactionc = 0.64 | ||||||
Participants recalled their body size at ages 5, 10, and 20 years using a 9-level pictogram (level 1: most lean; level 9: most overweight). Higher levels (4.5+ or 5+) were collapsed because there were fewer women in those levels.
Adjusted for age (years, continuous), average alcohol intake between ages 15–18 years (g/day, continuous), average physical activity between ages 12–17 years (MET-hr/wk, continuous), birthweight (<5.5/5.5–6.9/7–8.4/8.5+), height (inches, continuous), parity/age at first birth (nulliparous/1–2 at < 25 years/1–2 at 25–29 years/1–2 at 30+ years/3+ at <25 years/3+ at 25+ years), ever oral contraceptive use (never/past/current), smoking status (never/past with adolescent smoking/past with no adolescent smoking/current with adolescent smoking/current with no adolescent smoking), adult alcohol intake (g/d, continuous), family history of breast cancer (yes/no), personal history of benign breast disease (yes/no), adult physical activity (MET-hr/wk, continuous), menopausal status/postmenopausal hormone use (premenopausal/postmenopausal never user/postmenopausal past user/postmenopausal current user/dubious), and age at menopause (year, continuous).
p-interaction was estimated using a likelihood ratio test comparing models with and without a interaction term (between a continuous body size level 1–9 and a continuous physical activity MET-hr/wk)
When we cross-classified body size and physical activity, the risk in women who were lean and active in early-life was only suggestively lower compared to women who were lean and inactive (future activity: HR=1.55, 95% CI=1.15–2.09 vs. HR=1.66, 95% CI=1.30–2.13; concurrent activity: HR=1.61, 95% CI=1.21–2.15 vs. HR=1.72, 95% CI=1.36–2.17; prior activity: HR=1.69, 95% CI=1.24–2.30 vs. HR=1.73, 95% CI=1.34–2.25) and their confidence intervals overlapped considerably (Figure 2). The results did not differ by ER status of tumors (p-heterogeneityfuture activity=0.47, p-heterogeneityconcurrent activity=0.40, p-heterogeneityprior activity=0.58) and were consistent when we restricted the analyses to premenopausal women or using activity (tertile/quintile) at ages 14–17 years only.
Figure 2.

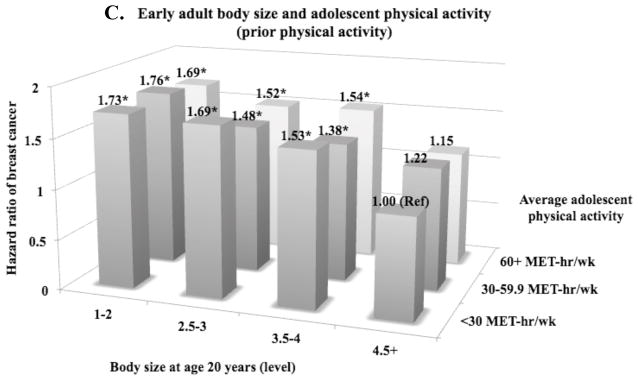
Hazard ratiosa of breast cancer according to self-reported adolescent physical activity (average between ages 12–17 years) and body sizeb at three different age periods (ages 5–10, 10–20, and 20 years) in the Nurses’ Health Study II, 1997–2011 (reference = body size 4.5+ or 5+ level, physical activity <30 MET-hr/wk)
*Statistically significant (p<0.05)
aAdjusted for age (years, continuous), average alcohol intake between ages 15–18 years (g/day, continuous), average physical activity between ages 12–17 years (MET-hr/wk, continuous), birthweight (<5.5/5.5–6.9/7–8.4/8.5+), height (inches, continuous), parity/age at first birth (nulliparous/1–2 at < 25 years/1–2 at 25–29 years/1–2 at 30+ years/3+ at <25 years/3+ at 25+ years), ever oral contraceptive use (never/past/current), smoking status (never/past with adolescent smoking/past with no adolescent smoking/current with adolescent smoking/current with no adolescent smoking), adult alcohol intake (g/d, continuous), family history of breast cancer (yes/no), personal history of benign breast disease (yes/no), adult physical activity (MET-hr/wk, continuous), menopausal status/postmenopausal hormone use (premenopausal/postmenopausal never user/postmenopausal past user/postmenopausal current user/dubious), and age at menopause (year, continuous).
bParticipants recalled their body size at ages 5, 10, and 20 years using a 9-level pictogram (level 1: most lean; level 9: most overweight). Higher levels (4.5+ or 5+) were collapsed because there were fewer women in those levels.
DISCUSSION
In this large prospective study, body leanness during childhood to early adulthood was associated with a significantly higher breast cancer risk, regardless of the level of adolescent physical activity. The association was independent of early-life and adult risk factors for breast cancer and adult BMI. Although the associations were slightly attenuated among women who were active compared to those who were inactive, adolescent physical activity did not significantly modify the association. The results did not vary by ER status of tumors.
Our findings of a positive association between early-life body leanness and breast cancer risk are consistent with those from previous studies 1–4, 8, 9, 11 in which lean girls had a 10–70% increased risk compared with overweight girls. The magnitude of the association may vary among studies due to variations in the range of BMI, sample size, length of follow-up, and population characteristics (e.g., ethnicity, age). For example, in our study of primarily Caucasian women, the corresponding median BMI at age 18 (the most proximate age available, r=0.69) for women in the lowest and highest somatotype groups at age 20 were 18 and 26 kg/m2, respectively. In a Danish study (3,340 cases), a more narrow contrast of BMI at age 14 (median 16 vs. 22 kg/m2) was associated with a 20% higher risk 8. Another study in African American women (1,062 cases) reported a 32–47% higher risk in women with BMI <20 vs. ≥25 kg/m2 at age 18 2. Most studies, including ours, did not include women who were extremely lean (such as those in the settings of extreme caloric restriction) during early life; little is known about the relationship in extremely lean girls although some studies observed reduced risk in women who experienced severe famine 35 or anorexia nervosa 36 during adolescence.
While the biology underlying the association between early-life body size and breast cancer risk is not clear, multiple mechanisms, including both estrogen and non-estrogen pathways, are likely to be involved as the association is significant for both ER+ and ER− tumors 4. First, overweight girls are more likely to experience irregular menstrual cycles 23 and anovulation 13, 14, despite having earlier menarche 23. However, these factors are unlikely to explain the strong association of early-life body size because adjustment for menstrual pattern between ages 14–22 years did not alter our results. Second, although biomarker studies have generally not observed an association between childhood body size and the levels of adolescent 37 and adult 16 endogenous sex hormones, we cannot exclude the possibility that the breast tissue-specific response to sex hormones (e.g., estrogen sensitivity) may vary by early-life body size. Third, early-life body leanness may contribute to a lifelong set point of IGF-1. In the NHS and NHSII, we observed 14% higher adult levels of plasma IGF-1 among women who were lean (vs. overweight) at young ages 15, and adult IGF-1 levels have been associated with a higher risk of breast cancer 38. However, genetically-determined IGF-1 levels do not seem to play a major role because no association was observed between childhood body size and SNPs in the IGF-1 and IGFBP-1/-3 gene regions 39. Lastly, early-life body size has been inversely associated with mammographic density 17, 18 and the risk of benign breast disease 40, 41. Given the strong association between mammographic density and breast cancer, breast density may play a role in the association between early-life body size and breast cancer risk; however, adjustment for mammographic density did not substantially alter the association in our prior results 42. Evidence from mathematical models 43 and epidemiological studies 44 supports that breast tissues are particularly susceptible to carcinogens during early life, especially between menarche and the first childbirth 45. For instance, overweight girls may have earlier differentiation and altered development of breast tissue structures 46 that decreases susceptibility to breast cancer throughout their lives; differentiated cells become less likely to proliferate or transform into tumor cells 43, 45.
A lack of significant interaction in our study suggests that the modest association of adolescent physical activity with breast cancer risk may not be strong enough to counteract the robust association of early-life body size. While early-life physical activity and body size share several potential mechanisms, it is possible that early-life body size acts upon breast carcinogenesis in a way that is not modifiable by physical activity. For example, early-life body size is inversely associated with mammographic density 17, 18 while physical activity is not 47. If early-life body leanness increases risk primarily through higher breast density, engaging in high levels of activity during early life may not modify the association between early-life body size and breast cancer risk. However, we observed a slightly attenuated association of early-life body size among women who were physically active during adolescence. Our results contrast with those from the only prior study to date, which has suggested a significantly stronger association of BMI at age 18 among postmenopausal women who engaged in higher levels of activity at ages 14–22 year 27. Possible recall bias in their retrospective study may explain the contrast, as suggested by their stronger inverse association of adolescent physical activity (≥364 vs. 0 times/year: OR=0.55, 95% CI=0.39–0.78) and weaker positive association of early-life body leanness (BMI <18.6 vs. >21.8 kg/m2: OR=1.09, 95% CI=0.97–1.22) compared to ours.
Given some limitations of our study, we cannot exclude the possibility of some interaction between early-life body size and physical activity. Because participants recalled their early-life body size and adolescent physical activity when they were ages 25–50 years, our exposure data are inevitably imperfect. Physical activity is particularly difficult to measure accurately using questionnaires as there are many components including intensity, frequency, and timing that may be differentially related to breast cancer risk. Our physical activity data also did not include non-recreational activity such as household and occupational activities. Given we focused on adolescence, levels of these activities were likely minimal in our study population; however, failure to meet this assumption would result in measurement error in physical activity data. In our analysis where participants recalled body size and physical activity prior to breast cancer diagnosis, the resulting measurement error is most likely independent of outcome (i.e., non-differential) and may have attenuated the association and interaction. For early-life body size, the association was similar in other studies that used measured BMI 8, 9 supporting the validity of our recalled body size data. Despite these limitations, this study included a long follow-up and adjustment for both early-life and adult risk factors for breast cancer.
In summary, while early-life body leanness was significantly associated with a higher risk of breast cancer, adolescent physical activity did not significantly modify the association, although some interaction cannot be excluded. Further study is required to elucidate the mechanisms underlying this association and to identify strategies to mitigate the excess risk of breast cancer in lean girls. Despite the higher risk of breast cancer observed among lean girls, lifetime obesity and physical inactivity increase the risk of other types of cancer and various other chronic diseases (e.g., cardiovascular, endocrine, pulmonary, renal, gastrointestinal, musculoskeletal) 48. Further, adult body fatness increases postmenopausal breast cancer risk, and girls who are overweight are likely to remain overweight as adults 49. Therefore, public health recommendations should still support early life maintenance of a healthy weight and physical activity.
Novelty and impact of the work.
Early-life body size is inversely associated with both premenopausal and postmenopausal breast cancer risk, suggesting an excess risk in lean girls. In our prospective analysis with a large sample size, we observed lean girls were at higher risk, regardless of the level of adolescent physical activity. However, the association was slightly, though not significantly, attenuated among the most active girls.
Acknowledgments
We would like to thank the participants and staff of the Nurses’ Health Study II for their valuable contributions as well as the following state cancer registries for their help: AL, AZ, AR, CA, CO, CT, DE, FL, GA, ID, IL, IN, IA, KY, LA, ME, MD, MA, MI, NE, NH, NJ, NY, NC, ND, OH, OK, OR, PA, RI, SC, TN, TX, VA, WA, WY. The authors assume full responsibility for analyses and interpretation of these data.
FUNDING
This work was supported by the Breast Cancer Research Foundation and the National Institutes of Health (UM1 CA176726, CA050385, T32 CA09001 to H.O. and C.E.B.).
References
- 1.Suzuki R, Iwasaki M, Inoue M, Sasazuki S, Sawada N, Yamaji T, Shimazu T, Tsugane S Japan Public Health Center-based Prospective Study G. Body weight at age 20 years, subsequent weight change and breast cancer risk defined by estrogen and progesterone receptor status--the Japan public health center-based prospective study. International journal of cancer Journal international du cancer. 2011;129:1214–24. doi: 10.1002/ijc.25744. [DOI] [PubMed] [Google Scholar]
- 2.Palmer JR, Adams-Campbell LL, Boggs DA, Wise LA, Rosenberg L. A prospective study of body size and breast cancer in black women. Cancer epidemiology, biomarkers & prevention : a publication of the American Association for Cancer Research, cosponsored by the American Society of Preventive Oncology. 2007;16:1795–802. doi: 10.1158/1055-9965.EPI-07-0336. [DOI] [PubMed] [Google Scholar]
- 3.Weiderpass E, Braaten T, Magnusson C, Kumle M, Vainio H, Lund E, Adami HO. A prospective study of body size in different periods of life and risk of premenopausal breast cancer. Cancer epidemiology, biomarkers & prevention : a publication of the American Association for Cancer Research, cosponsored by the American Society of Preventive Oncology. 2004;13:1121–7. [PubMed] [Google Scholar]
- 4.Baer HJ, Tworoger SS, Hankinson SE, Willett WC. Body fatness at young ages and risk of breast cancer throughout life. American journal of epidemiology. 2010;171:1183–94. doi: 10.1093/aje/kwq045. [DOI] [PMC free article] [PubMed] [Google Scholar]
- 5.Fagherazzi G, Guillas G, Boutron-Ruault MC, Clavel-Chapelon F, Mesrine S. Body shape throughout life and the risk for breast cancer at adulthood in the French E3N cohort. European journal of cancer prevention : the official journal of the European Cancer Prevention Organisation. 2013;22:29–37. doi: 10.1097/CEJ.0b013e328355ec04. [DOI] [PubMed] [Google Scholar]
- 6.van den Brandt PA, Dirx MJ, Ronckers CM, van den Hoogen P, Goldbohm RA. Height, weight weight change, and postmenopausal breast cancer risk: The Netherlands Cohort Study. Cancer causes & control : CCC. 1997;8:39–47. doi: 10.1023/a:1018479020716. [DOI] [PubMed] [Google Scholar]
- 7.Kawai M, Minami Y, Kuriyama S, Kakizaki M, Kakugawa Y, Nishino Y, Ishida T, Fukao A, Tsuji I, Ohuchi N. Adiposity, adult weight change and breast cancer risk in postmenopausal Japanese women: the Miyagi Cohort Study. British journal of cancer. 2010;103:1443–7. doi: 10.1038/sj.bjc.6605885. [DOI] [PMC free article] [PubMed] [Google Scholar]
- 8.Ahlgren M, Melbye M, Wohlfahrt J, Sorensen TI. Growth patterns and the risk of breast cancer in women. The New England journal of medicine. 2004;351:1619–26. doi: 10.1056/NEJMoa040576. [DOI] [PubMed] [Google Scholar]
- 9.Hilakivi-Clarke L, Forsen T, Eriksson JG, Luoto R, Tuomilehto J, Osmond C, Barker DJ. Tallness and overweight during childhood have opposing effects on breast cancer risk. British journal of cancer. 2001;85:1680–4. doi: 10.1054/bjoc.2001.2109. [DOI] [PMC free article] [PubMed] [Google Scholar]
- 10.Bandera EV, Chandran U, Zirpoli G, Ciupak G, Bovbjerg DH, Jandorf L, Pawlish K, Freudenheim JL, Ambrosone CB. Body size in early life and breast cancer risk in African American and European American women. Cancer causes & control : CCC. 2013;24:2231–43. doi: 10.1007/s10552-013-0302-1. [DOI] [PMC free article] [PubMed] [Google Scholar]
- 11.Sangaramoorthy M, Phipps AI, Horn-Ross PL, Koo J, John EM. Early-life factors and breast cancer risk in Hispanic women: the role of adolescent body size. Cancer epidemiology, biomarkers & prevention : a publication of the American Association for Cancer Research, cosponsored by the American Society of Preventive Oncology. 2011;20:2572–82. doi: 10.1158/1055-9965.EPI-11-0848. [DOI] [PMC free article] [PubMed] [Google Scholar]
- 12.van den Brandt PA, Spiegelman D, Yaun SS, Adami HO, Beeson L, Folsom AR, Fraser G, Goldbohm RA, Graham S, Kushi L, Marshall JR, Miller AB, et al. Pooled analysis of prospective cohort studies on height, weight, and breast cancer risk. American journal of epidemiology. 2000;152:514–27. doi: 10.1093/aje/152.6.514. [DOI] [PubMed] [Google Scholar]
- 13.Stoll BA. Teenage obesity in relation to breast cancer risk. International journal of obesity and related metabolic disorders : journal of the International Association for the Study of Obesity. 1998;22:1035–40. doi: 10.1038/sj.ijo.0800769. [DOI] [PubMed] [Google Scholar]
- 14.Rich-Edwards JW, Goldman MB, Willett WC, Hunter DJ, Stampfer MJ, Colditz GA, Manson JE. Adolescent body mass index and infertility caused by ovulatory disorder. Am J Obstet Gynecol. 1994;171:171–7. doi: 10.1016/0002-9378(94)90465-0. [DOI] [PubMed] [Google Scholar]
- 15.Poole EM, Tworoger SS, Hankinson SE, Schernhammer ES, Pollak MN, Baer HJ. Body size in early life and adult levels of insulin-like growth factor 1 and insulin-like growth factor binding protein 3. American journal of epidemiology. 2011;174:642–51. doi: 10.1093/aje/kwr123. [DOI] [PMC free article] [PubMed] [Google Scholar]
- 16.Tworoger SS, Eliassen AH, Missmer SA, Baer H, Rich-Edwards J, Michels KB, Barbieri RL, Dowsett M, Hankinson SE. Birthweight and body size throughout life in relation to sex hormones and prolactin concentrations in premenopausal women. Cancer epidemiology, biomarkers & prevention : a publication of the American Association for Cancer Research, cosponsored by the American Society of Preventive Oncology. 2006;15:2494–501. doi: 10.1158/1055-9965.EPI-06-0671. [DOI] [PubMed] [Google Scholar]
- 17.Samimi G, Colditz GA, Baer HJ, Tamimi RM. Measures of energy balance and mammographic density in the Nurses’ Health Study. Breast cancer research and treatment. 2008;109:113–22. doi: 10.1007/s10549-007-9631-7. [DOI] [PubMed] [Google Scholar]
- 18.Sellers TA, Vachon CM, Pankratz VS, Janney CA, Fredericksen Z, Brandt KR, Huang Y, Couch FJ, Kushi LH, Cerhan JR. Association of childhood and adolescent anthropometric factors, physical activity, and diet with adult mammographic breast density. American journal of epidemiology. 2007;166:456–64. doi: 10.1093/aje/kwm112. [DOI] [PubMed] [Google Scholar]
- 19.Berkey CS, Frazier AL, Gardner JD, Colditz GA. Adolescence and breast carcinoma risk. Cancer. 1999;85:2400–9. doi: 10.1002/(sici)1097-0142(19990601)85:11<2400::aid-cncr15>3.0.co;2-o. [DOI] [PubMed] [Google Scholar]
- 20.Maruti SS, Willett WC, Feskanich D, Rosner B, Colditz GA. A prospective study of age-specific physical activity and premenopausal breast cancer. Journal of the National Cancer Institute. 2008;100:728–37. doi: 10.1093/jnci/djn135. [DOI] [PMC free article] [PubMed] [Google Scholar]
- 21.Boeke CE, Eliassen AH, Oh H, Spiegelman D, Willett WC, Tamimi RM. Adolescent physical activity in relation to breast cancer risk. Breast cancer research and treatment. 2014;145:715–24. doi: 10.1007/s10549-014-2919-5. [DOI] [PMC free article] [PubMed] [Google Scholar]
- 22.Friedenreich CM, Orenstein MR. Physical activity and cancer prevention: etiologic evidence and biological mechanisms. J Nutr. 2002;132:3456S–64S. doi: 10.1093/jn/132.11.3456S. [DOI] [PubMed] [Google Scholar]
- 23.Tehard B, Kaaks R, Clavel-Chapelon F. Body silhouette, menstrual function at adolescence and breast cancer risk in the E3N cohort study. British journal of cancer. 2005;92:2042–8. doi: 10.1038/sj.bjc.6602620. [DOI] [PMC free article] [PubMed] [Google Scholar]
- 24.Frisch RE, Wyshak G, Vincent L. Delayed menarche and amenorrhea in ballet dancers. The New England journal of medicine. 1980;303:17–9. doi: 10.1056/NEJM198007033030105. [DOI] [PubMed] [Google Scholar]
- 25.Frisch RE, Gotz-Welbergen AV, McArthur JW, Albright T, Witschi J, Bullen B, Birnholz J, Reed RB, Hermann H. Delayed menarche and amenorrhea of college athletes in relation to age of onset of training. JAMA : the journal of the American Medical Association. 1981;246:1559–63. [PubMed] [Google Scholar]
- 26.Bernstein L, Ross RK, Lobo RA, Hanisch R, Krailo MD, Henderson BE. The effects of moderate physical activity on menstrual cycle patterns in adolescence: implications for breast cancer prevention. British journal of cancer. 1987;55:681–5. doi: 10.1038/bjc.1987.139. [DOI] [PMC free article] [PubMed] [Google Scholar]
- 27.Shoff SM, Newcomb PA, Trentham-Dietz A, Remington PL, Mittendorf R, Greenberg ER, Willett WC. Early-life physical activity and postmenopausal breast cancer: effect of body size and weight change. Cancer epidemiology, biomarkers & prevention : a publication of the American Association for Cancer Research, cosponsored by the American Society of Preventive Oncology. 2000;9:591–5. [PubMed] [Google Scholar]
- 28.Stunkard AJ, Sorensen T, Schulsinger F. Use of the Danish Adoption Register for the study of obesity and thinness. In: Kety SS, Rowland LP, Sidman SW, Mathysee SW, editors. The genetics of neurological and psychiatric disorders. Raven Press; New York: 1983. pp. 115–20. [PubMed] [Google Scholar]
- 29.Must A, Willett WC, Dietz WH. Remote recall of childhood height, weight, and body build by elderly subjects. American journal of epidemiology. 1993;138:56–64. doi: 10.1093/oxfordjournals.aje.a116777. [DOI] [PubMed] [Google Scholar]
- 30.Wolf AM, Hunter DJ, Colditz GA, Manson JE, Stampfer MJ, Corsano KA, Rosner B, Kriska A, Willett WC. Reproducibility and validity of a self-administered physical activity questionnaire. International journal of epidemiology. 1994;23:991–9. doi: 10.1093/ije/23.5.991. [DOI] [PubMed] [Google Scholar]
- 31.Ainsworth BE, Haskell WL, Leon AS, Jacobs DR, Jr, Montoye HJ, Sallis JF, Paffenbarger RS., Jr Compendium of physical activities: classification of energy costs of human physical activities. Med Sci Sports Exerc. 1993;25:71–80. doi: 10.1249/00005768-199301000-00011. [DOI] [PubMed] [Google Scholar]
- 32.Glynn RJ, Rosner B. Methods to evaluate risks for composite end points and their individual components. J Clin Epidemiol. 2004;57:113–22. doi: 10.1016/j.jclinepi.2003.02.001. [DOI] [PubMed] [Google Scholar]
- 33.Glynn RJ, Rosner B. Comparison of risk factors for the competing risks of coronary heart disease, stroke, and venous thromboembolism. American journal of epidemiology. 2005;162:975–82. doi: 10.1093/aje/kwi309. [DOI] [PubMed] [Google Scholar]
- 34.Lunn M, Mcneil N. Applying Cox Regression to Competing Risks. Biometrics. 1995;51:524–32. [PubMed] [Google Scholar]
- 35.Elias SG, Peeters PH, Grobbee DE, van Noord PA. Breast cancer risk after caloric restriction during the 1944–1945 Dutch famine. Journal of the National Cancer Institute. 2004;96:539–46. doi: 10.1093/jnci/djh087. [DOI] [PubMed] [Google Scholar]
- 36.Michels KB, Ekbom A. Caloric restriction and incidence of breast cancer. JAMA : the journal of the American Medical Association. 2004;291:1226–30. doi: 10.1001/jama.291.10.1226. [DOI] [PubMed] [Google Scholar]
- 37.Baer HJ, Colditz GA, Willett WC, Dorgan JF. Adiposity and sex hormones in girls. Cancer epidemiology, biomarkers & prevention : a publication of the American Association for Cancer Research, cosponsored by the American Society of Preventive Oncology. 2007;16:1880–8. doi: 10.1158/1055-9965.EPI-07-0313. [DOI] [PubMed] [Google Scholar]
- 38.Endogenous H, Key TJ, Appleby PN, Reeves GK, Roddam AW Breast Cancer Collaborative G. Insulin-like growth factor 1 (IGF1), IGF binding protein 3 (IGFBP3), and breast cancer risk: pooled individual data analysis of 17 prospective studies. The lancet oncology. 2010;11:530–42. doi: 10.1016/S1470-2045(10)70095-4. [DOI] [PMC free article] [PubMed] [Google Scholar]
- 39.Poole EM, Tworoger SS, Hankinson SE, Baer HJ. Genetic variability in IGF-1 and IGFBP-3 and body size in early life. BMC public health. 2012;12:659. doi: 10.1186/1471-2458-12-659. [DOI] [PMC free article] [PubMed] [Google Scholar]
- 40.Berkey CS, Willett WC, Frazier AL, Rosner B, Tamimi RM, Colditz GA. Prospective study of growth and development in older girls and risk of benign breast disease in young women. Cancer. 2011;117:1612–20. doi: 10.1002/cncr.25692. [DOI] [PMC free article] [PubMed] [Google Scholar]
- 41.Baer HJ, Schnitt SJ, Connolly JL, Byrne C, Willett WC, Rosner B, Colditz GA. Early life factors and incidence of proliferative benign breast disease. Cancer epidemiology, biomarkers & prevention : a publication of the American Association for Cancer Research, cosponsored by the American Society of Preventive Oncology. 2005;14:2889–97. doi: 10.1158/1055-9965.EPI-05-0525. [DOI] [PubMed] [Google Scholar]
- 42.Harris HR, Tamimi RM, Willett WC, Hankinson SE, Michels KB. Body size across the life course, mammographic density, and risk of breast cancer. American journal of epidemiology. 2011;174:909–18. doi: 10.1093/aje/kwr225. [DOI] [PMC free article] [PubMed] [Google Scholar]
- 43.Colditz GA, Frazier AL. Models of breast cancer show that risk is set by events of early life: prevention efforts must shift focus. Cancer epidemiology, biomarkers & prevention : a publication of the American Association for Cancer Research, cosponsored by the American Society of Preventive Oncology. 1995;4:567–71. [PubMed] [Google Scholar]
- 44.Land CE, Tokunaga M, Koyama K, Soda M, Preston DL, Nishimori I, Tokuoka S. Incidence of female breast cancer among atomic bomb survivors, Hiroshima and Nagasaki, 1950–1990. Radiation research. 2003;160:707–17. doi: 10.1667/rr3082. [DOI] [PubMed] [Google Scholar]
- 45.Trichopoulos D, Adami HO, Ekbom A, Hsieh CC, Lagiou P. Early life events and conditions and breast cancer risk: from epidemiology to etiology. International journal of cancer Journal international du cancer. 2008;122:481–5. doi: 10.1002/ijc.23303. [DOI] [PubMed] [Google Scholar]
- 46.Cabanes A, Wang M, Olivo S, DeAssis S, Gustafsson JA, Khan G, Hilakivi-Clarke L. Prepubertal estradiol and genistein exposures up-regulate BRCA1 mRNA and reduce mammary tumorigenesis. Carcinogenesis. 2004;25:741–8. doi: 10.1093/carcin/bgh065. [DOI] [PubMed] [Google Scholar]
- 47.Yaghjyan L, Colditz GA, Wolin K. Physical activity and mammographic breast density: a systematic review. Breast cancer research and treatment. 2012;135:367–80. doi: 10.1007/s10549-012-2152-z. [DOI] [PMC free article] [PubMed] [Google Scholar]
- 48.Must A, Strauss RS. Risks and consequences of childhood and adolescent obesity. International journal of obesity and related metabolic disorders : journal of the International Association for the Study of Obesity. 1999;23 (Suppl 2):S2–11. doi: 10.1038/sj.ijo.0800852. [DOI] [PubMed] [Google Scholar]
- 49.Serdula MK, Ivery D, Coates RJ, Freedman DS, Williamson DF, Byers T. Do obese children become obese adults? A review of the literature. Preventive medicine. 1993;22:167–77. doi: 10.1006/pmed.1993.1014. [DOI] [PubMed] [Google Scholar]