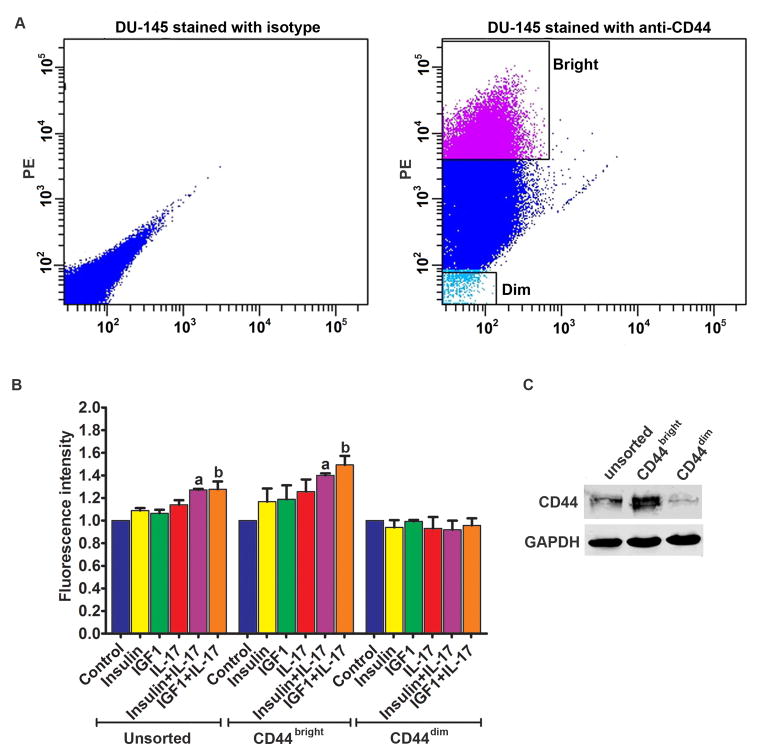
Fig. 4.
Adhesion of the unsorted, CD44bright, and CD44dim DU-145 cells to HUVECs. A: Left panel, flow cytometry analysis of DU-145 cells stained with isotype control IgG; right panel, a representative dot plot shows how CD44bright and CD44dim DU-145 cells were sorted using FACS. B: Quantification of green fluorescence-labelled prostate cancer cells adhered to HUVECs within 15 minutes. HUVECs were treated with IL-17, insulin, and IGF1, alone or in combination, for 24 h prior to addition of prostate cancer cells. Fluorescence intensity was proportional to the number of prostate cancer cells adhered to HUVECs. The fluorescence intensity of the control group was arbitrarily designated as “1”, so the other groups were normalized with a formula: the fluorescence intensity of the treated group = the recorded fluorescence intensity of the treated group ÷ the recorded fluorescence intensity of the control group. Data represent means ± standard deviations of three independent experiments (n = 3). In the unsorted DU-145 cells panel, a indicates P < 0.05 compared to the control, insulin alone and IL-17 alone treatment groups; b indicates P < 0.05 compared to the control, IGF1 alone and IL-17 alone treatment groups. In the CD44bright DU-145 cells panel, a and b indicate P < 0.05 compared to the corresponding single treatment and combined treatment groups within the CD44bright DU-145 cells panel, and between the CD44bright DU-145 cells panel and the unsorted DU-145 cells panel, as well as between the CD44bright DU-145 cells panel and the CD44dim DU-145 cells panel. C: Western blot analysis of CD44 expression in the unsorted, CD44bright, and CD44dim DU-145 cells. Equal loading of proteins was confirmed by re-probing GAPDH.

