

Abstract
Flavor is produced by the integration of taste, olfaction, texture, and temperature, currently thought to occur in the cortex. However, previous work has shown that brainstem taste-related nuclei also respond to multisensory inputs. Here, we test the hypothesis that taste and olfaction interact in the nucleus of the solitary tract (NTS; the first neural relay in the central gustatory pathway) in awake, freely licking rats. Electrophysiological recordings of taste and taste + odor responses were conducted in an experimental chamber following surgical electrode implantation and recovery. Tastants (0.1 m NaCl, 0.1 m sucrose, 0.01 m citric acid, and 0.0001 m quinine) were delivered for five consecutive licks interspersed with five licks of artificial saliva rinse delivered on a VR5 schedule. Odorants were n-amyl acetate (banana), acetic acid (vinegar), octanoic acid (rancid), and phenylethyl alcohol (floral). For each cell, metric space analyses were used to quantify the information conveyed by spike count, by the rate envelope, and by individual spike timing. Results revealed diverse effects of odorants on taste-response magnitude and latency across cells. Importantly, NTS cells were more competent at discriminating taste + odor stimuli versus tastants presented alone for all taste qualities using both rate and temporal coding. The strong interaction of odorants and tastants at the NTS underscores its role as the initial node in the neural circuit that controls food identification and ingestion.
Keywords: electrophysiology, neural coding, olfaction, rat, taste, temporal coding
Introduction
Identifying substances that are nutritious or poisonous is essential for survival. Flavor, a multimodal integration of taste, olfaction, texture, and temperature, is a key component of this process. Each of the modalities that contribute to the construction of flavor is mediated through separate neural systems that are thought to converge in the cortex (Small and Green, 2012). However, there is evidence that multimodal convergence of some of the components of flavor is evident at a much lower level of processing. For example, it has been shown that variation of temperature can affect taste responses in the nucleus of the solitary tract (NTS; the first neural relay in the central gustatory pathway; Ogawa et al., 1988; Wilson and Lemon, 2013). Moreover, electrical stimulation of the trigeminal nerve can modulate taste response in the NTS (Boucher et al., 2003). In fact, a majority (60–70%) of taste-responsive cells in the NTS also respond to tactile input (Ogawa et al., 1984; Travers and Norgren, 1995).
Evidence of taste-olfactory convergence in the brainstem has also been reported. Van Buskirk and Erickson (1977) showed that 22 of 35 (63%) taste-responsive neurons in the NTS also respond to odorants in an odorant-specific manner. They suggested that the origin of the olfactory responses in NTS might be the ethmoid branch of the trigeminal nerve, though cutting the ethmoid nerve did not eliminate all olfactory responses. Similar taste-olfactory convergence was also described in the parabrachial nucleus of the pons (PbN; Di Lorenzo and Garcia, 1985), the second relay in the gustatory pathway and a major target of NTS taste-related projections. Whereas the subjects of Van Buskirk and Erickson (1977) were anesthetized, the subjects of Di Lorenzo and Garcia (1985) were unanesthetized. In the latter study, anesthetization with sodium pentobarbital during recording eliminated the responses to vanilla and almond odors but left the responses to ethanol odor, a potent trigeminal stimulant, and taste responses intact. Collectively, these data suggest the existence of a top-down source for the olfactory responses in the brainstem, perhaps in addition to trigeminal input from the nose.
Although it is clear that olfactory stimuli can evoke responses in taste cells in the brainstem, it is unclear how simultaneous (food-like) taste + odor stimuli would be processed. Here, we detailed the influence of olfactory stimuli on taste responses in the NTS of unanesthetized freely licking rats. Results provide evidence of widespread modulation of odorants on taste-response magnitude and latency when tastants are presented in tandem with odorants. These observations suggest that information about flavor may be present in brainstem circuits that control food identification and ingestion.
Materials and Methods
Subjects.
Male Sprague Dawley rats (n = 14, 300–350 g at the time of surgery) obtained from Taconic Laboratories were used as subjects. Rats were pair housed and maintained on a 12 h light/dark cycle (lights off at 1500 h). Testing occurred during the first 6 h of the dark period. Rats were provided with standard lab chow ad libitum and given at least 1 h of access to water daily. Animal care and procedures were approved by the Institutional Animal Care and Use Committee of Binghamton University.
Surgery.
Rats were anesthetized with a mixture of ketamine (100 mg/kg, i.p.) and xylazine (14 mg/kg, i.p.) and secured in a stereotaxic instrument (David Kopf Instruments) with the head angled downward at 30°. Internal body temperature was monitored and maintained at 37°F using a rectal thermometer connected to a heating pad. The rat's head was shaved and disinfected by alternately scrubbing with iodine and 95% ethanol three times. A longitudinal incision was made in the scalp and the fascia was retracted. A hole was drilled above the NTS. An 8-wire tungsten microwire electrode bundle was then surgically implanted in the NTS with the following coordinates relative to bregma: AP: −15.3 mm; ML: +1.75 mm; DV: ∼−6.00 mm. A total of six screws embedded in the skull (three on each side of the midline) were used as anchors to secure the dental cement and the electrode head cap. Following surgery, rats were given buprenorphine HCl (0.05 mg, s.c.), gentamicin (0.05 mg, s.c.), and 3 ml of Ringer's solution subcutaneously immediately after surgery. In addition, topical antibiotic was applied along the incision and around the head cap. This postoperative treatment was repeated 24 and 48 h after surgery. Weight and general wellbeing of the rats were monitored throughout the experiment; testing began 7 d after surgery.
Microwire electrode assembly.
Neural activity was recorded using an 8-wire electrode bundle. This assembly consisted of a 10-pin connector (Omnetics) with Formvar insulated tungsten wires (25 μm diameter; 1–3 MΩ impedance) soldered to the first eight pins. A stainless steel wire serving as ground was soldered to the ninth pin and a bare tungsten strut (127 μm diameter; 10 mm) was soldered to the tenth pin. The wires were then collected into a bundle, passed through a polyimide tube, and trimmed so that they were staggered across 1 mm and extended 1–2 mm past the strut. The whole assembly was then coated with liquid plastic insulation (Insulating Coating; GC Electronics) to secure the wires to the connector. The microwire ends were dipped into a warmed, liquefied sucrose-gelatin mixture and left to dry overnight. Finished electrode bundles were stored in the refrigerator until they were used for implantation.
Taste and olfactory stimuli.
Taste stimuli were chosen as representatives of basic taste qualities: NaCl (N) for salty, citric acid (A) for sour, sucrose (S) for sweet, and quinine HCl (Q) for bitter. Concentrations were chosen to allow comparison with previous work (Stapleton et al., 2006; Roussin et al., 2012; Weiss et al., 2014). Artificial saliva (AS) rather than water was used as a rinse between taste stimulus presentations because previous studies have found that water often produces responses in the NTS of awake rats (Roussin et al., 2012). AS consisted of a mixture of 0.015 m NaCl, 0.022 m KCl, 0.003 m CaCl2, and 0.0006 m MgCl2 at a pH of 5.8 ± 0.2 (Hirata et al., 2005).
Olfactory stimuli included four odorants. The first two, here called “trigeminal odorants,” have been shown to elicit trigeminal responses as well as olfactory ones at higher concentrations than used here when presented orthonasally (Laska et al., 1997). These were n-amyl acetate (banana odor; B) and acetic acid (vinegar odor; V). The second two odorants, here called “pure” odorants, do not stimulate the trigeminal nerve. These were octanoic acid (slightly rancid odor, R) and phenylethyl alcohol (floral odor, F). Each odor (36.1 μl n-amyl acetate, 3.9 μl acetic acid, 6870.9 μl octanoic acid, and 1552.9 μl phenylethyl alcohol) was diluted in 50 μl of mineral oil and left to equilibrate for 24 h. All odorants were delivered at 1 Pa vapor-phase concentration. Using the same approximate vapor partial pressure (1 Pa) ensures that the odorants presented were of similar intensities (Yue et al., 2004).
We tested trigeminal odorants and pure odorants in separate groups of rats since it was not possible to test all four odorants and their taste + odor combinations in the same session without the rat becoming satiated and losing motivation to lick. In each session, we recorded responses to AS, each tastant alone (four stimuli), each odorant alone (both trigeminal or both pure odorants), and all eight taste + odor pairings (15 stimuli), in randomized order. The number of trials for each stimulus varied from 8 to 13 depending on the particular rat and day.
Stimulus delivery and behavioral testing.
To test for taste and/or olfactory responses, rats were placed in an experimental chamber containing a lick spout for taste stimulus delivery and an odor port for olfactory stimulus delivery. The Plexiglas testing box was housed in a soundproof chamber with an observation window (Med Associates). The taste stimulus delivery system consisted of 12 20 gauge stainless steel tubes, only 5 of which were used in the present experiment. A 16-into-1 mini-manifold AutoMate perfusion system (AutoMate Scientific) housed the taste stimulus reservoirs that were maintained under 10 psi pressure. Computer-activated solenoids (Parker Hannifin) delivered 12 μl of fluid within 10 ms after the rat broke an infrared beam close to the sipper tube in the licking recess. The stimulus delivery system was calibrated daily before the rats were tested. Tastants were delivered for five consecutive licks interspersed with five licks of AS rinse delivered on a variable ratio 5 (VR5) schedule (Fig. 1). On average, that meant that the interstimulus interval was ∼4 s, given an average lick rate of 7 per second. However, the rat was free to lick, or not, at its own pace so there was variability in this interval, especially toward the end of the session when the rat was less motivated to drink.
Figure 1.

Diagram of the stimulus delivery paradigm. Tastants are presented for five consecutive licks followed by five artificial saliva rinse licks delivered on a VR5 schedule. Each lick is symbolized by a vertical line: licks that result in taste stimulus delivery are red and green, artificial saliva rinse licks are blue, and dry licks are gray. Odor presentation is shown below. Either an odorant or clean air is flowing out of the odor port at all times.
The odor stimulus delivery, which also used the AutoMate Perfusion system, consisted of five separate Tygon tubes (four designated for odorants and one for room air) connected to a smaller manifold that terminated into a 5 mm port, The odor port was located 2 cm from the lick spout oriented at a right angle so that the air flow was directed at the lick spout. Odorants were delivered for 3 s or five licks, whichever was shorter. Licks were reinforced with AS during odorant-only presentations. Air continuously flowed through the odor port when odorants were not actively presented. An external fan was mounted on the side of the testing chamber opposite to the taste/odor ports to clear the odor from the box. When tastants and odorants were paired, odorants were presented during the five-lick tastant presentation or for 3 s, whichever ended first. Stimulus presentations were randomized using MedPC software (Med Associates).
Each testing session lasted for ∼1–1.5 h after which the animal was given access to water for 1 h in its home cage.
Pretraining and testing box.
Pretraining started with a 30 min exposure to the testing box during the first day where rats were allowed to explore the experimental chamber. At the end of the first training day, rats were given access to 1 h of water and then deprived for the next 22.5 h. The next day, rats were returned to the testing chamber where sucrose was available from the lick spout on a VR5 schedule, i.e., sucrose every four to six licks, with dry licks in between. Once they had licked 500 times, the animals were placed back in their home cage and given free access to water for 1 h.
Recording.
SortClient software (Plexon) was used to run the experimental paradigm as well as to record neural activity (waveforms with time stamps). Single units were identified off-line using template matching and principal components analysis with Offline Sorter software (Plexon). Criteria for isolation included at least a 3:1 signal-to-noise ratio and a refractory period of at least 2 ms (Stapleton et al., 2006). Time stamps of individual spikes and the occurrence of licks were recorded with 25 μs resolution.
Data analysis.
Responses to tastants and odorants were conducted using in-house MATLAB software. Analysis methods were identical to those used in previous studies (Roussin et al., 2012; Weiss et al., 2014), and, for convenience, are summarized here. A response was considered present when there was a significant change in firing rate, measured in spikes per second (sps), compared with the baseline firing rate. The latter was defined as the average firing rate across five 100 ms time bins (500 ms) before the first lick of the five-lick stimulus trial. Responses to each stimulus were measured by a sliding window (100 ms, 20 ms increments) after the first stimulus lick until a significant difference from baseline was detected. Significant responses were characterized as activity ≥2.58 SD (99% confidence interval) above (excitatory) or below (inhibitory) the average baseline firing rate, present for at least three consecutive 100 ms bins. Response magnitude was calculated as the difference between the average stimulus-evoked firing rate and the average baseline firing rate. When comparing the modulatory effect of pairing odorants and tastants to taste responses alone, we described an increase (or decrease) in response if the response magnitude of the taste + odor paired stimulus was significantly different from the response to the tastant presented alone as assessed by a paired Student's t test corrected for multiple comparisons. Observations of supra-additive effects (i.e., responses to the taste + odor combination that exceed the arithmetic sum of the responses to the tastant and odorant when presented alone) were determined by adding the response magnitude for the tastant only and odorant only and comparing it to the response of the paired tastant + odorant stimulus. If the response to the paired stimulus (taste + odor) was larger than the sum of the responses to the individual stimuli, then the response was categorized as supra-additive (Stein, 1998). Enhancement of taste responses by odorants was defined as a larger response (≥2 sps) to the paired stimulus compared with the response to the tastant presented alone. Conversely, attenuation was defined as a smaller response (≤2 sps) to the paired stimulus compared with the response to the tastant presented alone. Response latency was defined as the time when the lagging edge of the first significant bin of the response after the initial lick was first observed. In some cases, the same recording channels yielded a taste-responsive cell over multiple days. While it is possible that the same cell remained isolated over multiple days, these were treated as separate cells since they characterize the cellular activity in the NTS for that particular day. There were 11 cells that were recorded from the same channel on consecutive days: four cells from one rat for trigeminal odorants, five cells from one rat, and two cells from another for pure odorants:
Analysis of temporal coding.
The information content of taste, odor, and taste + odor responses was analyzed as described previously (Di Lorenzo and Victor, 2003), using metric space analysis (Victor and Purpura, 1996, 1997; for review, see Victor, 2005). This method quantified the amount of information about taste quality conveyed by spike timing and number of spikes in a neural response. Analyses were performed using MATLAB software and the Spike Train Analysis Toolkit.
In metric space analyses, the distance (dis-similarity) between two spike trains is given by the minimum “cost” required to transform one spike train into the other. This distance is calculated at various levels of temporal precision q (units of 1/s), and is denoted Dspike[q]. The cost to transform one spike train into another is determined by summing the costs associated with a set of elementary transformations: adding a spike (cost = 1), deleting a spike (cost = 1), and moving a spike by an amount of time t (cost = qt). When q is 0, there is no cost for moving a spike in time and the distance, denoted Dcount, is simply the difference in spike count between each response. This corresponds to rate coding. As the degree of temporal precision q becomes greater, moving a spike in time yields a greater distance in the metric space, and thus, the distance is more heavily weighted toward spike timing; moving a spike by 1/q (s) is equivalent to deleting it altogether. We calculated distances for q = 0 (rate coding) and for q ranging from 1 to 512, in half-octave steps.
To estimate the amount of information (H in bits) conveyed by rate or temporal coding, we determined the degree to which pairs of responses to the same stimulus tended to be more similar to each other than pairs of responses to different stimuli, according to the metric Dcount or Dspike[q]. This was accomplished by decoding each spike train, as follows. A spike train was decoded as signaling a particular stimulus S if the average distance in metric space from that spike train to each of the spike trains elicited by S was shorter than the average distance to the group of responses elicited by any another stimulus S′. Information, H, was then calculated from the confusion matrix between the actual stimulus that elicited each response and the stimulus into which it was decoded by the above procedure. In our primary analysis, we calculated information for three sets of responses: the four tastants alone and the four tastants with each of the two olfactory stimuli. Thus, the maximal amount of information, which corresponds to perfect discrimination of all four taste stimuli, is log2(4) = 2.0 bits. We also calculated information for a stimulus set consisting of a tastant with and without two odorants (three stimuli), for which the amount of information corresponding to perfect discrimination is log2(3) = 1.59 bits, and for the 15 tastant-odorant combinations, for which the amount of information corresponding to perfect discrimination is log2(15) = 3.91 bits.
The amount of information at q = 0 is denoted as Hcount, and refers to the amount of information conveyed by spike count alone, i.e., rate coding. The value of q at which H is greatest is denoted qmax, and the maximum value of H at qmax is referred to as Hmax. If Hmax is greater than Hcount, then we conclude that the temporal characteristics of the responses contribute to the amount of information conveyed about stimulus quality. Conversely, if Hmax = Hcount, then spike count carries all of the estimated information about stimulus quality.
Two additional analyses were performed as controls: shuffle (Hshuffle) and exchange (Hexchange). To calculate Hshuffle, metric space analysis was applied to 40 surrogate datasets in which the stimulus labels associated with the spike trains were randomly shuffled. Using this method, responses were only considered to carry a nonzero amount of information if the information from the original dataset was significantly larger than the information from the shuffled datasets (Hcount > Hshuffled + 2 SD or Hmax > Hshuffled + 2 SD), where Hshuffled was calculated from Dspike[qmax]. Second, to distinguish the contribution of individual spike timing from the contribution of the firing rate envelope, metric space analyses were applied to datasets constructed by assigning each recorded spike to a randomly chosen presentation of the same stimulus. This resulted in surrogate datasets that had the same firing rate envelope as the original data, but lacked the temporal structure of its individual spikes. If Hmax > Hexchange + 2 SD (both quantities calculated from Dspike[qmax]), it was concluded that there was a significant contribution from the timing of individual spikes to the cell's ability to discriminate among the stimuli. Calculations included the Treves-Panzeri-Miller-Carlton bias correction for the limited number of samples (for review, see Panzeri et al., 2007). For values of Hcount and Hmax that did not exceed the shuffle correction and were therefore considered nonsignificant, the final value of these quantities was taken to be 0.
All analyses were performed for several response durations: the first 200 ms, 500 ms, 1 s, 1.5 s, and 2 s following the initial “wet” lick.
Histology.
To verify correct electrode placement a cathodal current was passed through the recording electrode (10 s duration, 0.5 mA) to produce a small lesion in the NTS. The rat was then perfused with 0.9% saline and 10% neutral buffered formalin. Brains were extracted and stored in 10% formalin for at least week. Before sectioning, brains were cryoprotected with 30% sucrose in PBS, then sectioned into 30 μm slices and stained using cresyl violet. Representative coronal section through the NTS showing lesions from the 14 rats that exhibited taste-responsive cells is shown in Figure 2. Cells were distributed throughout the mediolateral and dorsoventral extent of the rostral subdivision of the NTS.
Figure 2.

Photomicrograph of a section of the brainstem showing the locations of NTS recordings. Section is located 12.5 mm caudal to bregma.
Results
Electrophysiological responses to tastants presented alone, odorants presented alone, and tastants and odorants presented simultaneously were recorded from 75 NTS cells: 27 cells in seven rats for trigeminal odorants (B and V) and 48 cells in seven rats for pure odorants (F and R). Of 75 cells, 67 (89%) were taste responsive. Of 75 cells, 7 (9%) only responded to tastants when they were paired with odorants (one cell tested with trigeminal odorants and six cells tested with pure odorants). One cell responded to both pure odorants but did not respond to any tastant. Of 75 cells 40 (53%) responded to odorants when presented alone: seven cells responded to both B and V odors, five cells responded only to B odor, four cells responded only to V odor, seven cells responded to both F and R odors, eight responded only to F odor, and nine cells responded only to R odor.
The majority of the taste-responsive cells (58/75; 77%) were broadly tuned, that is, they responded to more than one tastant. Five cells responded only to sucrose and four responded only to quinine. All taste and taste + odor stimuli elicited different responses varying from excitatory, inhibitory, or mixed (excitatory then inhibitory or inhibitory then excitatory) from cells in the NTS. The distribution of these response types across stimuli is shown in Tables 1, 2. For trigeminal odorants (Table 1) VQ elicited the most excitatory responses (63%) while VA produced the fewest inhibitory responses (7%). For pure odorants (Table 2), FS evoked the most excitatory responses (14/48; 29%) while odorant-only presentation of either F or R evoked the fewest inhibitory responses (3/48; 6%).
Table 1.
Number of NTS single units responsive to tastants and/or odorants with trigeminal odorants
| S | BS | VS | N | BN | RN | A | BA | VA | Q | BQ | VQ | B | V | |
|---|---|---|---|---|---|---|---|---|---|---|---|---|---|---|
| Excitatory | 10 | 14 | 12 | 11 | 12 | 9 | 12 | 10 | 12 | 11 | 15 | 17 | 7 | 7 |
| Inhibitory | 5 | 7 | 6 | 5 | 5 | 7 | 3 | 6 | 2 | 5 | 6 | 5 | 4 | 4 |
| Mixed | 6 | 4 | 5 | 5 | 8 | 5 | 6 | 7 | 9 | 7 | 3 | 1 | 1 | 0 |
| Total | 21 | 25 | 23 | 21 | 25 | 21 | 21 | 23 | 23 | 23 | 24 | 23 | 12 | 11 |
n = 27 cells.
Table 2.
Number of NTS single units responsive to tastants and/or odorants with pure odorants
| S | FS | RS | N | FN | RN | A | FA | RA | Q | FQ | RQ | F | R | |
|---|---|---|---|---|---|---|---|---|---|---|---|---|---|---|
| Excitatory | 13 | 14 | 11 | 10 | 13 | 13 | 8 | 11 | 10 | 8 | 13 | 11 | 9 | 7 |
| Inhibitory | 17 | 16 | 15 | 16 | 17 | 17 | 18 | 15 | 15 | 16 | 16 | 19 | 3 | 3 |
| Mixed | 6 | 3 | 6 | 6 | 7 | 6 | 2 | 2 | 3 | 5 | 4 | 3 | 0 | 1 |
| Total | 36 | 33 | 32 | 32 | 37 | 36 | 28 | 28 | 28 | 29 | 33 | 33 | 12 | 11 |
n = 48 cells.
An example of a cell with both tastant and odorant responses is shown in Figure 3. In this cell, S, N, and Q evoked a significant excitatory response that was weakened by pairing the tastant with an odorant (either B or V). However, presentation of A alone did not produce a significant response but pairing A with an odor produced an excitatory response. This response-enhancing effect of odorants was observed in 32% (24/75) of the cells overall (10/27, 37% for trigeminal odorants; 14/48, 29% for pure odorants; no difference between the proportions of cells tested with trigeminal vs pure odorants, χ2 = 0.49, 1 df, p = 0.48). Table 3 summarizes this response-enhancing effect of odorants across the population, indicating the number of cells that responded to each tastant only when that tastant was paired with an odorant. Several cells showed this phenomenon for multiple tastants: one cell responded to all four tastants only when they were paired with one or both odorants, one cell responded to three tastants only when they were paired with odors, two cells responded to two tastants only when they were paired with odors, and six cells responded to one tastant only when it was paired with odors. For pure odorants, two cells responded to all four tastants only when they were presented as taste + odor, one cell responded to three tastants only when they were paired with odors, four cells responded to two tastants only when they were paired with odors, and seven cells responded to one tastant only when it was paired with odors. In some cases, presenting an odorant with a tastant had a response-attenuating effect. Excitatory or inhibitory responses observed in 39% (29/75) of the cells (7/27, 26% for trigeminal odorants; 22/48, 46% for pure odorants, χ2 = 2.89, 1 df, p = 0.09) were abolished after pairing taste with odor.
Figure 3.

Example of the effects of taste +odor pairing on a taste-responsive NTS cell tested with trigeminal odorants. The top of each part shows a raster of taste-evoked spike activity: each dot indicates the occurrence of a spike, each colored dot indicates the delivery of a fluid with a lick, and light blue dots indicate the delivery of water with a lick. Dry licks that occur between water deliveries following stimulus trials are not shown. The bottom of each part shows peristimulus-time histograms of taste responses. It should be noted that while changes in lick pattern regularity after odor presentations are seen in this particular cell, they do not account for all the effects observed. For example, the lick patterns for S, N, and A changed after pairing each tastant with a banana odor (BS, BN, and BA); however, the effect on the response magnitude for each tastant is different: responses to S significantly decreased, responses to N were not significantly different, and responses to A significantly increased after odor addition. Time bin = 100 ms. The labels that are not abbreviations indicate odor + taste simultaneous presentations. This is cell 3 in Figure 4.
Table 3.
Frequency of responses to taste + odor stimuli in the absence of a response to the tastant presented alone
| No. cells | +Banana | +Vinegar | Both | |
|---|---|---|---|---|
| Trigeminal odorants | ||||
| Sucrose | 5 | 5 | 3 | 3 |
| NaCl | 5 | 5 | 4 | 4 |
| Citric acid | 4 | 4 | 3 | 3 |
| Quinine | 3 | 3 | 3 | 3 |
| Pure odorants | ||||
| Sucrose | 5 | 4 | 5 | 4 |
| NaCl | 9 | 8 | 8 | 7 |
| Citric acid | 7 | 7 | 5 | 5 |
| Quinine | 7 | 6 | 7 | 6 |
In addition to changing the number of taste responses, odors also modulated the response magnitudes of cells that responded to tastants alone in a subset of cells. Figures 4 (trigeminal odorants) and 5 (pure odorants) show heat maps of the responses magnitudes evoked by all stimuli illustrating the effects of odor presentation on the responses to taste stimuli. Analysis of response magnitude across all 75 NTS cells showed that the rank order of average excitatory responses to tastants presented alone were N > S > Q > A; however, these mean response magnitudes differed by only 1–2 sps and were not significantly different. There were only slight differences in average inhibitory responses among taste stimuli: A < Q < N < S. Across the entire samples of both trigeminal and pure odorants, pairing tastants with odorants most often did not significantly change the average response magnitudes to taste stimuli (paired Student's t test, ps > 0.05, corrected for multiple comparisons.). Only one cell showed a clear supra-additive effect when either S or N was paired with B odor.
Figure 4.

Heat map of responses to all tastants, odorants, and the degree of change in response magnitude (relative to tastant-only presentation) produced by each taste + odor pairing for vinegar and banana odors tested with trigeminal odorants. Cells with more than one color (e.g., cell 3, N taste-only response) indicate a bimodal response, either an initial excitatory response followed by an inhibitory response or vice versa.
Figure 5.
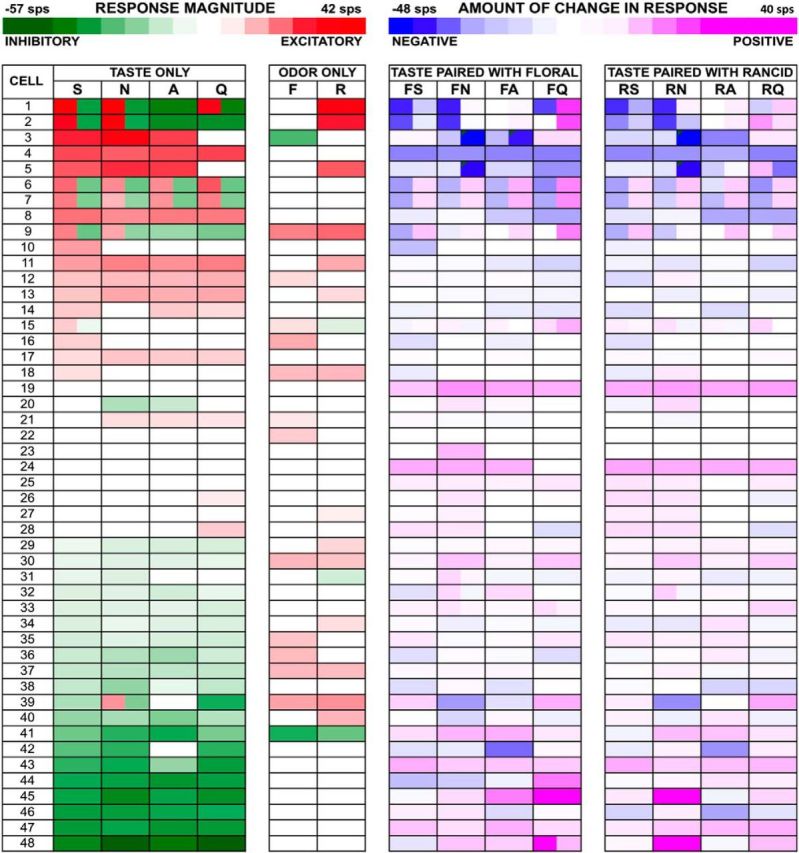
Heat map of responses to all tastants, odorants, and the degree of change in response magnitude (relative to tastant-only presentation) produced by each taste + odor pairing for rancid and floral odors tested with pure odorants.
There were some cells where taste responses were profoundly altered by simultaneously presenting a tastant with odors. Figure 6 illustrates an example of this effect. This cell showed excitatory responses to all tastants but no response to AS or the odorants. When tastants were presented in the presence of odorants, however, the taste responses were clearly enhanced. Moreover, the latency of response was shorter when tastants and odorants were paired. Both odorants had the same effect on taste responses and had similar impact.
Figure 6.

Example of the effects of taste + odor pairing on a taste-responsive NTS cell tested with pure odorants. Details of symbols are as in Figure 3. The labels that are not abbreviations indicate odor + taste simultaneous presentations. This is cell 19 in Figure 5.
Tables 4 and 5 provides an overall summary of the effects of an odorant on the taste response. Modulation of response magnitude, either enhancement or attenuation, was relatively common. It can be seen that both trigeminal odorants enhanced proportionately more taste responses to palatable tastants (sucrose and NaCl) than to unpalatable tastants (citric acid and quinine; χ2 = 11.05, 1 df, p < 0.01). This was not the case for pure odorants, both of which enhanced taste responses in approximately one-third more cells than did the trigeminal odorants. The same was true for attenuation, that is, pure odorants affected a larger proportion of cells than did trigeminal odorants by approximately one-third.
Table 4.
Mean ± SEM enhancement (change ≥ 2 sps) and attenuation (change ≤ 2 sps) of taste responses (sps) when taste stimuli are paired with trigeminal odorants
| Banana | Vinegar | Total | |
|---|---|---|---|
| Enhancement | |||
| Sucrose | 4.3 ± 0.4 (10; 37%) | 4.0 ± 0.7 (9; 33%) | 4.2 ± 0.4 (19/54; 35%) |
| NaCl | 5.3 ± 1.1 (8; 30%) | 5.3 ± 1.0 (5; 19%) | 5.3 ± 0.7 (13/54; 24%) |
| Citric acid | 3.2 ± 0.7 (6; 22%) | 3.8 ± 0.9 (4; 15%) | 3.5 ± 0.5 (10/54; 19%) |
| Quinine | 4.1 ± 1.5 (4; 15%) | 4.3 ± 1.5 (3; 4%) | 4.2 ± 1.0 (5/54; 9%) |
| Total | 4.3 ± 0.4 (28/108; 26%) | 4.3 ± 0.5 (21/108; 19%) | 4.3 ± 0.3 (49/216; 23%) |
| Attenuation | |||
| Sucrose | −7.0 ± 2.5 (6/22%) | −8.1 ± 2.7 (6; 22%) | −7.5 ± 1.7 (12/54; 22%) |
| NaCl | −4.7 ± 0.6 (4/15%) | −9.5 ± 4.0 (5; 19%) | −7.4 ± 2.3 (9/54; 17%) |
| Citric acid | −10.0 ± 2.7 (6/22%) | −11.9 ± 3.3 (4; 15%) | −10.8 ± 2.0 (10/54; 19%) |
| Quinine | −15.5 ± 4.1 (4/15%) | −9.5 ± 2.8 (7; 26%) | −11.7 ± 2.4 (11/54; 20%) |
| Total | −9.3 ± 1.5 (20/108; 19%) | −9.6 ± 1.5 (22/108; 20%) | −9.4 ± 1.1 (42/216; 19%) |
n = 27.
Table 5.
Mean ± SEM enhancement (change ≥ 2 sps) and attenuation (change ≤ 2 sps) of taste responses (sps) when taste stimuli are paired with pure odorants
| Floral | Rancid | Total | |
|---|---|---|---|
| Enhancement | |||
| Sucrose | 8.3 ± 1.6 (14; 29%) | 7.0 ± 1.4 (17; 35%) | 7.6 ± 1.1 (31/96; 33%) |
| NaCl | 10.5 ± 1.4 (19; 40%) | 13.4 ± 4.2 (24; 50%) | 8.8 ± 2.4 (43/96; 45%) |
| Citric acid | 10.9 ± 2.4 (15; 31%) | 8.6 ± 1.6 (14; 29%) | 9.8 ± 1.4 (29/96; 30%) |
| Quinine | 20.7 ± 6.8 (15; 31%) | 7.4 ± 1/7 (14; 29%) | 14.3 ± 3.7 (29/96; 30%) |
| Total | 12.5 ± 1.8 (63/192; 33%) | 9.6 ± 2.1 (69/192; 36%) | 11.0 ± 1.2 (132/384; 34%) |
| Attenuation | |||
| Sucrose | −11.1 ± 2.5 (18; 38%) | −10.9 ± 2.3 (18; 38%) | −10.6 ± 1.7 (36/96; 38%) |
| NaCl | −13.1 ± 3.5 (13; 27%) | −13.2 ± 3.5 (13; 27%) | −13.1 ± 2.4 (26/96; 27%) |
| Citric acid | −8.9 ± 1.9 (14; 29%) | −11.5 ± 1.9 (11; 23%) | −10.0 ± 1.3 (25/96; 26%) |
| Quinine | −12.4 ± 2.8 (12; 25%) | −6.8 ± 1.1 (13; 27%) | −9.5 ± 1.5 (25/96; 26%) |
| Total | −11.3 ± 1.3 (57/192; 30%) | −10.3 ± 1.2 (55/192; 29%) | −10.8 ± 0.90 (112/384; 29%) |
n = 48.
As with the response magnitude, pairing a taste stimulus with an odorant often changed the cell's response latency. Figure 7, a (trigeminal odorants) and b (pure odorants), show the latency of response for each taste stimulus that evoked a response as well as the latency of response in each cell when that tastant was presented with an odorant. It can be seen that odorants both increased and decreased the latency of response, sometimes to a great extent, i.e., by 2–3 s. In fact, there were many cases where odorant modulation of the response latency appeared to be more pronounced than changes in response magnitude. When odorants changed response latency, most often the direction of change, i.e., shortening or lengthening of latency, was the same for both odorants tested, albeit to different degrees. Average latencies across stimuli presented with and without odorants varied from 0.45 ± 0.16 s for latencies of excitatory responses to citric acid presented with banana odor to 1.73 ± 0.24 s for latencies of inhibitory responses to citric acid presented with vinegar odor. For each taste stimulus, however, across the sample there were no significant differences in latencies of response when presenting a taste stimulus with and without an odorant (excitatory response latencies compared and inhibitory response latencies compared, Student's t test all ps > 0.1). Moreover, the latencies of responses, when present, to the odorants alone ranged from 0.87 ± 0.33 s for excitatory responses to banana odor to 1.47 ± 0.21 s for vinegar odor. These latencies are within the range of latencies of response to tastants alone, suggesting that the odorants arrived at the odor port nearly simultaneously with the taste stimuli when the two were paired. Figure 8 shows an example of the effect of odorants on latency of taste responses in one NTS cell. In this cell, taste stimulus presentation along with an odorant eliminated the initial excitatory component of a mixed excitatory–inhibitory taste response and shortened the length of the inhibitory component. The effect on latency was particularly notable for responses to S.
Figure 7.

a, Latencies of response to tastants, odorants, and taste + odor pairs for cells tested with trigeminal odorants. In the first four parts, latencies of response are arranged from shortest to longest for the tastant presented alone. For each of the tastants, latencies of response to taste + odor combinations are shown directly above or below the latency to the tastant presented alone. For odorants, latencies of response are arranged from shortest to longest. Latencies to the tastant presented alone are shown as diamonds. Latencies to vinegar odor are shown as squares. Latencies to banana odor are shown as circles. b, Latencies of response to tastants, odorants, and taste + odor pairs for cells tested with pure odorants. Latencies to rancid odor are shown as squares. Latencies to floral odor are shown as circles. Other details are as in a. In all plots, filled symbols (black or gray) represent latencies of excitatory responses; open symbols represent latencies of inhibitory responses.
Figure 8.

Example of the effects of taste + odor pairing on a taste-responsive NTS cell tested with pure odorants. Details of symbols are as in Figure 3. The labels that are not abbreviations indicate odor + taste simultaneous presentations. This is cell 1 in Figure 5.
Effects of tastant-odorant pairing on temporal coding
Metric space analyses (see Materials and Methods for details) were applied to taste-evoked, odor-evoked, and taste + odor-evoked spike trains for the first 200 ms, 500 ms, 1 s, 1.5 s, and 2 s following the first stimulus lick in 23 cells tested with trigeminal odorants and 48 cells tested with pure odorants. All of these units were tested for at least six trials for all stimuli, including all tastants and all tastant-odorant pairs. At each response interval, analyses were repeated at varying levels of temporal precision, denoted q (1/s). As described previously, the value of q at which information (H, in bits) is greatest is called qmax; the amount of information at qmax is denoted Hmax. Hcount denotes the amount of information at q = 0 and is an indication of the amount of information conveyed by spike count alone (rate coding).
Initially, we compared the amount of information conveyed by spike count + spike timing (Hmax) when tastants were presented alone and when they were presented paired with an odorant. In general, 46/75 cells (61%) showed evidence of temporal coding when tested with tastes alone or with taste + odor. Twenty-one of these (21/46; 46%) showed a significant contribution of spike timing toward conveying information about taste quality. The remainder (25/46; 54%) expressed temporal coding as variation in the rate envelope over the time course of the response. When tastes were paired with odorants both the number of cells showing evidence of temporal coding and their identities changed. For example, most cells showed evidence of temporal coding in only one or two conditions (taste alone or taste + odor), but only one cell for all three. This cell was tested with trigeminal odorants. Details are presented below.
Of those cells tested with tastants and trigeminal odorants (n = 23), 11 showed a significant contribution of temporal coding to the information conveyed about taste quality when the tastants were presented alone and/or paired with an odorant (Fig. 9a). Of these, there were six cells tested with just the basic four tastes that showed evidence of temporal coding (Hmax > Hshuffle + 2 SD and qmax > 0), with two of these showing a significant contribution of spike timing (Hmax > Hshuffle, qmax > 0 and Hmax > Hexchange + 2 SD). Seven cells tested with taste + B odor (three overlapped with those tested with just the four basic tastes) showed evidence of temporal coding with three of these showing a significant contribution of spike timing. Only two cells tested with taste + V odor (one cell overlapped with those tested with just the four basic tastes).
Figure 9.
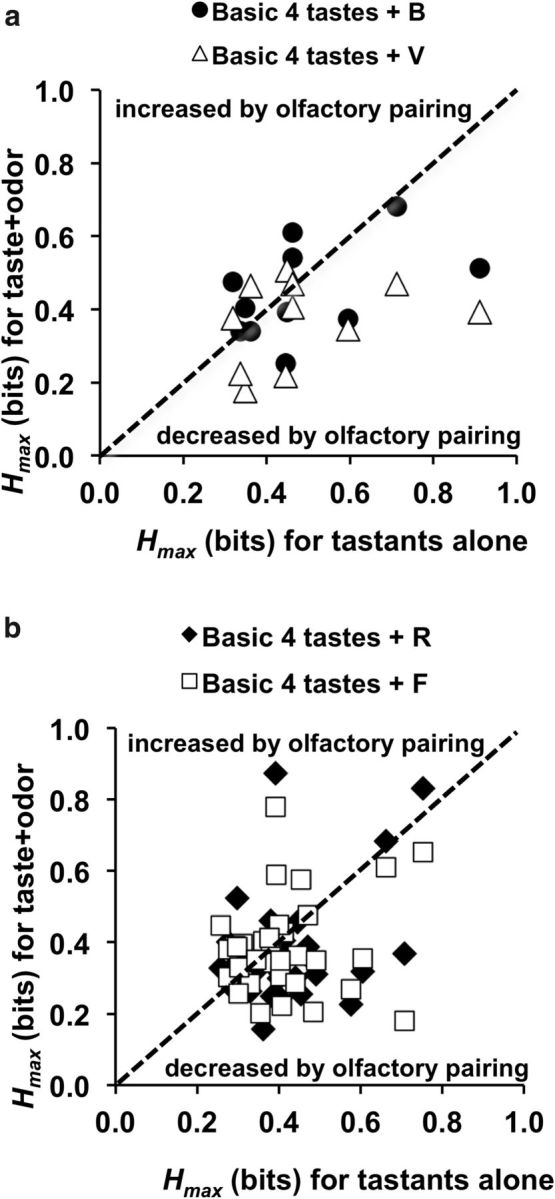
The maximum amount of information about taste quality conveyed by each cell with versus without simultaneous odor pairing. Only cells that showed a significant amount of information about taste quality when taste and/or taste + odor were presented (Hmax > Hshuffle) are included. a, Cells tested with trigeminal odorants, vinegar (V) and banana (B) odors. b, Cells tested with pure odorants, rancid (R) and floral (F) odors.
Results of metric space analyses calculated for the first 2 s of response are shown in Figure 9. On average, pairing B odor with tastants did not significantly affect the amount of information conveyed by spike count + spike timing (Fig. 9a). Average Hmax for taste stimuli alone = 0.49 ± 0.06, average Hmax for taste stimuli + B = 0.45 ± 0.04; paired Student's t test, p > 0.05. Similarly, pairing V odor with tastants did not significantly affect the average Hmax (0.37 ± 0.03) compared with either tastants presented alone or paired with B odor (paired Student's t test, ps > 0.05). There were no significant differences in Hcount among the three conditions (Hcount range = 0.26 ± 0.03 to 0.30 ± 0.04; ps > 0.20). Thus, although the simultaneous presentation of an odorant can increase or decrease the amount of information that a cell conveys about taste, there is no net (average) effect across the population.
Thirty-five cells tested with tastants alone and/or paired with pure odorants showed evidence of temporal coding: 15 cells tested with just the four basic tastes (6 with a significant contribution of spike timing), 18 tested with taste + R odor (9 cells overlapped with those tested with just the four basic tastes and 9 showed a significant contribution of spike timing), and 25 cells tested with taste + F odor (8 cells overlapped with those tested with just the four basic tastes and 9 showed a significant contribution of spike timing). Pairing either F or R odors with taste stimuli had no significant effects on the amount of information conveyed about taste quality across the sample. Average Hmax values ranged from 0.37 ± 0.03 to 0.41 ± 0.02; paired Student's t test; ps > 0.13. Average Hcount values ranged from 0.22 ± 0.02 to 0.26 ± 0.02 and there were no significant differences among them (paired Student's t test, ps > 0.08).
To study the contribution of temporal coding (spike timing plus rate envelope) to the information conveyed about taste quality over time we examined the average amount of information conveyed over various response intervals. This analysis only considered the cells showing a significant contribution of temporal coding. Each point was calculated as the sum of the amount of information contributed by those cells where Hmax > Hshuffle and qmax > 0, divided by the total number of cells in the sample. Results are shown for cells tested with trigeminal odorants (Fig. 10a) and for cells tested with pure odorants (Fig. 10b). Because there was a larger sample of cells tested with pure odorants, results are less variable. It is clear, however, that at all response intervals examined, 0.2–2.0 s, temporal coding is more informative about taste quality than spike count alone. It is also apparent that pairing a taste stimulus with an odorant has little effect on either temporal or rate coding, averaged across the population. Figure 10c shows that the temporal precision of temporal coding is initially high but trails off as the response progresses over time, in agreement with previous reports (Roussin et al., 2012; Weiss et al., 2014). Pairing tastes with odorants did not affect this result. In sum, presenting odorants simultaneously with taste stimuli produced few changes in the way that information about taste quality is conveyed, with the important caveat that this conclusion is based on a very limited set of olfactory stimuli.
Figure 10.

Information in neural responses (average per cell) conveyed by spike count (Hcount, denoted by dashed lines) and a combination of spike count and the temporal characteristics of response (Hmax, denoted by solid lines) at various response intervals (200 ms, 500 ms, 1.0 s, 1.5 s, and 2.0 s). Only cells that showed a significant contribution of temporal coding were included. Each point was calculated as the sum of the amount of information contributed by those cells where Hmax > Hshuffle and qmax > 0, divided by the total number of cells in the sample. a, Cells tested with trigeminal odorants. b, Cells tested with pure odorants. c, Temporal precision at Hmax for increasingly long response intervals for NTS cells tested with pure odorants. At each response interval, the geometric mean of qmax is calculated for all cells that showed a significant contribution of temporal coding. d, Information over the first 2 s of response conveyed by the lick patterns evoked by tastants alone, tastants plus floral odor, and tastants plus rancid odor. Results in a and b show that adding temporal coding increases the information conveyed by the cells; however, the addition of odorants does not increase discriminability among tastants versus tastants when paired with an odorant. Results in d show that the lick pattern cannot account for the information conveyed by the neural response. See text for further details.
In some cells, the presence of an odorant changed the licking pattern (Fig. 3), mostly by breaking the regularity of the lick rhythm. This had the effect of extending the taste stimulus acquisition interval past what would result from a regular lick pattern, ∼1 s. This was not the case for all cells nor was it the case for all stimuli or all trials of a given stimulus. It is noteworthy that the effects of odorant presentation on the lick pattern did not predict their effects or lack thereof on responses to tastants + odorants.
The amount of information about taste and taste + odor conveyed by the lick pattern for the first 2 s of response across cells is shown in Figure 10d for the four basic tastes and the four basic tastes paired with either floral or rancid odor. Note that the addition of an odorant to the taste stimulus did not affect the information conveyed by the lick pattern. Moreover, the amount of information conveyed by the lick pattern is much less than that conveyed by the neural response (Fig. 10b, filled symbols), indicating that changes in the lick pattern induced by the odorant cannot account for the effect of the odorant on the information carried by spikes.
The analysis up to this point is predicated on the view that taste is the primary domain to be encoded, and that the odorant is a potential modulator. While this is a natural view to take for a relay nucleus in the taste pathway, the strong interactions observed between tastants and odorants suggest that odor can also be encoded. To test this directly, we asked whether taste-responsive cells could convey information to discriminate among stimuli consisting of a tastant alone versus with two taste-odor pairs. Results of these analyses for cells tested with pure odorants are shown in Figure 11a. On average, Hmax for the three-way comparisons (taste vs taste + F vs taste + R) ranged between 0.64 ± 0.03 and 0.69 ± 0.03 bits. These values represent 40–44% of the maximum amount of information required for a perfect discrimination of three alternatives, 1.59 bits. Interestingly, this proportion is higher than the average fraction of the information conveyed about the set of four tastants, either with or without an odorant added (∼25%, as described above). Note also that information about the odorant is only conveyed when a tastant is present: the information conveyed by the three-way comparison of AS versus R versus F is also smaller (mean Hmax = 0.37 ± 0.03 bits, 23 ± 2% of 1.59 bits) than information conveyed when a constant tastant is present with the odors. Since AS is intended to mimic the rat's saliva, which is always present, the presentation of AS alone or with an odorant controls for the licking that is produced by fluids, which serve as taste stimuli, but without evoking a taste response. Thus, the comparison of AS (which produces no response) versus R (presented with AS) versus F (presented with AS) is intended to measure odor discrimination.
Figure 11.

a, Results of metric space analyses of three-way comparison of tastant versus tastant + F odor versus tastant + R odor. For a perfect discrimination, 1.58 bits are needed. Distance above the dashed diagonal line corresponds to the amount of additional information conveyed by the temporal aspects of the response; for a point on the diagonal line (Hmax = Hcount), all information is carried by spike count alone. b, Comparison of average (±SEM) Hmax and Hcount for comparisons of all taste, odor, and taste + odor combinations for cells tested with pure odorants. Responses to artificial saliva were also included. For all 15 stimuli, n = 39 cells; for just the four basics, n = 15 cells. For all 15 stimuli, the amount of information necessary for a perfect discrimination = 3.91 bits; for four tastes, 2.0 bits are required; **p < 0.01.
The above results—that NTS neurons convey information about an odorant, provided that a tastant is present—suggested that taste-odorant pairs might indeed be perceived as singular percepts, and that the system is operating in this joint domain, rather than in one modality or the other. To examine this question, we calculated the mean fraction of the total amount of information conveyed by spike trains for all 15 tastant and taste-odor pairs (3.91 bits) and compared it to the mean fraction of the total amount of information conveyed by spike trains for all four tastants presented alone (2.0 bits). Results, shown in Figure 11b, reveal that proportionately more information is conveyed about all 15 stimuli than is conveyed about tastants presented alone, or about odorants presented alone. This difference is magnified if expressed in terms of the absolute amount of information, since the absolute amount of information is related to the fractions shown in Figure 11b by multiplication by factors of 3.9, 2, and 1.58, respectively.
Discussion
Through projections to the underlying reticular formation (Nasse et al., 2008), the NTS modulates the behavioral reactivity to food by influencing orofacial movements, including licking and gaping. To accomplish this task, the NTS has access to information from the mouth about the tactile, thermal, and chemical characteristics of ingesta. Here, in agreement with Van Buskirk and Erickson (1977), we show that almost half of taste-responsive cells in the NTS were found to respond to odors presented alone. Further, we extend previous work by showing that olfactory input can modulate NTS taste responses. Specifically, 15% of taste responses were only present when the tastant was paired with an odor. Even more predominant were the modulatory effects of odors on taste responses, taking the form of attenuation, enhancement, and/or changes in latency of response and occurring in nearly all cells (Figs. 4, 5). The net result is that NTS neurons conveyed more information about combined tastant/odorant pairs than about either tastants or odorants alone, both in terms of the absolute amount of information, and the fraction of the available information (Fig. 11a).
On a population level, these changes modify the spatiotemporal landscape associated with taste stimuli. On a cell-by-cell level, odor–taste interactions can alter the information that the evoked spike trains convey about taste quality. Specifically, in a subpopulation of cells, information was significantly enhanced or attenuated when tastes alone versus tastes + odors were compared (Fig. 9). The capacity of these taste cells to respond to odors suggests that they may be integral to the feeding circuit. Results of metric space analyses of spike trains showed that when odors were presented with a particular tastant, there was a good deal of information conveyed discriminating among taste stimuli presented alone versus paired with an odorant (Fig. 10). These data suggest that NTS cells may be able to distinguish complex, multimodal sensory stimuli, i.e., flavors. In that context, one function for olfactory modulation of taste responses might be to enhance identification of objects that are eligible (or ineligible) to serve as nourishment.
Our results show that odors can modulate the strength of a cell's response to a tastant as well as its latency (Tables 4, 5, Figs. 3, 6). Differences in taste-response latencies after odor addition were highly varied across cells. It is possible that the actual time when the rat inhaled the odorant and when odor molecules reached the nasal epithelium might account for some of the variability in latencies of response. Although both gustatory and olfactory stimuli were delivered simultaneously, the exact time that the animal inhaled the odorant was not measured. Nevertheless, by shifting latencies of response, the simultaneous presentation of olfactory stimuli along with tastants changed the spatiotemporal pattern of neural activity evoked by a taste (now a taste + odor). The fact that pairing the same odorant with the array of tastants of different qualities did not change the amount of information conveyed about taste quality (on average) suggests that the analytical capability of the system, its ability to identify the components of a mixture, remained intact. Thus, adding the same odor to all taste qualities did not degrade the ability to discriminate among taste qualities but instead added a new dimension that was or was not relevant depending on the particular cell. Conversely, responses to taste alone versus taste + odor were relatively well discriminated from each other within a taste quality (Fig. 11b), suggesting that the presence of odorants, or lack thereof, were also detected despite the common presence of a tastant.
The effects of olfactory stimuli on taste responses were widespread, but not universal. That is, there was a subset of NTS cells whose responses were unaltered by simultaneous odor presentation. While it is possible that we did not test the odorant to which these cells were sensitive, it is also possible that these cells were “taste-only” NTS cells, specialized to convey information about taste alone. If that were the case, one might argue that the NTS contains, and likely requires, relatively few cells that convey only taste information without the potential for modification by other modalities of input. Consistent with this idea are data showing that the NTS in the awake state contains relatively few cells that respond only to taste (Roussin et al., 2012). These cells presumably relay purely gustatory information upstream to enable registration and identification of taste stimuli.
The observation that NTS taste-responsive cells are affected by simultaneous presentation of odors begs the question of whether the percept of “flavor” (derived from the integration of gustatory, olfactory, tactile, and thermal information) is apparent at a very early stage of neural processing. It has been argued that a defining characteristic of multisensory integration is supra-additivity, the ability of a compound stimulus to evoke a larger response than the arithmetic sum of the responses to the components (Stein, 1998). But the applicability of this criterion to the current dataset is unclear—since several neurons that showed an enhanced response to a tastant + odorant did not respond to the tastants and/or odorant presented alone (Tables 1–3). If we consider such neurons to be supra-additive, then supra-additivity is common; if we only count neurons as supra-additive if they had a response to both tastant and odorant in isolation, it is rare (only one such neuron was seen). More importantly, this notion is predicated on the choice of a scalar response measure—firing rate over an experimenter-defined interval—and this is likely an oversimplification. Here, and in previous work (Roussin et al., 2012; Weiss et al., 2014), we show that taste responses in the NTS of awake rats show dynamic and informative changes in firing rate and pattern related to taste quality. Alterations of response magnitude and latency seen here when odors were paired with tastes most certainly affected these dynamics on both a cellular and population level. Whether these changes qualify as evidence for multisensory integration is a matter for debate (or perhaps definition), but the data concerning the amount of information coded (Fig. 11) indicates that at least, taste and odor are coded jointly in the NTS.
Small and Green (2012) have proposed that the neural representation of a “flavor object” consists of a distributed network encompassing the insula, operculum (including the somatomotor mouth region), orbitofrontal, piriform, and anterior cingulate cortices. Their model proposes that the integrity of unimodal input is maintained until it reaches the cortex. Learned associations of these disparate sensations complete the construction of the flavor object. This distributed pattern of neural activity among cortical areas may indeed represent the sensation of flavor, but may not be the endpoint of that information. In effect, downstream projections may relay flavor-related information to areas such as the amygdala (Saddoris et al., 2005), hypothalamus (Berthoud and Münzberg, 2011), PbN, and NTS (Lundy, 2008), to modulate ingestion. Recent discoveries of gustatory responses in the piriform cortex (Maier et al., 2012), for example, raise the possibility that corticofugal projections may underlie olfactory responses in NTS. Alternatively, or perhaps in addition, bottom-up input related to tactile, thermal, and olfactory information may also be present through the trigeminal nerve (Van Buskirk and Erickson, 1977; Jacquin et al., 1982; Hamilton and Norgren, 1984; Marfurt and Rajchert, 1991). Figure 12 shows a diagram of the potential routes by which olfactory information may be conveyed to the NTS.
Figure 12.

Anatomical interconnections of the gustatory and olfactory systems in the brain. ORN, olfactory receptor neuron; OB, olfactory bulb; PC, piriform cortex; RF, reticular formation; AMG, amygdala; OFC, orbital frontal cortex; CN, cranial nerve; VPMpc, parvocellular ventroposteromedial thalamus; GC, gustatory cortex; LH, lateral hypothalamus; BNST, bed nucleus of the stria terminalis; PbN, parabrachial nucleus; NTS, nucleus of the solitary tract. Boxes: green, cortical structures; blue, limbic system structures; red, brainstem structures; orange, precortical olfactory structure; black, peripheral structures.
Human imaging studies strongly suggest that the orbitofrontal cortex and insula were responsive only when taste and odor were congruent (Small and Green, 2012; Verhagen and Engelen, 2006). However, some studies have found that differential context effects were present even when stimuli (smell and taste) were not congruent (Stevenson and Mahmut, 2010). In the current study, our stimulus set was too small to provide a legitimate test for an effect of congruency. Even so, we found no evidence for congruence with the stimuli we tested. It is possible, as Stevenson and Mahmut (2010) suggested, that congruence is an important part of creating odor perception but not when encoding context effects. This is in alignment with the notion the NTS may process context effects on gustation as might be seen when taste responses to one taste quality are altered by brief presentations of another taste quality (Di Lorenzo et al., 2003) or when responses to taste mixtures vary from the responses to their components (Chen and Di Lorenzo, 2008; Di Lorenzo et al., 2009). It is possible that odorants are providing a context that can help disambiguate the stimuli and make detection and discrimination easier. It is also possible that although the NTS can identify tastants of a single quality, it is more optimally tuned to the perception of more naturalistic stimuli. Experiments in vision, for example, have shown that neurons in visual cortex can distinguish changes in natural scenes more readily than simple rotating geometric patterns (Li et al., 2002; Braun, 2003). It is possible, therefore, that the function of the NTS is to code multisensory combinatorial stimuli, i.e., food, rather than unimodal taste qualities.
Footnotes
This work is funded by National Institute on Deafness and Other Communication Disorders Grant RO1 DC006914 to P.M.D.L. This work was done in partial fulfillment of the Master's degree for O.D.E. We thank Dr. Christiane Linster for her generous donation of equipment and advice.
The authors declare no competing financial interests.
References
- Berthoud HR, Münzberg H. The lateral hypothalamus as integrator of metabolic and environmental needs: from electrical self-stimulation to opto-genetics. Physiol Behav. 2011;104:29–39. doi: 10.1016/j.physbeh.2011.04.051. [DOI] [PMC free article] [PubMed] [Google Scholar]
- Boucher Y, Simons CT, Faurion A, Azérad J, Carstens E. Trigeminal modulation of gustatory neurons in the nucleus of the solitary tract. Brain Res. 2003;973:265–274. doi: 10.1016/S0006-8993(03)02526-5. [DOI] [PubMed] [Google Scholar]
- Braun J. Natural scenes upset the visual applecart. Trends Cogn Sci. 2003;7:7–9. doi: 10.1016/S1364-6613(02)00008-6. [DOI] [PubMed] [Google Scholar]
- Chen JY, Di Lorenzo PM. Responses to binary taste mixtures in the nucleus of the solitary tract: neural coding with firing rate. J Neurophysiol. 2008;99:2144–2157. doi: 10.1152/jn.01020.2007. [DOI] [PubMed] [Google Scholar]
- Di Lorenzo PM, Garcia J. Olfactory responses in the gustatory area of the parabrachial pons. Brain Res Bull. 1985;15:673–676. doi: 10.1016/0361-9230(85)90219-9. [DOI] [PubMed] [Google Scholar]
- Di Lorenzo PM, Victor JD. Taste response variability and temporal coding in the nucleus of the solitary tract of the rat. J Neurophysiol. 2003;90:1418–1431. doi: 10.1152/jn.00177.2003. [DOI] [PubMed] [Google Scholar]
- Di Lorenzo PM, Lemon CH, Reich CG. Dynamic coding of taste stimuli in the brainstem: effects of brief pulses of taste stimuli on subsequent taste responses. J Neurosci. 2003;23:8893–8902. doi: 10.1523/JNEUROSCI.23-26-08893.2003. [DOI] [PMC free article] [PubMed] [Google Scholar]
- Di Lorenzo PM, Chen JY, Victor JD. Quality time: representation of a multidimensional sensory domain through temporal coding. J Neurosci. 2009;29:9227–9238. doi: 10.1523/JNEUROSCI.5995-08.2009. [DOI] [PMC free article] [PubMed] [Google Scholar]
- Hamilton RB, Norgren R. Central projections of gustatory nerves in the rat. J Comp Neurol. 1984;222:560–577. doi: 10.1002/cne.902220408. [DOI] [PubMed] [Google Scholar]
- Hirata S, Nakamura T, Ifuku H, Ogawa H. Gustatory coding in the precentral extension of area 3 in Japanese macaque monkeys; comparison with area G. Exp Brain Res. 2005;165:435–446. doi: 10.1007/s00221-005-2321-y. [DOI] [PubMed] [Google Scholar]
- Jacquin MF, Semba K, Rhoades RW, Egger MD. Trigeminal primary afferents project bilaterally to dorsal horn and ipsilaterally to cerebellum, reticular formation, and cuneate, solitary, supratrigeminal, and vagal nuclei. Brain Res. 1982;246:285–291. doi: 10.1016/0006-8993(82)91177-5. [DOI] [PubMed] [Google Scholar]
- Laska M, Distel H, Hudson R. Trigeminal perception of odorant quality in congenitally anosmic subjects. Chem Senses. 1997;22:447–456. doi: 10.1093/chemse/22.4.447. [DOI] [PubMed] [Google Scholar]
- Li FF, VanRullen R, Koch C, Perona P. Rapid natural scene categorization in the near absence of attention. Proc Natl Acad Sci U S A. 2002;99:9596–9601. doi: 10.1073/pnas.092277599. [DOI] [PMC free article] [PubMed] [Google Scholar]
- Lundy RF., Jr Gustatory hedonic value: potential function for forebrain control of brainstem taste processing. Neurosci Biobehav Rev. 2008;32:1601–1606. doi: 10.1016/j.neubiorev.2008.07.002. [DOI] [PMC free article] [PubMed] [Google Scholar]
- Maier JX, Wachowiak M, Katz DB. Chemosensory convergence on primary olfactory cortex. J Neurosci. 2012;32:17037–17047. doi: 10.1523/JNEUROSCI.3540-12.2012. [DOI] [PMC free article] [PubMed] [Google Scholar]
- Marfurt CF, Rajchert DM. Trigeminal primary afferent projections to “non-trigeminal” areas of the rat central nervous system. J Comp Neurol. 1991;303:489–511. doi: 10.1002/cne.903030313. [DOI] [PubMed] [Google Scholar]
- Nasse J, Terman D, Venugopal S, Hermann G, Rogers R, Travers JB. Local circuit input to the medullary reticular formation from the rostral nucleus of the solitary tract. Am J Physiol Regul Integr Comp Physiol. 2008;295:R1391–R1408. doi: 10.1152/ajpregu.90457.2008. [DOI] [PMC free article] [PubMed] [Google Scholar]
- Ogawa H, Imoto T, Hayama T. Responsiveness of solitario-parabrachial relay neurons to taste and mechanical stimulation applied to the oral cavity in rats. Exp Brain Res. 1984;54:349–358. doi: 10.1007/BF00236237. [DOI] [PubMed] [Google Scholar]
- Ogawa H, Hayama T, Yamashita Y. Thermal sensitivity of neurons in a rostral part of the rat solitary tract nucleus. Brain Res. 1988;454:321–331. doi: 10.1016/0006-8993(88)90833-5. [DOI] [PubMed] [Google Scholar]
- Panzeri S, Senatore R, Montemurro MA, Petersen RS. Correcting for the sampling bias problem in spike train information measures. J Neurophysiol. 2007;98:1064–1072. doi: 10.1152/jn.00559.2007. [DOI] [PubMed] [Google Scholar]
- Roussin AT, D'Agostino AE, Fooden AM, Victor JD, Di Lorenzo PM. Taste coding in the nucleus of the solitary tract of the awake, freely licking rat. J Neurosci. 2012;32:10494–10506. doi: 10.1523/JNEUROSCI.1856-12.2012. [DOI] [PMC free article] [PubMed] [Google Scholar]
- Saddoris MP, Gallagher M, Schoenbaum G. Rapid associative encoding in basolateral amygdala depends on connections with orbitofrontal cortex. Neuron. 2005;46:321–331. doi: 10.1016/j.neuron.2005.02.018. [DOI] [PubMed] [Google Scholar]
- Small DM, Green BG. A proposed model of a flavor modality. In: Murray MM, Wallace MT, editors. The neural bases of multisensory processes. Boca Raton, FL: CRC; 2012. Chap 36. [Google Scholar]
- Stapleton JR, Lavine ML, Wolpert RL, Nicolelis MA, Simon SA. Rapid taste responses in the gustatory cortex during licking. J Neurosci. 2006;26:4126–4138. doi: 10.1523/JNEUROSCI.0092-06.2006. [DOI] [PMC free article] [PubMed] [Google Scholar]
- Stein BE. Neural mechanism for synthesizing sensory information and producing adaptive behaviors. Exp Brain Res. 1998;123:124–135. doi: 10.1007/s002210050553. [DOI] [PubMed] [Google Scholar]
- Stevenson RJ, Mahmut M. Differential context effects between sweet tastes and smells. Atten Percept Psychophys. 2010;72:2304–2313. doi: 10.3758/BF03196703. [DOI] [PubMed] [Google Scholar]
- Travers SP, Norgren R. Organization of orosensory responses in the nucleus of the solitary tract of the rat. J Neurophysiol. 1995;73:2144–2162. doi: 10.1152/jn.1995.73.6.2144. [DOI] [PubMed] [Google Scholar]
- Van Buskirk RL, Erickson RP. Odorant responses in taste neurons of the rat NTS. Brain Res. 1977;135:287–303. doi: 10.1016/0006-8993(77)91032-0. [DOI] [PubMed] [Google Scholar]
- Verhagen JV, Engelen L. The neurocognitive bases of human multimodal food perception: sensory integration. Neurosci Biobehav Rev. 2006;30:613–650. doi: 10.1016/j.neubiorev.2005.11.003. [DOI] [PubMed] [Google Scholar]
- Victor JD. Spike train metrics. Curr Opin Neurobiol. 2005;15:585–592. doi: 10.1016/j.conb.2005.08.002. [DOI] [PMC free article] [PubMed] [Google Scholar]
- Victor JD, Purpura KP. Nature and precision of temporal coding in visual cortex: a metric-space analysis. J Neurophysiol. 1996;76:1310–1326. doi: 10.1152/jn.1996.76.2.1310. [DOI] [PubMed] [Google Scholar]
- Victor JD, Purpura KP. Sensory coding in cortical neurons. Recent results and speculations. Ann NY Acad Sci. 1997;835:330–352. doi: 10.1111/j.1749-6632.1997.tb48640.x. [DOI] [PubMed] [Google Scholar]
- Weiss MS, Victor JD, Di Lorenzo PM. Taste coding in the parabrachial nucleus of the pons in awake, freely licking rats and comparison with the nucleus of the solitary tract. J Neurophysiol. 2014;111:1655–1670. doi: 10.1152/jn.00643.2013. [DOI] [PMC free article] [PubMed] [Google Scholar]
- Wilson DM, Lemon CH. Modulation of central gustatory coding by temperature. J Neurophysiol. 2013;110:1117–1129. doi: 10.1152/jn.00974.2012. [DOI] [PMC free article] [PubMed] [Google Scholar]
- Yue EL, Cleland TA, Pavlis M, Linster C. Opposing effects of D1 and D2 receptor activation on odor discrimination learning. Behav Neurosci. 2004;118:184–190. doi: 10.1037/0735-7044.118.1.184. [DOI] [PubMed] [Google Scholar]