

Abstract
The brain receives information about the direction of object motion from several types of retinal ganglion cells (RGCs). On-Off direction-selective (DS) RGCs respond preferentially to stimuli moving quickly in one of four directions and provide a significant (but difficult to quantify) fraction of RGC input to the SC. On DS RGCs, in comparison, respond preferentially to stimuli moving slowly in one of three directions and are thought to only target retinorecipient nuclei comprising the accessory optic system, e.g., the medial terminal nucleus (MTN).
To determine the fraction of SC-projecting RGCs that exhibit direction selectivity, and the specificity with which On-Off and On DS RGCs target retinorecipient areas, we performed optical and electrophysiological recordings from RGCs retrogradely labeled from the mouse SC and MTN. We found, surprisingly, that both On-Off and On DS RGCs innervate the SC; collectively they constitute nearly 40% of SC-projecting RGCs. In comparison, only On DS RGCs project to the MTN. Subsequent experiments revealed that individual On DS RGCs innervate either the SC or MTN and exhibit robust projection-specific differences in somatodendritic morphology, cellular excitability, and light-evoked activity; several projection-specific differences in the output of On DS RGCs correspond closely to differences in excitatory synaptic input the cells receive. Our results reveal a robust projection of On DS RGCs to the SC, projection-specific differences in the response properties of On DS RGCs, and biophysical and synaptic mechanisms that underlie these functional differences.
Keywords: accessory optic system, retinorecipient, tectum
Introduction
Distinct neural circuits enable appropriate behavioral responses to different sensory modalities and distinct characteristics of a given sensory modality. In the visual system, for example, neurons in separate nuclei govern distinct aspects of sensorimotor behavior. Classic work established the sufficiency and necessity of activity in the SC for rapid, ballistic (“saccadic”) eye movements (for review, see Wurtz and Albano, 1980; Sparks and Mays, 1990). Separate experiments established a critical role for the nuclei comprising the accessory optic system for moving the eyes smoothly in the direction opposite slow, global visual motion (for review, see Simpson, 1984).
The distinct behavioral roles of the SC and accessory optic system are thought to reflect, at least in part, differences in the visual input these areas receive from the retina. In most vertebrates (with the notable exception of primates; Perry et al., 1984, Perry and Cowey, 1984), a large number and diversity of RGCs innervate the SC (for review, see Berson, 2008). Accessory optic system nuclei, in comparison, receive input only from RGCs that respond preferentially to stimuli moving in one of several preferred directions, i.e., direction-selective (DS) RGCs (Barlow and Hill, 1963; Barlow et al., 1964; Oyster, 1968; Oyster and Barlow, 1967).
DS RGCs have traditionally been divided into two types based on their somatodendritic morphology, response properties, and/or axonal projections. On DS RGCs exhibit large, monostratified dendritic trees, respond preferentially to slow image motion in one of three directions, and project largely, if not entirely, to the accessory optic system (Oyster et al., 1980; Buhl and Peichl, 1986; Amthor et al., 1989). On-Off DS RGCs, in comparison, exhibit small, bistratified dendritic trees; respond preferentially to rapid visual motion in one of four directions; and innervate the SC among other structures (for review, see Vaney et al., 2012). Recent evidence indicates that On-Off DS RGCs can also innervate nuclei in and adjacent to the accessory optic system (Kay et al., 2011, Dhande et al., 2013).
Expression of fluorescent proteins in subsets of mouse RGCs has both clarified and raised a number of questions about the specificity with which RGCs in general, and DS RGCs in particular, convey information to the brain (for review, see Dhande and Huberman, 2014). For example, while it is clear that many On-Off DS RGCs innervate the SC, the fraction of SC-projecting RGCs that exhibit direction selectivity (or any other particular functional property) has been difficult to determine. Likewise, it remains unclear to what extent the SC receives input from RGCs that are thought to target other retinorecipient areas, e.g., On DS RGCs. To resolve these ambiguities we characterized and compared the somatodendritic morphology, membrane excitability, and light-evoked synaptic inputs and action potential output of RGCs retrogradely labeled from the SC and MTN.
Materials and Methods
Animals and surgical procedures.
Experiments were performed on 5- to 12-week-old C57BL/6J mice of either sex. All procedures were approved by the Institutional Animal Care and Use Committee at the Janelia Research Campus.
We used stereotaxic injection of adeno-associated virus (AAV), fluorescent latex microspheres (LumaFluor, DiI (Life Technologies), or fluorophore-conjugated cholera toxin (List Biological Laboratories) to retrogradely label RGCs from the SC and MTN. AAV 2.1 viral vectors were obtained from the Penn vector core and the Janelia Research Campus' molecular biology facility; the virus drove expression of GCaMP6f under the control of the human synapsin promoter. Stereotaxic coordinates for SC injections were as follows: 0–0.2 mm rostral from lambda, 0.3–0.7 mm lateral from the midline, and 0.9–1.2 mm deep from the pial surface. We targeted the caudal half of the SC to avoid labeling RGCs innervating the nucleus of the optic tract and/or posterior pretectal nucleus. Coordinates targeting the MTN were as follows: 1–1.25 mm rostral to lambda, 0.8–1.1 mm lateral to the midline, and −4.4–4.9 mm deep below the pial surface. We injected 25–75 nl of beads or virus at each site.
Mice were dark adapted overnight >2 d after stereotaxic injection of beads or >21 d after viral injections. The next morning animals were killed via cervical dislocation; this and all subsequent procedures were performed under infrared (>900 nm) illumination. The eyes were dissected and stored in a light-tight container in bicarbonate-buffered Ames solution (Sigma-Aldrich) equilibrated with carbogen (95% O2, 5% CO2). The cornea, lens, and vitreous were removed mechanically from each eye. Subsequently, a section of the eye cup was cut with a scalpel blade and the retina separated from the pigment epithelium. The retina was placed ganglion cell side up on a piece of filter paper (Anodisc13; Whatman); this filter paper was secured to a glass-bottomed recording chamber via grease. The retina was secured to the filter paper via nylon wires stretched across a platinum scaffold. Warm (30–34°) equilibrated Ames solution perfused the recording chamber at a rate of ∼6 ml/min; light-evoked responses were weaker and/or unstable at lower perfusion rates.
Light stimuli and data collection.
Stimuli were specified via custom software (written in openGL by Anthony Leonardo and Calin Culineau) and generated via a customized DMD projector (DepthQ; InFocus) with a refresh rate of 120 Hz. The output of the DMD 1280 × 780 array was delivered to the recording chamber via a dichroic mirror placed beneath the condenser lens of an upright microscope (Zeiss); each pixel was ∼1 μm2. The light source, a broad-spectrum white LED (SugarCUBE; Nathaniel Group), was attenuated by neutral density filters; during optical recordings, the light source was short-pass filtered (<475 nm; Edmund Optics) to avoid corrupting detection of fluorescent signals emitted by GCaMP6f. The intensity of the light stimulus at 100% contrast was ∼3 × 10⁶ photons/μm2/s.
Fluorescence was generated and captured via multiphoton excitation fluorescence laser-scanning microscopy (Ultima; Prairie Technologies). The Ti:sapphire laser (Ultra II; Coherent) was tuned to 910 nm (GCaMP6f) or 880 nm (beads). The laser intensity was modulated by a Pockels Cell (Conoptics); laser intensity at the preparation was <10 mW. We captured full-field frames (64 × 64 pixels) at 10 Hz via a 40× objective with an optical zoom factor of 4. Under these circumstances each pixel subtended 1.16 μm2. As in other investigations of the retina using multiphoton excitation (Briggman and Euler, 2011; Briggman et al., 2011), we imaged from ∼100 μm2 regions of space, i.e., areas of space equivalent to, or smaller, than that of the visual stimulus. Retinal photoreceptors are orders of magnitude less sensitive to ∼900 nm light than visible wavelengths; nonetheless, as reported previously (Euler et al., 2009; Borghuis et al., 2011), scanning of the laser produced measurable responses in RGCs in the absence of any visual stimuli that persisted for 5–15 s. Therefore, we presented visible stimuli only after this laser-induced activity subsided.
Cell-attached (or “loose-seal”) and whole-cell patch-clamp recordings were performed with pipettes fabricated from thin-wall borosilicate glass (Sutter). For cell-attached recordings we filled the pipettes (4–8 MΩ) with Ames solution. The internal solution for whole-cell voltage-clamp recordings contained the following (in mm): 112.5 CsMeSO4, 10 HEPES, 10 EGTA, 4 MgATP, 0.5 NaGTP, 1 MgSO4, 5 QX-314, and 0.25 Alexa 594 or 488. Whole-cell current-clamp recordings were performed with an internal solution containing the following (in mm): 134 K-gluconate, 7 KCl, 10 HEPES, 2 MgCl2, 2 MgATP; 0.4 NaGTP, and 10 Na-phosphocreatine. Electrophysiological signals were amplified and then low-pass filtered at 3–5 KHz (Multiclamp 700B; Molecular Devices). Data were digitized at 10 kHz (ITC-18; HEKA) and saved to disk via custom, open-source software (Symphony; https://github.com/Symphony-DAS/symphony/).
Data analysis.
Analyses of light-evoked responses were performed via procedures written in MATLAB (The MathWorks). Light-evoked responses were aligned to stimulus onset via measurement (with a photodiode) of a signal that changed with each frame. ROIs for each cell were drawn manually from the maximal projection intensity fluorescence image and/or the cross-correlation of time-varying fluorescence signals elicited by light stimuli. The background fluorescence (F) and the change in fluorescence (ΔF) were calculated separately for each epoch. Average ROI responses reflected the mean signal elicited by three to five repetitions of the same stimulus. For electrophysiological responses, spikes times, once aligned to the time of stimulus onset, were used to generate a spike density function. A robust measure of direction selectivity was computed as the vector sum of responses (to stimuli moving in eight different directions) normalized by the scalar sum of responses. The amplitude of normalized vector sum length (NVSL) varies between 0 and 1 and the angle of the NVSL defined the preferred direction of each cell.
Analysis of somatodendritic morphology was performed in NeuronStudio (Dumitriu et al., 2011). Dendritic area was calculated as the area of the surface created by linking dendrite extremities of each reconstructed model neuron. To quantify the degree to which dendrites were organized asymmetrically about the soma, we first weighted each point of the tree model by the distance of dendrites it represents (i.e., length of vector n − 1 to n points), then calculated the NVSL for all soma to point vectors. This index is 0 for a cell with dendrites arranged radially symmetric about soma 1 if all points fell along a single vector.
Results
We used two complementary techniques to characterize RGCs projecting to a known retinorecipient area. To assay the stimulus-evoked responses of many RGCs in parallel we combined projection-specific expression of the fluorescent Ca2+-sensitive indicator GCaMP6f (Chen et al., 2013) with multiphoton excitation laser-scanning fluorescence microscopy (for review, see Svoboda and Yasuda, 2006). To characterize the functional and morphological properties of individual RGCs, we performed cell-attached and/or whole-cell patch-clamp recordings from cells labeled via retrograde transport of fluorescent dyes.
Functional properties of retinal input to the SC
Our first approach to characterizing RGCs targeting a specific downstream area exploited the observation that stereotaxic injection of standard AAV into one of several retinorecipient nuclei led to robust infection of RGCs. The RGCs shown on the right side of Figure 1A, for example, were infected following injection of AAV coding for GCaMP6f into the SC.
Figure 1.
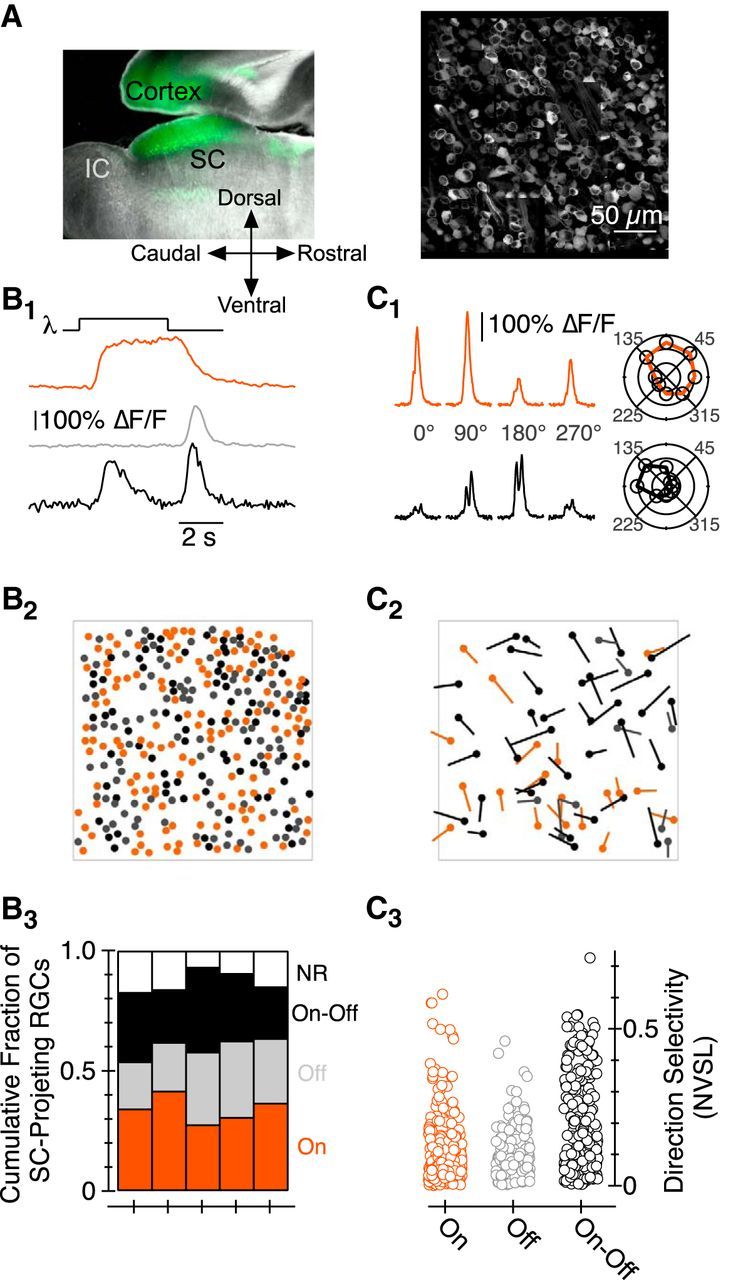
Characterization of SC-projecting RGC responses to light stimuli via GCaMP6f. A, Left, Sagittal section of a mouse brain in which AAV_hSyn_GCaMP6f was injected in the SC. Fluorescence in areas rostral to the SC originates from the axons of GCaMP-expressing SC neurons that project to pretectal nuclei; we see no fluorescent cell bodies in the pretectal areas. Right, Montage image of a subset of the RGCs labeled following injection of an AAV coding for GCaMP6f into the SC. B1, ΔF/F as a function of time in three ROIs. B2, Location of On (orange), Off (gray), and On-Off (black) SC-projecting RGCs from retina shown in A. B3, Fraction of On, Off, On-Off, and NR SC-projecting RGCs in each of five Ca2+-imaging experiments. C1, ΔF/F as a function of time for stimuli moving in one of four directions; the top/bottom data are from an On/On-Off RGC, respectively. Polar plot representation of peak ΔF/F as a function of the direction of object motion for each RGC is shown on the right. C2, Location, and preferred direction, of DS RGCs in the piece of retina shown in A; the length of each vector corresponds to the NVSL. C3, NVSL for GCaMP6f-mediated responses elicited by eight different directions of motion in each On, Off, and On-Off RGC. IC, inferior colliculus.
To characterize the responses of many SC-projecting RGCs simultaneously, we measured GCaMP6f-mediated fluorescent signals triggered by a variety of light stimuli, e.g., 50–400 μm diameter spots of light on a dark background (Fig. 1B). The reproducibility and large amplitude of GCaMP6f-mediated responses measured via multiphoton excitation microscopy—regularly >100% increases in fluorescence over background (ΔF/F)—facilitated identification of RGCs that responded at light onset (On), offset (Off), and onset and offset (On-Off; Fig. 1B1). In addition to identifying the absolute and relative location of RGCs with specific functional properties (Fig. 1B2), this approach enabled a robust measure of the fraction of SC-projecting RGCs in these (and other) functional classes—a measurement that has been difficult, if not impossible, to make to date. We found, for example, that ∼1/3, ∼1/4, and ∼1/4 of SC-projecting RGCs exhibited On, Off, and On-Off characteristics, respectively [Fig. 1B3; ∼15% exhibited no responses (NR)].
Stimulus-evoked changes in GCaMP6f fluorescence also facilitated identification of RGCs that responded preferentially to a 100-μm-thick, 200 μm long bar moving in a particular direction, i.e., DS RGCs (for review, see Vaney et al., 2012). We found, as expected, that a substantial fraction of SC-projecting On-Off RGCs exhibited much greater responses to a spot moving 400 μm/s in one (“preferred”) direction relative to the same spot moving in the opposite (“null”) direction (Fig. 1C). The preferred directions of On-Off cells in a given piece of retina were approximately equally distributed between one of four directions (separated by ∼90°; Fig. 1C2, black vectors).
To our surprise, we also found SC-projecting On DS RGCs (Fig. 1C2,C3); this result was unexpected because On DS RGCs are thought to target retinorecipient nuclei in the accessory optic system exclusively (Simpson et al., 1979; Oyster et al., 1980; Buhl and Peichl, 1986; Yonehara et al., 2008; Dhande et al., 2013).
One possibility is that the retrogradely labeled On DS RGCs are simply those that innervate retinorecipient nuclei lying rostral and ventral to the SC, e.g., the nucleus of the optic tract (NOT) and/or dorsal terminal nucleus (DTN). We think this is unlikely for several reasons. First, all injections were targeted to the caudal, medial half of the SC to avoid retrogradely labeling RGCs innervating nuclei that lie rostral, ventral, and lateral to the SC. Second, while On DS RGCs innervating the NOT/DTN are thought to prefer motion in one (Simpson, 1984) or potentially two directions (Kay et al., 2011; Dhande et al., 2013), On DS RGCs retrogradely labeled from the SC were tuned to at least three preferred directions (Fig. 1C2). Third, RGCs expressing GFP in the Hoxd10:GFP transgenic mouse densely innervate the NOT/DTN but not the SC (Dhande et al., 2013); more importantly, GFP-positive On-Off RGCs, but not GFP-positive On RGCs, are retrogradely labeled from the SC in this transgenic mouse (Dhande et al., 2013).
What other factors could influence/bias the results shown in Figure 1? We know that Ca2+-sensitive fluorophores like GCaMP6f provide an indirect, filtered measure of neural activity; moreover, the 910 nm laser light used to excite GCaMP6f could alter the response of RGCs to visual stimuli. We, therefore, examined the relationship between electrophysiological and optical measurements of neural activity in a number of RGCs. Figure 2A shows the response of a single GCaMP6f-expressing On-Off DS RGC to a small spot moving in one of eight different directions through the cell's receptive field center. The extremely strong correlation between electrophysiological and optical signals recorded simultaneously from this cell (Fig. 2, compare A1, A2), and the marginal difference between electrophysiological signals recorded in the presence and absence of scanned laser light (Fig. 2, compare A2, A3), supports two conclusions: (1) optical signals faithfully represent the electrical activity of RGCs and (2) the electrical activity of DS RGCs is not fundamentally altered by scanned laser light. Separate experiments indicated that the electrophysiological responses of GCaMP-negative (Fig. 2B1) and GCaMP-positive (Fig. 2B2) Off transient alpha-like RGCs (Pang et al., 2003; Murphy and Rieke, 2006; Margolis and Detwiler, 2007) did not differ substantially.
Figure 2.
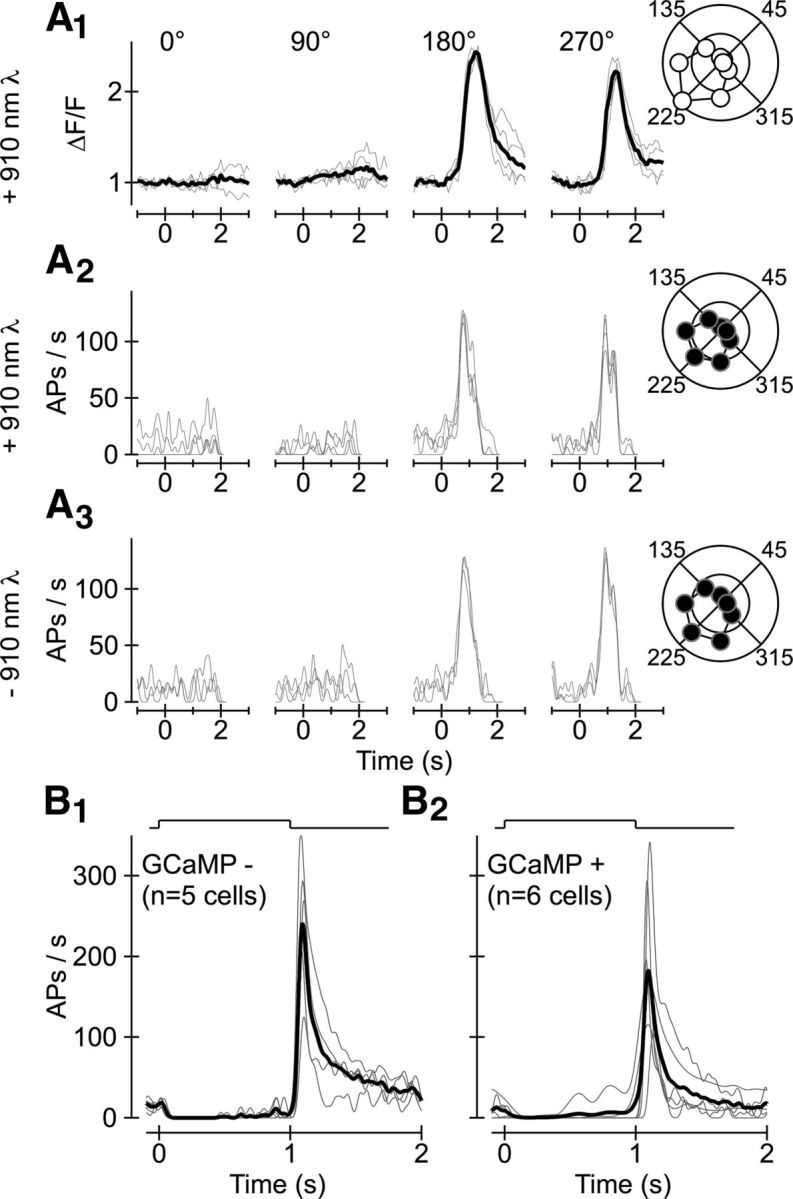
GCaMP6f-mediated optical signals faithfully represent light-evoked electrical activity. A1, Change in fluorescence over background fluorescence (ΔF/F) triggered in a representative On-Off RGC by a small stimulus moving in several different directions. Responses on individual trials are shown in thin gray lines; mean response is superimposed in the thick black line. Polar plot representation shows the relative response as a function of all eight directions of motion presented. A2, Electrophysiological activity—APs per second—from same cell/epochs as in A1. A3, APs per second elicited in the same cell (and by the same stimuli) as in A1 and A2 but in the absence of scanned laser (910 nm) light. B, Responses elicited by a stationary (100–200 μm diameter) stimulus in Off transient alpha RGCs that do (B2) and do not (B1) express GCaMP6f.
Biases in AAV-mediated expression of GCaMP6f to some but not other RGCs represent another potential caveat to the results of our optical recordings. We, therefore, assayed stimulus-evoked activity from SC-projecting RGCs in a way that required neither viral expression nor multiphoton excitation of GCaMP6f. In particular, we performed cell-attached (loose seal) electrophysiological recordings from RGCs labeled following stereotaxic injection of fluorescent dialkylcarbocyanine dyes (like DiI), cholera toxin, or beads (Fig. 3A). Control experiments indicated that beads and virus labeled highly overlapping populations of RGCs. In particular, in an animal in which both GCaMP6f and beads were injected into the SC, ∼80% of the ∼1200 retrogradely labeled RGCs expressed GCaMP6f; a similar percentage of the same ∼1200 RGCs was labeled with beads. Importantly, the percentage of the RGCs exhibiting GCaMP6f and beads (60%) was nearly identical to that expected if RGCs incorporated beads and virus with equal probability (64%).
Figure 3.
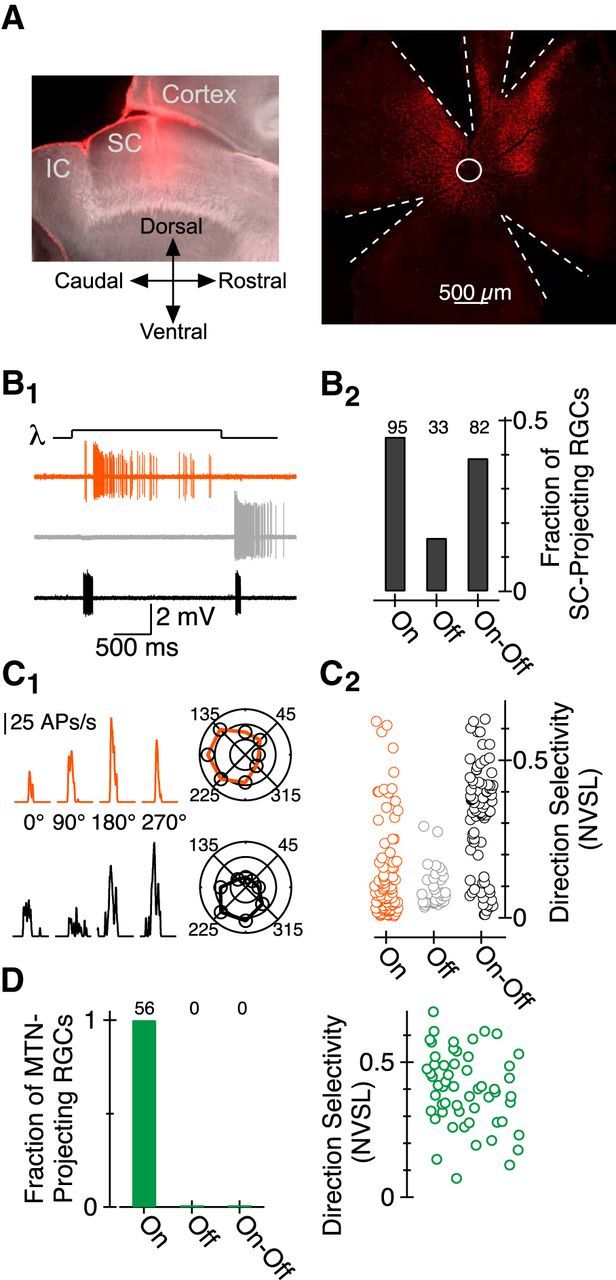
Characterization of SC-projecting RGC responses to light stimuli via cell-attached electrophysiological recordings. A, Left, Sagittal sections from the right hemisphere of a mouse brain in which red retro Fluor beads were injected +0.7 mm lateral from the midline and directly ventral to lambda. Right, Image of RGCs labeled following stereotaxic injection of red beads into the SC. White circle indicates location of optic nerve head; dashed white lines show location of strain-reducing radial cuts. B1, Current as a function of time in three representative SC-projecting RGCs. B2, Fraction of SC-projecting RGCs exhibiting On, Off, and On-Off responses. C1, Firing rate (APs per second) as a function of time for small (100–200 μm) diameter stimulus moving in one of four directions; the top/bottom data are from a representative On/On-Off RGC, respectively. Polar plot representation of peak firing rate as a function of the direction of object motion for each cell is shown on the right. C2, NVSL for electrophysiological responses elicited by eight different directions of motion in each On, Off, and On-Off RGC; data in this panel were obtained from the retinae of 24 mice. D, Same as B2 and C2 for MTN-projecting RGCs; data were obtained from the retinae of 17 mice. IC, inferior colliculus.
Electrophysiological measurements, like responses assayed via Ca2+ imaging, indicated that more On than Off or On-Off RGCs innervate the SC (Fig. 3B). Moreover, On and On-Off (but few, if any, Off) SC-projecting RGCs exhibited robust DS responses to a 100 μm or 200 μm spot moving in one of eight directions at 300 μm/s (Fig. 3C). Indeed, >20% and >75% of SC-projecting On and On-Off RGCs, respectively, exhibited NVSL values >0.2 (Fig. 3C2); collectively, nearly 40% of SC-projecting RGCs assayed electrophysiologically exhibited direction selectivity. These results (1) provide a simple, robust functional characterization of the population of RGCs projecting to the SC; (2) identify input to the SC from a class of RGC thought to target the accessory optic system exclusively; and (3) demonstrate greater than expected diversity in the areas to which On DS RGCs convey information.
Separate RGCs project to the SC and MTN
On DS RGCs provide the sole source of input to the MTN (Fig. 3D; Yonehara et al., 2009), one of three nuclei that comprise the accessory optic system. Do the same or different On DS RGCs provide input to the SC and MTN? One possibility is that On DS RGCs projecting to the MTN send an axon collateral to the SC. Experiments performed in rabbit, however, suggest that separate RGCs project to the SC and MTN (Buhl and Peichl, 1986). To distinguish between these possibilities we injected beads conjugated to rhodamine into the SC and beads conjugated to fluorescein into the MTN. We found that the density of RGCs retrogradely labeled from the SC was nearly 10 times greater than that of RGCs retrogradely labeled from the MTN. Moreover, as in the rabbit (Buhl and Peichl, 1986), individual RGCs were never retrogradely labeled from both the SC and MTN (Fig. 4A). These data, and the observation that MTN-projecting RGCs labeled in transgenic mice do not project to the SC (Yonehara et al., 2008; Dhande et al., 2013), indicate that entirely separate populations of RGCs project to the SC and MTN. This result, and identification of SC-projecting On DS RGCs, suggests that individual On DS RGCs project to the SC or MTN but not both.
Figure 4.

Nonoverlapping populations of RGCs project to the SC and MTN. A, Top, Retina from an animal in which beads conjugated to rhodamine and fluorescein were injected into the SC and MTN, respectively. The number of cells labeled by red, green, and red and green beads is shown below. B, XY and XZ projections of morphological reconstructions of representative MTN-projecting and SC-projecting On DS RGCs and SC-projecting On-Off DS RGCs. Scale bar, 50 μm. C, Dendritic asymmetry, area, length, and percentage volume in the Off sublamina of the inner plexiform layer for three classes of DS RGCs (n = 7, 5, and 3 cells reconstructed, respectively).
Several reports have described two distinct types of On DS RGCs in rabbit retina (Kanjhan and Sivyer, 2010; Hoshi et al., 2011). In these and other cases (Kay et al., 2011; Rivlin-Etzion et al., 2011; Dhande et al., 2013), it remains unclear whether diversity in the morphological or physiological properties of a class of RGCs relate directly to the downstream area to which individual RGCs project. We found that the On DS RGCs retrogradely labeled from the SC exhibited qualitatively different somatodendritic morphological characteristics from their counterparts retrogradely labeled from the MTN. In particular, the dendrites of SC-projecting On DS RGCs covered a smaller area and were more concentrically organized about the soma than the dendrites of their MTN-projecting counterparts (Fig. 4B,C). Thus, distinct populations of RGCs project to the SC and MTN, and SC-projecting and MTN-projecting On DS RGCs exhibit distinct morphologies. Data presented in the next section show that SC-projecting and MTN-projecting On DS RGCs exhibit substantial functional differences as well.
On DS RGCs exhibit projection-specific functional properties
The retina should not unnecessarily encode the same information in two separate RGCs given the limited number of axons available to convey information to the brain. We hypothesized, therefore, that SC-projecting and MTN-projecting On DS RGCs might exhibit distinct responses to the same cue and/or respond to distinct features of light stimuli.
We found that the degree of direction selectivity, and the directions to which RGCs responded preferentially, were similar in SC-projecting and MTN-projecting On DS RGCs (data not shown). On the other hand, the appearance of a (stationary) 100–200 μm diameter spot of light elicited higher peak firing rates and more transient responses in SC-projecting On DS RGCs (Fig. 5A). Moreover, moving the same spot (in the cell's preferred direction) at a variety of different velocities revealed differences in the speeds to which SC-projecting and MTN-projecting On DS RGCs responded best—the velocity that triggered a neuron's peak response, and the range of velocities triggering non-negligible activity, was higher in SC-projecting On DS RGCs (Fig. 5B). Overall, the dynamics and velocity tuning of SC-projecting On DS cells occupied an intermediate zone between that of MTN-projecting On DS RGCs and SC-projecting On-Off DS RGCs.
Figure 5.
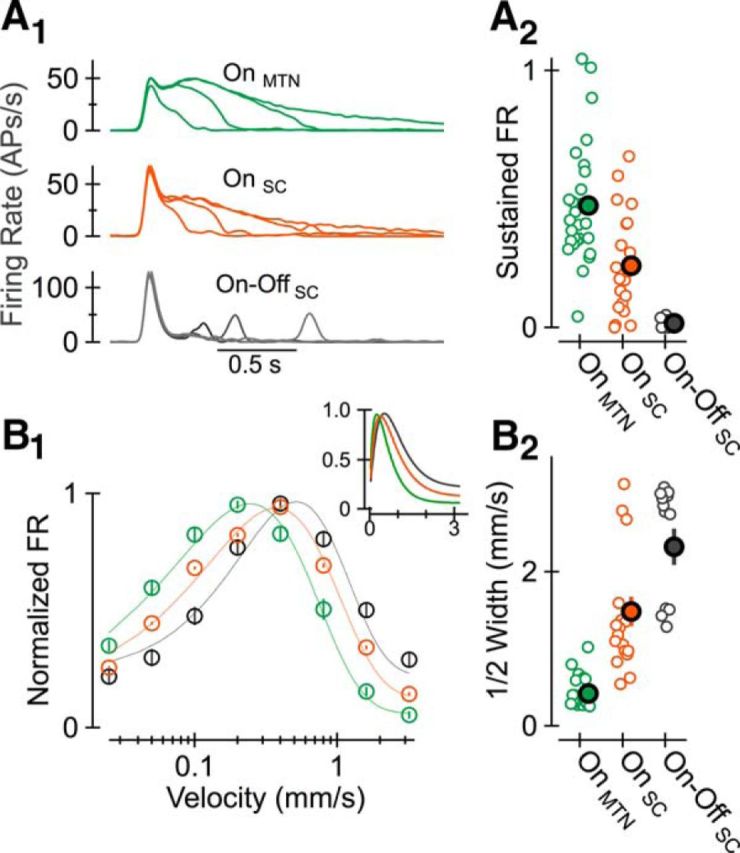
Projection-specific differences in the output of On DS RGCs. A1, Across-cell average of AP responses elicited by a stationary spot presented for four different stimulus durations in MTN-projecting and SC-projecting On DS RGCs and SC-projecting On-Off DS RGCs. A2, Ratio of steady state to peak firing rate for each RGC contributing to averages in A1. B1, Normalized firing rate as a function of stimulus speed (in the preferred direction). Inset shows the same data with a linear, rather than log-based, x-axis. B2, Speed tuning—width at half-max—for each RGC contributing to the average shown in B1. Data from each cell, and populations of like cells, were fit with a gamma function (Nover et al., 2005).
Cellular and synaptic mechanisms contribute to projection-specific functional properties of On DS RGCs
Projection-specific differences in the dynamics and/or selectivity of neuronal responses to light (or any other sensory) stimuli must reflect differences in the intrinsic biophysical properties of neurons and/or the patterns of synaptic input they receive.
To assay the intrinsic biophysical characteristics of On DS RGCs we performed whole-cell current-clamp recordings with a K+-based internal solution. We found no consistent or significant differences in the resting membrane potential or input resistance of SC-projecting and MTN-projecting On DS RGCs; there were, however, substantial differences in several other characteristics of the cells' excitability. For example, more current was necessary to trigger action potentials (APs) in SC-projecting On DS RGCs (Fig. 6A1,B). Moreover, the instantaneous firing rate (1/interspike interval) in SC-projecting On DS RGCs started at higher values and rapidly decreased to small values in response to perithreshold current steps (Fig. 6A2, right); suprathreshold current injection in MTN-projecting On DS RGCs, in comparison, generally elicited and maintained a given instantaneous firing rate (Fig. 6A2, left; B, inset). The distinct responses of these cells to somatic current injection indicates that morphological, biophysical, and likely other cellular properties differ between SC-projecting and MTN-projecting On DS RGCs; the same data also raise the possibility that projection-specific differences in light-evoked activity (Fig. 5) might reflect, at least in part, differences in the cells' intrinsic properties.
Figure 6.

Intrinsic biophysical characteristics of SC-projecting and MTN-projecting On DS RGCs. A1, Responses of a representative MTN-projecting (left) and SC-projecting (right) On DS RGC to hyperpolarizing and depolarizing current steps. A2, Instantaneous firing rate (1 interspike interval) elicited by several current steps delivered to the two RGCs shown in A. B, Mean firing rate as a function of current step amplitude for each MTN-projecting and SC-projecting On DS RGC. Mean firing rate was calculated over the course of the 2 s current step. Inset, Coefficient of variation for the distribution of interspike intervals in MTN-projecting (black diamonds) and SC-projecting (gray diamonds) On DS RGCs; AP generation in SC-projecting RGCs exhibited higher interspike interval values over a broad range of current step amplitudes.
Projection-specific differences in intrinsic excitability do not preclude the possibility that differences in the cells' outputs could largely reflect differences in the synaptic input they receive. We therefore assayed light-evoked excitatory and inhibitory synaptic input via whole-cell voltage-clamp recordings using a Cs+-based internal solution. These experiments revealed that differences in the time course of SC-projecting and MTN-projecting On DS RGC responses to a 200 μm diameter spot (Fig. 5A) are not likely a function of inhibitory synaptic input. The kinetics of the peak-normalized light-evoked IPSCs were similar in SC-projecting and MTN-projecting On DS RGCs (Fig. 7A1, top traces), and projection-specific differences in the absolute amplitude of the IPSCs (Fig. 7A1, inset) were opposite of what would be expected if inhibitory synaptic input played a critical role. Instead, the more sustained responses of MTN-projecting On DS RGCs to a small, stationary spot of light likely reflects the slower time course with which light-evoked excitatory synaptic input to these cells decays. Indeed, on average, EPSCs diminished to 30% of their peak value in <0.3 s in SC-projecting On DS RGCs while the light-evoked EPSC in MTN-projecting On DS RGCs persisted at that level for >0.9 s (Fig. 7A2).
Figure 7.
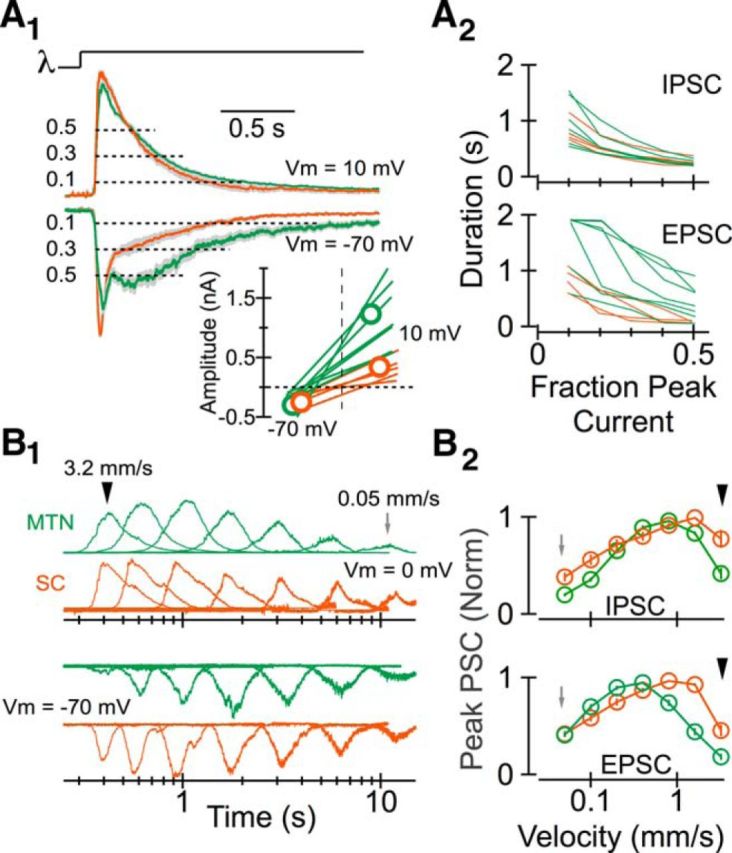
Projection-specific differences in the synaptic input to On DS RGCs. A1, Mean peak-normalized inhibitory (top) and excitatory (bottom) postsynaptic currents elicited in MTN-projecting (green) and SC-projecting (orange) On DS RGCs by a spatially uniform stimulus 2 s in duration. EPSCs were measured at the reversal potential for Cl− (approximately −70 mV); IPSCs were measured at the reversal potential for mixed cation currents (through AMPA/NMDA receptors, for example; between 0 and 10 mV). The inset below shows the absolute peak amplitude of EPSCs and IPSCs in each cell contributing to the peak-normalized average above. A2, Duration of postsynaptic currents in each cell contributing to the averages shown in A1. Duration was calculated as the time the current was >10%, 20%, 30%, 40%, or 50% of the normalized peak amplitude. B1, Peak-normalized postsynaptic currents elicited by a stimulus moving at a variety of different speeds (in the preferred direction) from a representative MTN-projecting (green) and SC-projecting (orange) On DS RGC. Data are shown on a log timescale. B2, Peak-normalized postsynaptic current amplitude as a function of motion velocity.
How might differences in synaptic input underlie robust projection-specific differences in the response of On DS RGCs to stimuli moving quickly in the cell's preferred direction (Fig. 5B)? We reasoned that rapidly moving stimuli could elicit (1) less inhibitory synaptic input and/or (2) more excitatory input in SC-projecting On DS RGCs. Characterization of the relationship between stimulus velocity (of a spot moving in a cell's preferred direction) and IPSC amplitude was inconsistent with the first hypothesis. In particular, the peak amplitude of light-evoked IPSCs increased and then decreased as a function of the velocity with which a small spot moved in both MTN-projecting and SC-projecting On DS RGCs (Fig. 7B1,B2, top). The amplitude of light-evoked IPSCs in MTN-projecting cells exhibited a larger relative decrease at high velocities, the opposite of what would be expected if this postsynaptic conductance was responsible for these cells' weaker responses to quickly moving stimuli.
The relationship between the output of SC-projecting and MTN-projecting On DS RGC and the light-evoked excitatory input they received was, in comparison, substantially stronger: in particular, excitatory input to SC-projecting On DS RGCs was greater than that to their MTN-projecting counterparts at high stimulus velocities (Fig. 7B1,B2, bottom). These results indicate that the synaptic input to a given class of RGC can vary as a function of the retinorecipient area to which the individual RGCs comprising that class project. Moreover, they suggest that several differences in the output of SC-projecting and MTN-projecting On DS RGCs may be a function of differences in the excitatory input these RGCs receive.
Discussion
How is the information encoded by neurons in a given area of the CNS distributed to and decoded by downstream neurons? The approach and results described here represent an important step toward answering this fundamental question in the early visual system. In particular, we identify retinorecipient areas to which information about the direction of motion is conveyed and the degree to which that information differs between target regions.
The mammalian retina conveys information about visual cues to ≫10 downstream areas. Anatomical evidence indicates that even major retinorecipient areas in the mammal—the SC and dorsolateral geniculate nucleus—receive input from only a subset of the ∼20 classes of RGCs (Berson, 2008). Thus, while recent optical and electrical techniques (Segev et al., 2004; Frechette et al., 2005; Briggman and Euler, 2011) enable simultaneous measurement of activity in hundreds of RGCs, decoding schemes based on responses of all these neurons likely overestimate the information to which a given downstream area has access. The approach we and others (Sato and Svoboda, 2010; Yamashita et al., 2013; Vélez-Fort et al., 2014) have used to characterize the response properties of neurons retrogradely labeled from one or more downstream areas, and optical approaches characterizing responses in axons projecting to a given area of the nervous system (Nikolaou et al., 2012; Glickfeld et al., 2013), enable one to circumvent this confound.
Systematic characterization of RGCs retrogradely labeled from the SC revealed several surprises. First, we identified input to the SC from a type of RGC widely thought to target other retinorecipient areas exclusively, i.e., On DS RGCs (see, however, Semm, 1978; Vaney et al., 1981). Why might these (and potentially other) cells' projections to the SC have been overlooked? The functional properties of RGCs projecting to a given downstream region have often been inferred from the somatodendritic morphology of retrogradely labeled RGCs in the absence of direct physiological characterization (Perry and Cowey, 1984; Perry et al., 1984). Under these circumstances it would be easy to conclude that SC-projecting and MTN-projecting On DS RGCs represent different classes of RGCs (sensitive to largely distinct features of visual stimuli) given the differences in their somatodendritic morphology (Fig. 4). The opposite form of misattribution could also contribute, e.g., cells exhibiting only subtle morphological differences might, in fact, exhibit dramatic functional differences and project to different downstream areas.
A second surprise was that On DS RGCs exhibited substantially larger projection-specific differences than those described for On-Off DS RGCs (Kay et al., 2011; Rivlin-Etzion et al., 2011; Dhande et al., 2013); we suspect that these differences reflect, in part, the means used to distinguish RGCs. In particular, whereas retrograde labeling unambiguously identified entirely separate populations of On DS RGCs targeting the SC and MTN, it remains unclear whether On-Off RGCs labeled in separate lines of transgenic mice are drawn, at least in part, from the same underlying population of RGCs. A third surprise was that few if any of the SC-projecting Off RGCs exhibited robust direction selectivity (Kim et al., 2008). Differences in the stimuli and metrics used to characterize direction selectivity, or inefficient labeling of JamB-CreR RGCs (relative to other RGCs) by AAVs, beads, and cholera toxin, could explain this difference. Likewise, differences in the labeling of RGCs via AAVs and retrogradely transported fluorescent compounds could contribute to differences in the fraction of SC-projecting Off and On-Off RGCs assayed via optical and electrophysiological recordings.
In vitro experiments have identified cellular and/or synaptic differences between CNS neurons that project to different downstream targets (Gerfen et al., 1990; Markram et al., 1998; Reyes et al., 1998; Hattox and Nelson, 2007; Brown and Hestrin, 2009; Graves et al., 2012) without knowing whether those neurons carry identical, overlapping, or distinct information in vivo. We identified target-specific functional properties of projection neurons and, critically, mechanisms that contribute to those functional differences. The most parsimonious interpretation of these results is that the mechanisms governing direction selectivity (for review, see Vaney et al., 2012; see also Park et al., 2014) and velocity tuning are distinct: SC-projecting On-Off and On DS RGCs, and MTN-projecting On DS RGCs, exhibit similar degrees of direction selectivity but distinct velocity tuning. Moreover, our results suggest that differences in the velocity tuning of SC-projecting and MTN-projecting On DS RGCs reflect some combination of differences in the cells' intrinsic properties and/or the excitatory synaptic input they receive.
What is the purpose of having On DS RGCs project to the SC? An intriguing possibility is that input from these RGCs enables the SC to subserve a broader range of visually guided behaviors than it could otherwise. The SC plays a critical role in the execution of fast, ballistic movements of the head and/or eyes (for review, see Wurtz and Albano, 1980; Sparks and Mays, 1990) while the MTN is one of several nuclei that helps move the eyes slowly and smoothly given image motion on the retina (Simpson, 1984). Increasing evidence, however, suggests a broader role for the SC, e.g., in smooth pursuit of slowly moving targets (for review, see Krauzlis, 2004) and attending to (for review, see Krauzlis et al., 2013) and/or evaluating the salience of visual cues (Mysore et al., 2010). Having SC-projecting On DS RGCs tuned to a broader range of stimulus velocities than their MTN-projecting counterparts, and able to sustain action potential generation better than SC-projecting On-Off DS RGCs, increases the information that the SC can use to evaluate, select, and/or track moving visual stimuli. Whatever the reason, SC-projecting On DS RGCs likely serve an important and beneficial role given the resources required to distinguish these cells morphologically and functionally from those targeting the accessory optic system.
Footnotes
All financial support for this research was provided by the Howard Hughes Medical Institute. We thank Sarah Lindo, Yasmin Bholat, and Kendra Morris for assistance with stereotaxic injections; Mark Cafaro, Frank Midgley, and Barry Wark for help developing data acquisition software; and Calin Culianu and Anthony Leonardo for sharing and modifying software used to control visual stimuli. We are grateful to Vivek Jayaraman, Josh Dudman, Fred Rieke, Greg Horwitz, Shaul Hestrin, Bob Wurtz, and Rachel Wilson for comments on this manuscript.
The authors declare no competing financial interests.
References
- Amthor FR, Takahashi ES, Oyster CW. Morphologies of rabbit retinal ganglion cells with concentric receptive fields. J Comp Neurol. 1989;280:72–96. doi: 10.1002/cne.902800107. [DOI] [PubMed] [Google Scholar]
- Barlow HB, Hill RM. Selective sensitivity to direction of motion in ganglion cells of the rabbit retina. Science. 1963;139:412–414. doi: 10.1126/science.139.3553.412. [DOI] [PubMed] [Google Scholar]
- Barlow HB, Hill RM, Levick WR. Retinal ganglion cells responding selectively to direction and speed of image motion in the rabbit. J Physiol. 1964;173:377–407. doi: 10.1113/jphysiol.1964.sp007463. [DOI] [PMC free article] [PubMed] [Google Scholar]
- Berson DM. Retinal ganglion cell types and their central projections. In: Basbaum AI, Kaneko A, Shepherd GM, Westheimer G, editors. The senses: a comprehensive reference. San Diego, CA: Academic; 2008. pp. 491–520. [Google Scholar]
- Borghuis BG, Tian L, Xu Y, Nikonov SS, Vardi N, Zemelman BV, Looger LL. Imaging light responses of targeted neuron populations in the rodent retina. J Neurosci. 2011;31:2855–2867. doi: 10.1523/JNEUROSCI.6064-10.2011. [DOI] [PMC free article] [PubMed] [Google Scholar]
- Briggman KL, Euler T. Bulk electroporation and population calcium imaging in the adult mammalian retina. J Neurophysiol. 2011;105:2601–2609. doi: 10.1152/jn.00722.2010. [DOI] [PubMed] [Google Scholar]
- Briggman KL, Helmstaedter M, Denk W. Wiring specificity in the direction-selectivity circuit of the retina. Nature. 2011;471:183–188. doi: 10.1038/nature09818. [DOI] [PubMed] [Google Scholar]
- Brown SP, Hestrin S. Intracortical circuits of pyramidal neurons reflect their long-range axonal targets. Nature. 2009;457:1133–1136. doi: 10.1038/nature07658. [DOI] [PMC free article] [PubMed] [Google Scholar]
- Buhl EH, Peichl L. Morphology of rabbit retinal ganglion cells projecting to the medial terminal nucleus of the accessory optic system. J Comp Neurol. 1986;253:163–174. doi: 10.1002/cne.902530204. [DOI] [PubMed] [Google Scholar]
- Chen TW, Wardill TJ, Sun Y, Pulver SR, Renninger SL, Baohan A, Schreiter ER, Kerr RA, Orger MB, Jayaraman V, Looger LL, Svoboda K, Kim DS. Ultrasensitive fluorescent proteins for imaging neuronal activity. Nature. 2013;499:295–300. doi: 10.1038/nature12354. [DOI] [PMC free article] [PubMed] [Google Scholar]
- Dhande OS, Huberman AD. Retinal ganglion cell maps in the brain: implications for visual processing. Curr Opin Neurobiol. 2014;24:133–142. doi: 10.1016/j.conb.2013.08.006. [DOI] [PMC free article] [PubMed] [Google Scholar]
- Dhande OS, Estevez ME, Quattrochi LE, El-Danaf RN, Nguyen PL, Berson DM, Huberman AD. Genetic dissection of retinal inputs to brainstem nuclei controlling image stabilization. J Neurosci. 2013;33:17797–17813. doi: 10.1523/JNEUROSCI.2778-13.2013. [DOI] [PMC free article] [PubMed] [Google Scholar]
- Dumitriu D, Rodriguez A, Morrison JH. High-throughput, detailed, cell-specific neuroanatomy of dendritic spines using microinjection and confocal microscopy. Nat Protoc. 2011;6:1391–1411. doi: 10.1038/nprot.2011.389. [DOI] [PMC free article] [PubMed] [Google Scholar]
- Euler T, Hausselt SE, Margolis DJ, Breuninger T, Castell X, Detwiler PB, Denk W. Eyecup scope–optical recordings of light stimulus-evoked fluorescence signals in the retina. Pflugers Arch. 2009;457:1393–1414. doi: 10.1007/s00424-008-0603-5. [DOI] [PMC free article] [PubMed] [Google Scholar]
- Frechette ES, Sher A, Grivich MI, Petrusca D, Litke AM, Chichilnisky EJ. Fidelity of the ensemble code for visual motion in primate retina. J Neurophysiol. 2005;94:119–135. doi: 10.1152/jn.01175.2004. [DOI] [PubMed] [Google Scholar]
- Gerfen CR, Engber TM, Mahan LC, Susel Z, Chase TN, Monsma FJ, Sibley DR. D1 and D2 dopamine receptor-regulated gene expression of striatonigral and striatopallidal neurons. Science. 1990;250:1429–1432. doi: 10.1126/science.2147780. [DOI] [PubMed] [Google Scholar]
- Glickfeld LL, Andermann ML, Bonin V, Reid RC. Cortico-cortical projections in mouse visual cortex are functionally target specific. Nat Neurosci. 2013;16:219–226. doi: 10.1038/nn.3300. [DOI] [PMC free article] [PubMed] [Google Scholar]
- Graves AR, Moore SJ, Bloss EB, Mensh BD, Kath WL, Spruston N. Hippocampal pyramidal neurons comprise two distinct cell types that are countermodulated by metabotropic receptors. Neuron. 2012;76:776–789. doi: 10.1016/j.neuron.2012.09.036. [DOI] [PMC free article] [PubMed] [Google Scholar]
- Hattox AM, Nelson SB. Layer V neurons in mouse cortex projecting to different targets have distinct physiological properties. J Neurophysiol. 2007;98:3330–3340. doi: 10.1152/jn.00397.2007. [DOI] [PubMed] [Google Scholar]
- Hoshi H, Tian LM, Massey SC, Mills SL. Two distinct types of ON directionally selective ganglion cells in the rabbit retina. J Comp Neurol. 2011;519:2509–2521. doi: 10.1002/cne.22678. [DOI] [PMC free article] [PubMed] [Google Scholar]
- Kanjhan R, Sivyer B. Two types of ON direction-selective ganglion cells in rabbit retina. Neurosci Lett. 2010;483:105–109. doi: 10.1016/j.neulet.2010.07.071. [DOI] [PubMed] [Google Scholar]
- Kay JN, De la Huerta I, Kim IJ, Zhang Y, Yamagata M, Chu MW, Meister M, Sanes JR. Retinal ganglion cells with distinct directional preferences differ in molecular identity, structure, and central projections. J Neurosci. 2011;31:7753–7762. doi: 10.1523/JNEUROSCI.0907-11.2011. [DOI] [PMC free article] [PubMed] [Google Scholar]
- Kim IJ, Zhang Y, Yamagata M, Meister M, Sanes JR. Molecular identification of a retinal cell type that responds to upward motion. Nature. 2008;452:478–482. doi: 10.1038/nature06739. [DOI] [PubMed] [Google Scholar]
- Krauzlis RJ. Recasting the smooth pursuit eye movement system. J Neurophysiol. 2004;91:591–603. doi: 10.1152/jn.00801.2003. [DOI] [PubMed] [Google Scholar]
- Krauzlis RJ, Lovejoy LP, Zénon A. Superior colliculus and visual spatial attention. Annu Rev Neurosci. 2013;36:165–182. doi: 10.1146/annurev-neuro-062012-170249. [DOI] [PMC free article] [PubMed] [Google Scholar]
- Margolis DJ, Detwiler PB. Different mechanisms generate maintained activity in ON and OFF retinal ganglion cells. J Neurosci. 2007;27:5994–6005. doi: 10.1523/JNEUROSCI.0130-07.2007. [DOI] [PMC free article] [PubMed] [Google Scholar]
- Markram H, Wang Y, Tsodyks M. Differential signaling via the same axon of neocortical pyramidal neurons. Proc Natl Acad Sci U S A. 1998;95:5323–5328. doi: 10.1073/pnas.95.9.5323. [DOI] [PMC free article] [PubMed] [Google Scholar]
- Murphy GJ, Rieke F. Network variability limits stimulus-evoked spike timing precision in retinal ganglion cells. Neuron. 2006;52:511–524. doi: 10.1016/j.neuron.2006.09.014. [DOI] [PMC free article] [PubMed] [Google Scholar]
- Mysore SP, Asadollahi A, Knudsen EI. Global inhibition and stimulus competition in the owl optic tectum. J Neurosci. 2010;30:1727–1738. doi: 10.1523/JNEUROSCI.3740-09.2010. [DOI] [PMC free article] [PubMed] [Google Scholar]
- Nikolaou N, Lowe AS, Walker AS, Abbas F, Hunter PR, Thompson ID, Meyer MP. Parametric functional maps of visual inputs to the tectum. Neuron. 2012;76:317–324. doi: 10.1016/j.neuron.2012.08.040. [DOI] [PMC free article] [PubMed] [Google Scholar]
- Nover H, Anderson CH, DeAngelis GC. A logarithmic, scale-invariant representation of speed in macaque middle temporal area accounts for speed discrimination performance. J Neurosci. 2005;25:10049–10060. doi: 10.1523/JNEUROSCI.1661-05.2005. [DOI] [PMC free article] [PubMed] [Google Scholar]
- Oyster CW. The analysis of image motion by the rabbit retina. J Physiol. 1968;199:613–635. doi: 10.1113/jphysiol.1968.sp008671. [DOI] [PMC free article] [PubMed] [Google Scholar]
- Oyster CW, Barlow HB. Direction-selective units in rabbit retina: distribution of preferred directions. Science. 1967;155:841–842. doi: 10.1126/science.155.3764.841. [DOI] [PubMed] [Google Scholar]
- Oyster CW, Simpson JI, Takahashi ES, Soodak RE. Retinal ganglion cells projecting to the rabbit accessory optic system. J Comp Neurol. 1980;190:49–61. doi: 10.1002/cne.901900105. [DOI] [PubMed] [Google Scholar]
- Pang JJ, Gao F, Wu SM. Light-evoked excitatory and inhibitory synaptic inputs to ON and OFF alpha ganglion cells in the mouse retina. J Neurosci. 2003;23:6063–6073. doi: 10.1523/JNEUROSCI.23-14-06063.2003. [DOI] [PMC free article] [PubMed] [Google Scholar]
- Park SJ, Kim IJ, Looger LL, Demb JB, Borghuis BG. Excitatory synaptic inputs to mouse on-off direction-selective retinal ganglion cells lack direction tuning. J Neurosci. 2014;34:3976–3981. doi: 10.1523/JNEUROSCI.5017-13.2014. [DOI] [PMC free article] [PubMed] [Google Scholar]
- Perry VH, Cowey A. Retinal ganglion cells that project to the superior colliculus and pretectum in the macaque monkey. Neuroscience. 1984;12:1125–1137. doi: 10.1016/0306-4522(84)90007-1. [DOI] [PubMed] [Google Scholar]
- Perry VH, Oehler R, Cowey A. Retinal ganglion cells that project to the dorsal lateral geniculate in the macaque monkey. Neuroscience. 1984;12:1101–1123. doi: 10.1016/0306-4522(84)90006-X. [DOI] [PubMed] [Google Scholar]
- Reyes A, Lujan R, Rozov A, Burnashev N, Somogyi P, Sakmann B. Target-cell-specific facilitation and depression in neocortical circuits. Nat Neurosci. 1998;1:279–285. doi: 10.1038/1092. [DOI] [PubMed] [Google Scholar]
- Rivlin-Etzion M, Zhou K, Wei W, Elstrott J, Nguyen PL, Barres BA, Huberman AD, Feller MB. Transgenic mice reveal unexpected diversity of on-off direction-selective retinal ganglion cell subtypes and brain structures involved in motion processing. J Neurosci. 2011;31:8760–8769. doi: 10.1523/JNEUROSCI.0564-11.2011. [DOI] [PMC free article] [PubMed] [Google Scholar]
- Sato TR, Svoboda K. The functional properties of barrel cortex neurons projecting to the primary motor cortex. J Neurosci. 2010;30:4256–4260. doi: 10.1523/JNEUROSCI.3774-09.2010. [DOI] [PMC free article] [PubMed] [Google Scholar]
- Segev R, Goodhouse J, Puchalla J, Berry MJ., 2nd Recording spikes from a large fraction of the ganglion cells in a retinal patch. Nat Neurosci. 2004;7:1154–1161. doi: 10.1038/nn1323. [DOI] [PubMed] [Google Scholar]
- Semm P. Antidromically activated direction selective ganglion cells of the rabbit. Neurosci Lett. 1978;9:207–211. doi: 10.1016/0304-3940(78)90073-3. [DOI] [PubMed] [Google Scholar]
- Simpson JI. The accessory optic system. Annu Rev Neurosci. 1984;7:13–41. doi: 10.1146/annurev.ne.07.030184.000305. [DOI] [PubMed] [Google Scholar]
- Simpson JI, Soodak RE, Hess R. The accessory optic system and its relation to the vestibulocerebellum. Prog Brain Res. 1979;50:715–724. doi: 10.1016/S0079-6123(08)60868-7. [DOI] [PubMed] [Google Scholar]
- Sparks DL, Mays LE. Signal transformations required for the generation of saccadic eye movements. Annu Rev Neurosci. 1990;13:309–336. doi: 10.1146/annurev.ne.13.030190.001521. [DOI] [PubMed] [Google Scholar]
- Svoboda K, Yasuda R. Principles of two-photon excitation microscopy and its applications to neuroscience. Neuron. 2006;50:823–839. doi: 10.1016/j.neuron.2006.05.019. [DOI] [PubMed] [Google Scholar]
- Vaney DI, Peichl L, Wässle H, Illing RB. Almost all ganglion cells in the rabbit retina project to the superior colliculus. Brain Res. 1981;212:447–453. doi: 10.1016/0006-8993(81)90476-5. [DOI] [PubMed] [Google Scholar]
- Vaney DI, Sivyer B, Taylor WR. Direction selectivity in the retina: symmetry and asymmetry in structure and function. Nat Rev Neurosci. 2012;13:194–208. doi: 10.1038/nrn3165. [DOI] [PubMed] [Google Scholar]
- Vélez-Fort M, Rousseau CV, Niedworok CJ, Wickersham IR, Rancz EA, Brown AP, Strom M, Margrie TW. The stimulus selectivity and connectivity of layer six principal cells reveals cortical microcircuits underlying visual processing. Neuron. 2014;83:1431–1443. doi: 10.1016/j.neuron.2014.08.001. [DOI] [PMC free article] [PubMed] [Google Scholar]
- Wurtz RH, Albano JE. Visual-motor function of the primate superior colliculus. Annu Rev Neurosci. 1980;3:189–226. doi: 10.1146/annurev.ne.03.030180.001201. [DOI] [PubMed] [Google Scholar]
- Yamashita T, Pala A, Pedrido L, Kremer Y, Welker E, Petersen CC. Membrane potential dynamics of neocortical projection neurons driving target-specific signals. Neuron. 2013;80:1477–1490. doi: 10.1016/j.neuron.2013.10.059. [DOI] [PubMed] [Google Scholar]
- Yonehara K, Shintani T, Suzuki R, Sakuta H, Takeuchi Y, Nakamura-Yonehara K, Noda M. Expression of SPIG1 reveals development of a retinal ganglion cell subtype projecting to the medial terminal nucleus in the mouse. PLoS One. 2008;3:e1533. doi: 10.1371/journal.pone.0001533. [DOI] [PMC free article] [PubMed] [Google Scholar]
- Yonehara K, Ishikane H, Sakuta H, Shintani T, Nakamura-Yonehara K, Kamiji NL, Usui S, Noda M. Identification of retinal ganglion cells and their projections involved in central transmission of information about upward and downward image motion. PLoS One. 2009;4:e4320. doi: 10.1371/journal.pone.0004320. [DOI] [PMC free article] [PubMed] [Google Scholar]