

Abstract
Mechanisms of seizure initiation are unclear. To evaluate the possible roles of inhibitory neurons, unit recordings were obtained in the dentate gyrus, CA3, CA1, and subiculum of epileptic pilocarpine-treated rats as they experienced spontaneous seizures. Most interneurons in the dentate gyrus, CA1, and subiculum increased their firing rate before seizures, and did so with significant consistency from seizure to seizure. Identification of CA1 interneuron subtypes based on firing characteristics during theta and sharp waves suggested that a parvalbumin-positive basket cell and putative bistratified cells, but not oriens lacunosum moleculare cells, were activated preictally. Preictal changes occurred much earlier than those described by most previous in vitro studies. Preictal activation of interneurons began earliest (>4 min before seizure onset), increased most, was most prevalent in the subiculum, and was minimal in CA3. Preictal inactivation of interneurons was most common in CA1 (27% of interneurons) and included a putative ivy cell and parvalbumin-positive basket cell. Increased or decreased preictal activity correlated with whether interneurons fired faster or slower, respectively, during theta activity. Theta waves were more likely to occur before seizure onset, and increased preictal firing of subicular interneurons correlated with theta activity. Preictal changes by other hippocampal interneurons were largely independent of theta waves. Within seconds of seizure onset, many interneurons displayed a brief pause in firing and a later, longer drop that was associated with reduced action potential amplitude. These findings suggest that many interneurons inactivate during seizures, most increase their activity preictally, but some fail to do so at the critical time before seizure onset.
Keywords: CA1, CA3, dentate gyrus, local field potential, subiculum, theta
Introduction
Little is known about how spontaneous seizures initiate, but inhibitory interneurons might be involved. Blocking inhibitory synaptic transmission causes seizure activity (Schwartzkroin and Prince, 1980). In patients with temporal lobe epilepsy, GABAergic neurons (de Lanerolle et al., 1989), synapses (Brooks-Kayal et al., 1998), and circuits (Mathern et al., 1995) are aberrantly changed in the hippocampal formation, where spontaneous seizures frequently begin (Quesney, 1986; Spencer et al., 1987; Sperling and O'Connor, 1989).
Most previous studies provoked seizures or seizure-like events to investigate the potential roles of interneurons. Tetanic stimulation can reduce interneuron activity (Kogure, 1987; Bragin et al., 1997), reduce the inhibition of principal cells (Finch and Babb, 1977; Ben-Ari et al., 1979), and initiate seizures. In contrast, tetanic stimulation also can excite interneurons that in turn evoke excitatory, depolarizing GABA responses in principal cells (Higashima et al., 1996; Velazquez and Carlen, 1999; Timofeev et al., 2002; Fujiwara-Tsukamoto et al., 2003, 2004, 2010). Partial antagonism of GABAA receptors results in hyperexcitability, strong excitation of interneurons, and the consequent enhanced release of GABA and increased extracellular potassium (Gnatkovsky et al., 2008; Avoli and de Curtis, 2011; Trombin et al., 2011), or the overexcitation of interneurons and depolarization block (Dichter and Spencer, 1969). Low magnesium ion concentration and/or blockade of potassium ion channels with 4-aminopyridine provokes seizure-like events that have been attributed to depolarization block of interneurons (Ziburkus et al., 2006; Cammarota et al., 2013), depletion of presynaptic GABA pools (Zhang et al., 2012), and depolarizing GABA responses in principal cells (Perreault and Avoli, 1992; Lopantsev and Avoli, 1998; but see Derchansky et al., 2008; Lasztóczi et al., 2009; Ellender et al., 2014). The diverse and sometimes conflicting proposed roles of interneurons in seizures might be attributable in part to differences in seizure-provoking methods, whose relevance to mechanisms of spontaneous seizures is questionable.
Several studies have evaluated spontaneous seizures and found earlier preictal changes in interneurons and inhibition than have typically been reported for provoked in vitro events. Unit recordings from the neocortex of a patient with epilepsy revealed increased activity of interneurons before seizure onset (Truccolo et al., 2011). As kainate-treated rats experience spontaneous seizures, local field potential-evoked responses of the dentate gyrus frequently reveal reduced excitability before seizure onset, suggesting increased preictal inhibition (Bragin et al., 2005; Queiroz et al., 2009). In epileptic pilocarpine-treated rats, action potential firing of CA3 interneurons becomes more synchronous before seizure onset (Grasse et al., 2013), and some principal neurons in CA1 and the dentate gyrus display reduced firing rates before the onset of spontaneous seizures (Bower and Buckmaster, 2008; Fujita et al., 2014). Together, these findings suggest the potential involvement of inhibitory interneurons in seizure initiation, but many questions persist. In the present study, we asked the following. Do interneurons in the dentate gyrus, CA3, CA1, or subiculum change their action potential firing rates before the onset of spontaneous seizures in epileptic pilocarpine-treated rats? Do any interneurons inactivate before seizure onset? If so, which types of interneurons, and what might be the mechanism of inactivation?
Materials and Methods
The methods of the present study are similar or identical to those of our recently reported evaluation of preictal activity of principal neurons (Fujita et al., 2014) and are copied below for the reader's convenience. Data were obtained from many of the same animals.
Pilocarpine treatment.
All experiments were performed in accordance with the National Institutes of Health Guide for the Care and Use of Laboratory Animals and were approved by a Stanford University institutional animal care and use committee. Male Sprague Dawley rats (Harlan Laboratories) 36–61 d of age were treated with pilocarpine (380 mg/kg, i.p.) 20 min after atropine methyl bromide (5 mg/kg, i.p.). Two hours after the onset of status epilepticus, rats received diazepam (10 mg/kg, i.p., repeated as needed), and lactated Ringer's solution (10 ml, s.c.). Beginning at least 7 d after pilocarpine treatment, rats were video monitored for motor seizures of grade 3 or greater (Racine, 1972) to confirm the development of spontaneous, recurrent seizures before microdrive implantation surgery.
Surgery.
Local field potential and unit recordings were obtained with tetrodes in a microdrive (NLX 9-drive, Neuralynx). To implant microdrives, rats were sedated with diazepam (10 mg/kg, i.p.), anesthetized with isoflurane, placed in a stereotaxic frame, maintained on a heating pad with feedback control, given an antibiotic (enrofloxacin, 10 mg/kg, s.c.), and prepared for aseptic surgery. A microdrive, containing eight independently movable tetrodes, was implanted 2.6 mm lateral of bregma and either 4.6 mm (n = 10 rats) or 6.1 mm (n = 6) posterior to bregma, depending on whether targeted regions were CA1, CA3, and the dentate gyrus or the subiculum and CA1, respectively. Tetrodes were made from four aromatic polyimide-insulated tungsten wires (Sandvik), 12.7 μm in diameter, which were twisted and fused together with heat. Electroplating reduced tetrode impedances to 300–600 kΩ. A reference electrode was placed in somatosensory cortex. Theta and delta activity recorded in the hippocampus could have been volume conducted from neighboring regions (Sirota et al., 2008), but the effect would be minor in the data presented here. Grounds consisted of screws in the skull rostral to bregma and caudal to lambda. A subset of rats (n = 10) was implanted with a bipolar stimulating electrode in the angular bundle (7.6 and 4.6 mm posterior and lateral of bregma, respectively, and ∼3 mm below the brain surface). Stimulating electrodes consisted of two 50-μm-diameter H-formvar-coated stainless steel wires (California Fine Wire Company) with 1 mm vertical tip separation. Microdrives were affixed to the skull with cranioplastic cement and jeweler's screws. Following surgery, rats received lactated Ringer's solution (10 ml, s.c.) and an analgesic (buprenorphine, 0.05 mg/kg, s.c.).
Data acquisition.
Beginning 7 d after surgery, tetrodes were slowly advanced over days. In rats with stimulating electrodes, the examination of evoked responses facilitated localization of cell layers. Unit, local field potential, and time-locked video recordings were obtained ∼8 h/d, 6 d/week, during which time spontaneous seizures occurred. Rats frequently slept during recording periods, which is likely to have increased the seizure probability (Hellier and Dudek, 1999; Sedigh-Sarvestani et al., 2014). Signals were buffered with a headstage (HS-36, Neuralynx), amplified, digitized (Cheetah Data Acquisition, Neuralynx), and saved to disk for off-line analysis. One channel of each tetrode was filtered (0.1–1800 Hz) and sampled (2 kHz) to record continuous local field potentials. In parallel, all four channels of each tetrode were filtered (600–6000 Hz) and sampled (32 kHz) to record extracellular action potentials. Unit recordings consisted of time-stamped epochs of 1 ms duration that were triggered when an amplitude threshold was surpassed. Amplitude thresholds were manually set before each recording session. The numbers of rats, seizures, and units recorded are listed in Table 1.
Table 1.
Number of rats, seizures, and interneurons recorded
| Rat | Seizures | Interneurons |
|---|---|---|
| 1 | 16 | 5 Dentate gyrus |
| 2 | 49 | 3 Dentate gyrus, 6 CA3 |
| 3 | 20 | 2 Dentate gyrus, 1 CA3 |
| 4 | 85 | 7 Dentate gyrus, 1 CA3, 4 CA1 |
| 5 | 19 | 1 Dentate gyrus, 1 CA3, 1 CA1 |
| 6 | 25 | 2 Dentate gyrus, 5 CA3, 1 CA1 |
| 7 | 82 | 2 Dentate gyrus, 4 CA1 |
| 8 | 244 | 13 Dentate gyrus, 12 CA1 |
| 9 | 5 | 1 CA3 |
| 10 | 92 | 10 CA3, 1 CA1 |
| 11 | 22 | 1 CA1 |
| 12 | 11 | 2 CA1 |
| 13 | 51 | 2 CA1, 5 subiculum |
| 14 | 16 | 2 CA1, 1 subiculum |
| 15 | 33 | 6 Subiculum |
| 16 | 96 | 5 Subiculum |
| Total | 866 | 35 Dentate gyrus |
| 25 CA3 | ||
| 30 CA1 | ||
| 17 Subiculum |
Anatomy.
After recordings were completed, rats were killed with urethane (2 g/kg, i.p.) and perfused at 30 ml/min through the ascending aorta for 2 min with 0.9% NaCl, 5 min with 0.37% sodium sulfide solution, 1 min with 0.9% NaCl, and 30 min with 4% formaldehyde in 0.1 m phosphate buffer (PB), pH 7.4. Brains were removed and stored in fixative at 4°C at least overnight and then equilibrated in 30% sucrose in 0.1 m PB. The cerebral hemisphere from which recordings had been obtained was sectioned coronally using a sliding microtome set at 40 μm. Continuous series of sections were stained with 0.25% thionin so that tetrode tracks could be identified.
Local field potential analysis.
Seizure onset was identified by examining local field potential recordings. A seizure onset window was bracketed by manually identifying the latest time of normal activity and the earliest time of clear seizure activity. Within the bracketed period, seizure onset was determined by the earliest appearance of a persistent change that developed into clear seizure activity, as described previously (Bower and Buckmaster, 2008; Toyoda et al., 2013). Examples of seizure onsets are illustrated in Figures 2B3 and 10A2. Seizure offset time was determined by the abrupt cessation of large-amplitude field potentials. Only seizures >10 s in duration were included for analysis.
Figure 2.
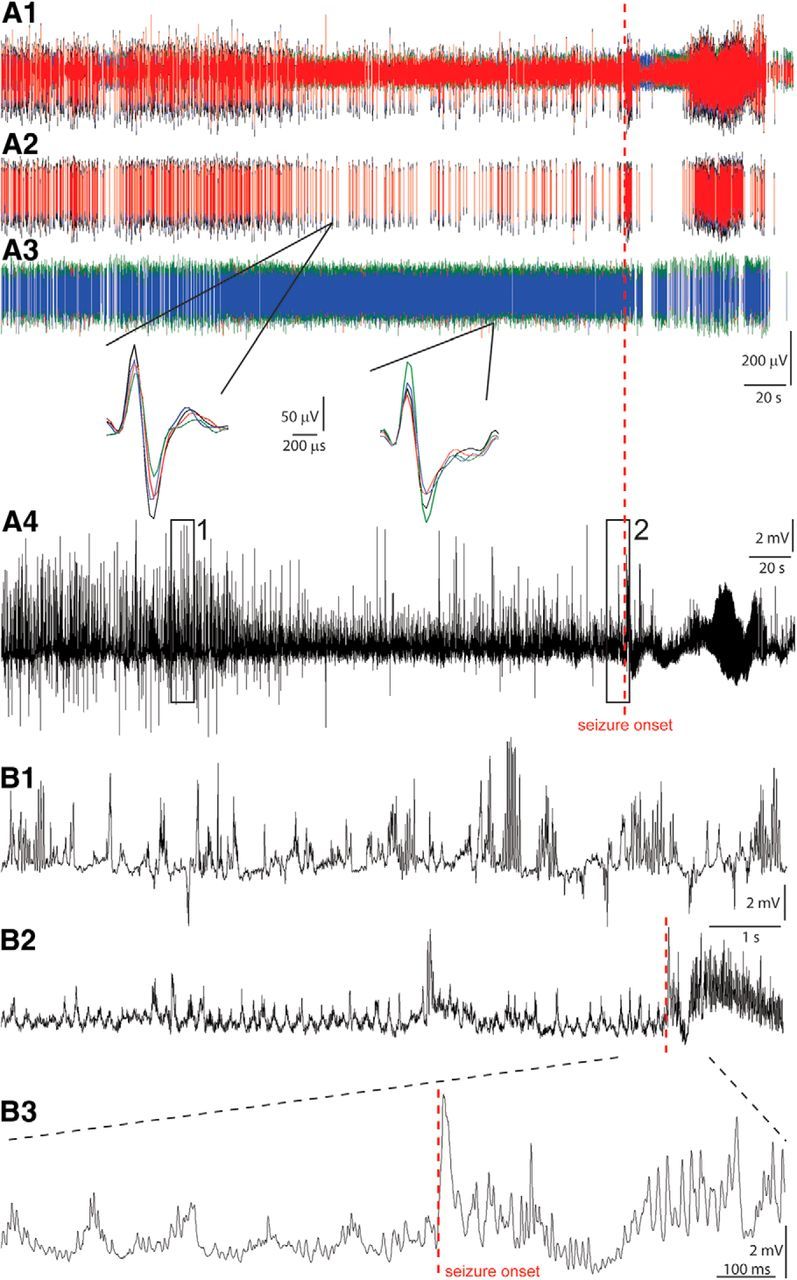
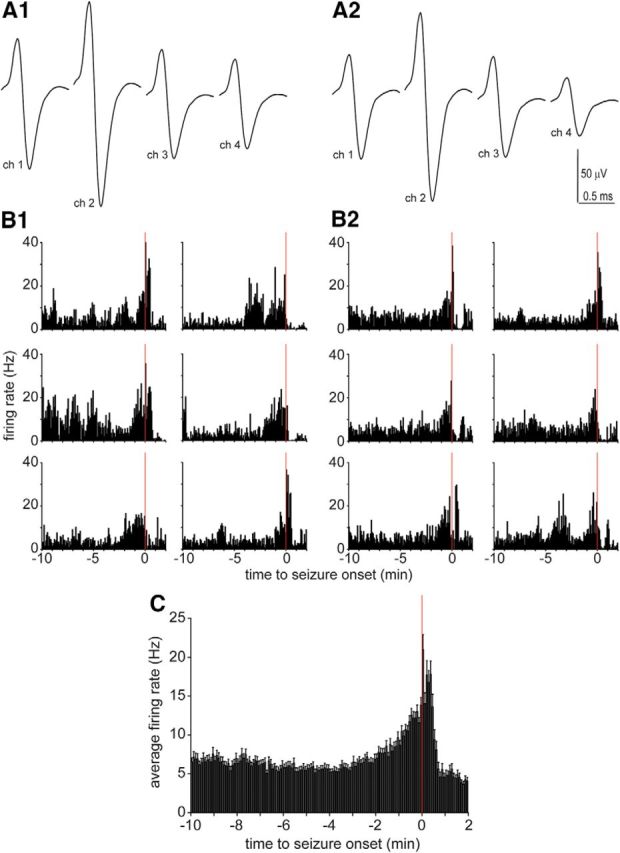
Interneurons were recorded before and during spontaneous seizures. A1–A4, Unit and local field potential recordings from the dentate gyrus. Multiunit (A1), sorted single-unit (A2, A3), and local field potential recordings (A4). The multiunit and one of the sorted single-unit recordings (A2) were obtained from the same tetrode. The other sorted single-unit recording (A3) was obtained with a different tetrode. Insets show single action potentials recorded by four channels (different colors) of the tetrodes. A4, B1, B2, Boxed regions in the local field potential (A4) are non-theta (1) and preictal theta (2) periods that are shown at higher resolution below (B1 and B2, respectively). B3, Expanded view around seizure onset. Up is negative in A1–A3. Up is positive in A4 and B1–B3.
Figure 10.
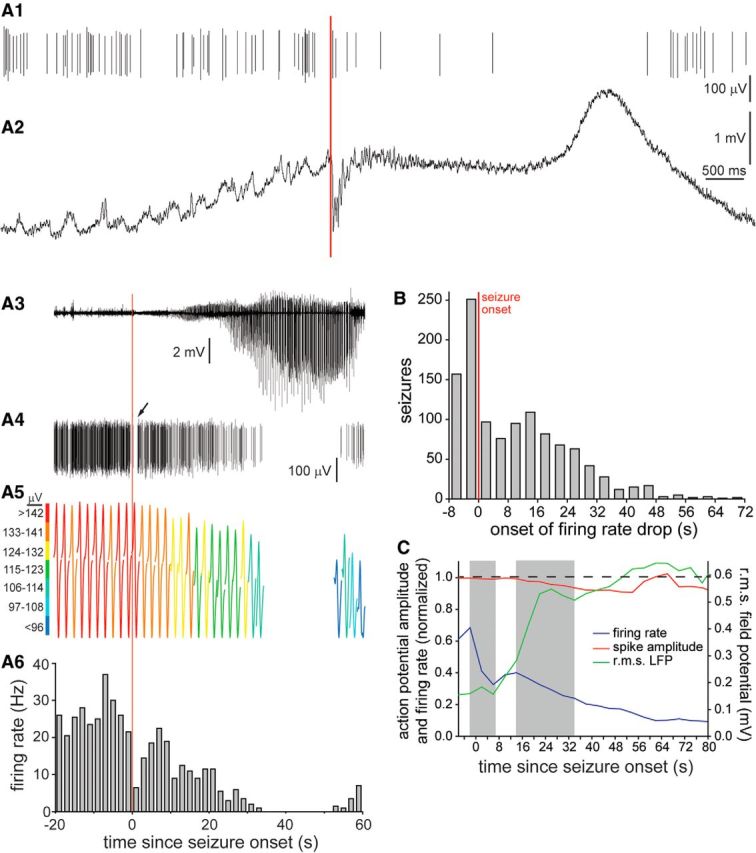
Interneuron action potential firing rates and amplitudes during seizures. A1–A6, Example of a CA1 interneuron that displayed a brief pause in action potential firing at the onset of a spontaneous seizure and a later, longer period of inactivation during the seizure. High-temporal resolution view of seizure onset in broadband local field potential (A2) and isolated single-unit discharges of the interneuron (A1). The red line indicates seizure onset. A3, Local field potential (LFP), high-passed filtered (10 Hz). A4, Sorted single unit. Arrow indicates first pause in firing. A5, Interneuron action potentials averaged in 2 s bins. Each individual action potential recording is of 1 ms duration. A6, Firing rate. The time scale of perievent time histogram pertains to A3–A6. B, Number of seizures in which early and late drops in firing rate were detected. Data obtained from interneurons in all hippocampal regions. C, Average normalized action potential amplitudes and average normalized firing rates immediately before and during seizures. Onsets and durations of first and second drops in firing rate are indicated by shading.
Periods of theta wave activity in the local field potential were identified by a two-step process. First, theta activity was identified automatically by using a sliding window of 2 s duration and 1 s overlaps, and by calculating a spectrogram for each bin using a fast Fourier transform. Epochs were identified in which the power spectral density ratio of theta (3–8 Hz) to delta (2–3 Hz) frequency exceeded 2 for at least two consecutive 2 s bins. Next, the automatically detected theta frequency was verified manually, and onsets and offsets of clear theta periods were marked using NeuroExplorer 4 (Nex Technologies). The theta frequency range used in the present study (3–8 Hz) is similar to the original description of theta frequency (4–7 Hz; Walker and Dovey, 1944) and encompasses the average frequency of hippocampal theta waves in rats (Mitchell and Ranck, 1980), although many studies now include higher frequencies. It is possible that results might have been different if a higher frequency range were used, but that seems unlikely in part because the theta frequency peak is reduced in epileptic rats (Lenck-Santini and Holmes, 2008; Chauvière et al., 2009; Inostroza et al., 2013).
Periods of sharp waves in CA1 local field potentials were identified by a two-step process. First, sharp waves were identified automatically by detecting amplitude peaks that exceeded 9 SDs above the overall mean. A threshold of 1 SD around a peak was used to tentatively determine the onset and offset of the sharp wave. Duration was restricted to 40–100 ms (Buzsáki et al., 1989). Automatically detected sharp waves were verified manually, and onsets and offsets of clear sharp waves were marked using NeuroExplorer 4.
To measure the amplitude of local field potential recordings during seizures, signals were high-pass filtered at 10 Hz, binned at 4 s, mean adjusted to 0, and processed to extract root mean square (rms) power.
Unit data analysis.
An off-line semi-automated approach (Harris et al., 2000) was used to separate action potentials of single units from multiunit activity, as described previously (Bower and Buckmaster, 2008). Briefly, single units were identified by grouping similar waveforms based on the following four features: peak amplitude, sum of squared amplitude, and the first two principal components. An automated, cluster identification program was used first (KlustaKwik-1.7; K.D. Harris, Rutgers University, New Brunswick, NJ). Then, final clusters were manually selected (MClust-3.5A; A.D. Redish, University of Minnesota, Minneapolis, MN) based on waveform similarity and autocorrelograms. Final clusters had <0.5% of action potentials at interspike intervals of <2 ms in autocorrelograms.
An average waveform for each channel of a tetrode was generated, and the channel with the largest peak-to-valley amplitude was used to measure mean spike amplitude and peak-to-valley spike width. A waveform symmetry index was calculated as the ratio of peak amplitude to valley amplitude; values closer to 1 indicate more symmetry.
For each unit, firing rate during the entire recording session (“long-average firing rate”) was calculated. In addition to long-average firing rate, firing rates were measured for theta and non-sharp-wave non-theta (NSNT) frequency periods. The firing rate during theta activity was calculated as the total number of action potentials that fell within manually verified theta frequency periods divided by the summed length of the theta periods. Firing rate during non-theta activity excluded periods of theta activity, which were identified by the automated first-step procedure described above. If the theta firing rate was greater than the NSNT firing rate for a given cell, it was designated “theta-on.” Likewise, if theta firing rate was less than the NSNT firing rate the cell was considered “theta-off.”
Units were recorded across multiple days. A given unit was identified from prior recordings based on similarities in waveforms, spike widths, spike symmetry indices, and interspike interval histograms. When units were identified as a single cell across multiple seizures and multiple days, results were combined and averaged. Analysis focused on preictal activity. To avoid postictal effects on preictal activity patterns, seizures that occurred within 20 min of a preceding seizure were excluded from analysis.
Perievent time histograms (PETHs) of action potential frequency were generated by aligning data to seizure onsets and binning. Seizure onset occurred at the boundary between two bins. Data from PETHs were used to classify units as “preictal increase,” “preictal decrease,” or “unchanged” by comparing preictal and baseline firing rates. For all analyzed seizures of each unit, the average firing rate during each 5-s-duration bin was calculated. Then, the average firing rate of the preictal period (30 s before seizure onset) was calculated and compared with that of the baseline period (10–5 min before seizure onset) to test whether precital firing rate was >2 SDs greater or less than the baseline average.
To test whether the preictal firing rate of a neuron was higher or lower than baseline more often than chance across multiple seizures, a scrambling test was used that took into account the variability in firing rate of each individual neuron. In the entire recording file of each neuron, randomly determined time points were identified as “onsets” of pseudo-seizures, keeping the number of pseudo-seizures identical to the actual number of seizures that occurred during the recording of that neuron. Spike counts were measured for 10 min before the onset of pseudo-seizures, and the number of pseudo-seizures with action potential firing rates higher during the preictal period (30 s before onset) compared with baseline (10–5 min before onset) was measured. The procedure was repeated 100 times to create a table of p values for the null hypothesis that spike rates before seizure onset were randomly higher than baseline. The entire procedure was repeated to create an analogous p value table for spike rates prior to seizure onset less than baseline. p values ≤0.05 were considered significant.
To detect precipitous drops in activity associated with seizures, firing rate data were evaluated during epochs beginning 8 s before seizure onset until seizure termination. Firing rate data were binned (4 s), and a 12 s window was used to check for drops in firing frequency >0.3 times the maximum firing rate. Averaging across two bins was performed to search for maxima and minima. The maximum and minimum around a firing rate drop were taken as the onset and end, respectively, to measure the duration of reduced firing. After an initial drop in firing frequency was found, the remaining seizure period was evaluated similarly for a second steep drop in firing rate but with a longer 20 s window to detect more gradual reductions.
In an attempt to identify the types of CA1 interneurons that were recorded, action potential firing characteristics during theta and sharp waves were evaluated. The sharp wave firing rate was calculated by dividing the total number of spikes during a sharp wave by its duration. The probability of spiking during a sharp wave was the total number of sharp waves with at least one action potential divided by the total number of sharp waves. To calculate the preferred theta angle of interneuron spiking, theta regions of the local field potential were bandpass filtered (3–8 Hz), each theta cycle was divided into 20 bins of 18° each, and the number of spikes in each bin was counted. The midpoint of the bin with the most spikes was taken as the theta angle. A Rayleigh test for nonuniformity of circular data was used, with p < 0.05 considered significant.
Results
Tetrode locations
Unit and local field potential data were obtained from 16 rats beginning 119 ± 16 d (mean ± SEM; range, 14–252 d) after experiencing pilocarpine-induced status epilepticus. When recordings were completed, rats were prepared for anatomical evaluation. Tetrode tracks in Nissl-stained sections were used to identify recording sites (Fig. 1). Tracks revealed the final positions of tetrodes. If units were recorded before the final depth had been reached, positions at the time of recordings were estimated by subtracting subsequent tetrode advancements. Data were obtained with 22, 13, 20, and 11 tetrodes, respectively, in the dentate gyrus, CA3, CA1, and subiculum.
Figure 1.
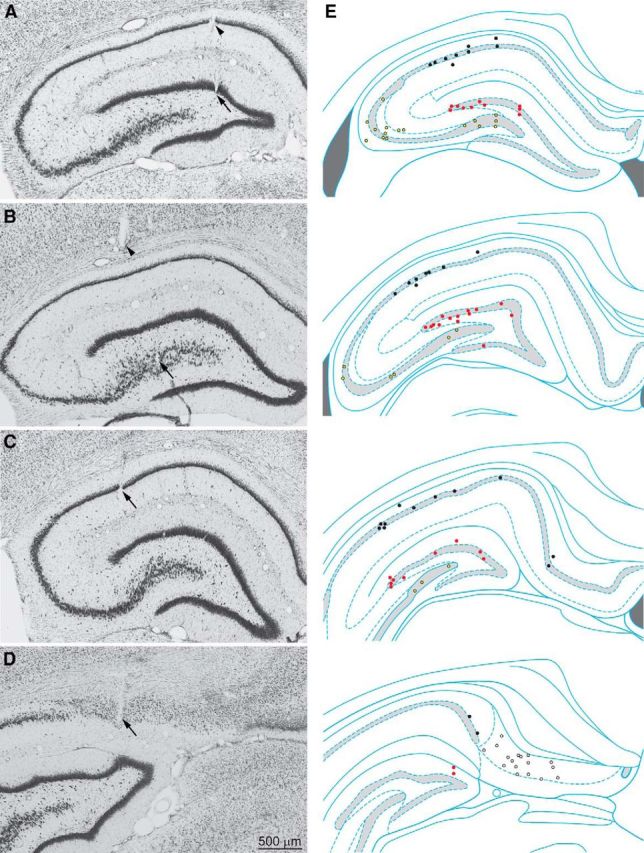
Coronal Nissl-stained sections were used to identify tetrode tracks. A–D, Arrows indicate tetrode tip locations in the dentate gyrus (A), CA3 (B), CA1 (C), and subiculum (D). A, B, Arrowheads indicate other tetrode tracks. E, Sites of recorded interneurons in the dentate gyrus (red markers), CA3 (yellow), CA1 (black), and subiculum (white) at rostral (top) to caudal (bottom) levels. Hippocampal schematic diagrams are from Paxinos and Watson (2009).
Seizures
Local field potential recordings revealed spontaneous seizure activity (Fig. 2A4) similar to that described previously for pilocarpine-treated rats (Lévesque et al., 2012; Toyoda et al., 2013; Grasse et al., 2013). To be included for analysis, seizures were at least 10 s in duration and occurred at least 20 min after any preceding seizure. Analyzed data were obtained from a total of 866 seizures (54 ± 15 seizures/rat; range, 5–244; Table 1). Seizure durations were 58 ± 1 s (range, 14–238 s), and 72% of seizures (824 of 853 seizures) in which video was available for behavioral analysis were convulsive (Racine score, ≥3). The average durations of convulsive and nonconvulsive seizures were similar (57 and 60 s, respectively).
Unit classification
Units were classified as putative interneurons or principal cells based on established criteria (Fox and Ranck, 1975; Jung and McNaughton, 1993; Csicsvari et al., 1999; Viskontas et al., 2007; Bower and Buckmaster, 2008; Czurkó et al., 2011; Fujita et al., 2014). Interneurons displayed high long-average firing rates, spike symmetry indices close to 1, and short spike widths (Fig. 3). In contrast, principal cells had lower long-average firing rates, symmetry indices farther from 1, and longer spike widths. For example, firing rates (10.1 ± 1.0 vs 0.5 ± 0.1 Hz; p < 0.001, Mann–Whitney rank sum test), spike symmetry indices (0.97 ± 0.03 vs 2.48 ± 0.13; p < 0.001), and spike widths (165 ± 3 vs 218 ± 8 μs; p < 0.001) of dentate gyrus interneurons and principal cells, respectively, were significantly different. A long-average firing rate of >4 Hz was used as a defining feature of interneurons. Some units could not be classified confidently as interneurons or principal cells: 2, 3, 2, and 10 units, respectively, in the dentate gyrus, CA3, CA1, and subiculum. The present study focused on interneurons and excluded unclassified cells from further analysis. Principal cells were evaluated in the study by Fujita et al. (2014).
Figure 3.
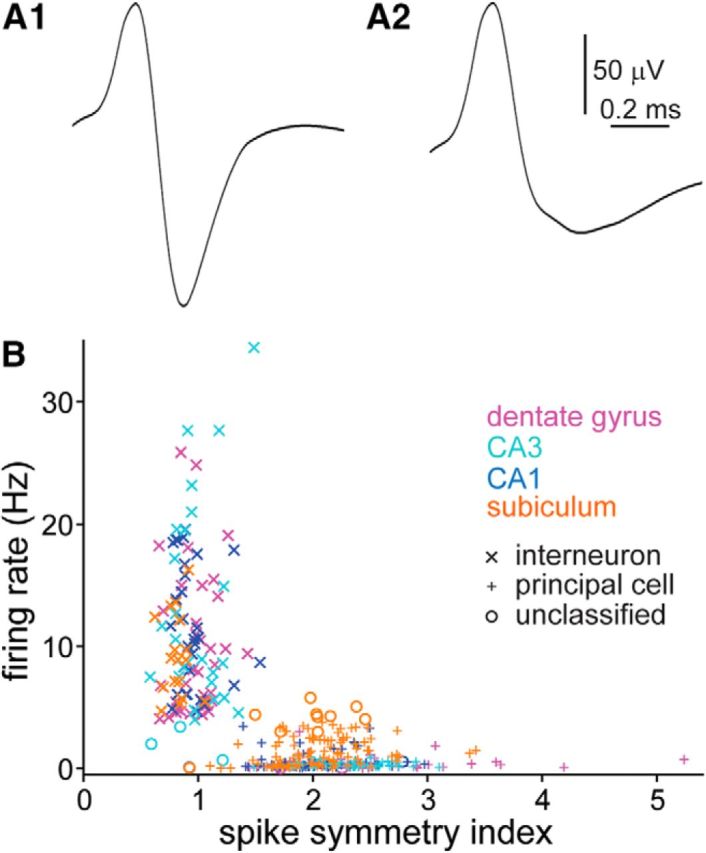
Units were classified as interneurons or principal cells based on spike symmetry and firing rate. A1, A2, Average waveforms of an interneuron (A1) and principal cell (A2) recorded in the dentate gyrus. Up is negative. B, Firing rate and spike symmetry index values of interneurons (x) and principal cells (+) recorded in the dentate gyrus, CA3, CA1, and subiculum. Some units could not be classified confidently (o).
Long-average and NSNT firing rates were similar (Table 2). Average firing rates during theta activity were higher than during long-average and NSNT periods, as expected, because most hippocampal interneurons fire faster during theta activity (Fox and Ranck, 1975). Interneurons in the dentate gyrus, CA3, CA1, and subiculum were not significantly different from one another with respect to each of the three different types of firing rates (ANOVA on ranks). The average features of spike waveforms were similar among interneurons in the dentate gyrus, CA3, and CA1, but were slightly different for subicular interneurons. Subicular interneurons displayed a lower average spike symmetry index compared with those of interneurons in the dentate gyrus and CA3 (0.82 ± 0.02 vs 0.97 ± 0.03 and 0.99 ± 0.04, respectively; p < 0.05, ANOVA on ranks with Dunn's method), higher average spike amplitude compared with interneurons in the dentate gyrus (194 ± 14 vs 135 ± 6 μV; p < 0.05), and shorter average spike width compared with interneurons in CA1 (159 ± 4 vs 166 ± 4 μs, p < 0.05).
Table 2.
Characteristics of all recorded interneurons
| Dentate gyrus | CA3 | CA1 | Subiculum | |
|---|---|---|---|---|
| Interneurons (n) | 35 | 25 | 30 | 17 |
| Seizures/interneuron | ||||
| Mean ± SEM | 14 ± 2 | 9 ± 1 | 9 ± 1 | 10 ± 3 |
| Range | 1–59 | 1–21 | 2–22 | 3–55 |
| Median | 8 | 7 | 11 | 7 |
| Long-average firing rate (Hz) | ||||
| Mean ± SEM | 10.1 ± 1.0 | 12.8 ± 1.6 | 11.5 ± 0.9 | 8.7 ± 0.7 |
| Range | 4.1–25.5 | 4.2–31.8 | 4.9–19.6 | 4.4–15.2 |
| Median | 8.3 | 8.5 | 10.4 | 8.4 |
| NSNT firing rate (Hz) | ||||
| Mean ± SEM | 10.0 ± 1.0 | 12.7 ± 1.7 | 11.6 ± 0.9 | 8.8 ± 0.7 |
| Range | 4.1–25.8 | 4.2–32.8 | 4.7–19.6 | 4.3–16.1 |
| Median | 8.2 | 8.5 | 10.7 | 8.4 |
| Theta firing rate (Hz) | ||||
| Mean ± SEM | 17.2 ± 1.5 | 14.9 ± 1.8 | 15.7 ± 1.8 | 16.2 ± 1.1 |
| Range | 1.0–31.7 | 1.5–41.3 | 1.6–44.6 | 8.1–23.7 |
| Median | 16.1 | 15.0 | 14.4 | 15.6 |
| Symmetry index | ||||
| Mean ± SEM | 0.97 ± 0.03 | 0.99 ± 0.04 | 0.95 ± 0.03 | 0.82 ± 0.02* |
| Range | 0.66–1.43 | 0.58–1.49 | 0.76–1.54 | 0.62–1.06 |
| Median | 0.98 | 0.94 | 0.90 | 0.83 |
| Spike amplitude (μV) | ||||
| Mean ± SEM | 135 ± 6 | 161 ± 9 | 161 ± 12 | 194 ± 14† |
| Range | 87–258 | 95–291 | 93–456 | 114–316 |
| Median | 120 | 155 | 146 | 184 |
| Spike width (μs) | ||||
| Mean ± SEM | 167 ± 3 | 180 ± 4 | 166 ± 4 | 159 ± 4‡ |
| Range | 140–210 | 150–210 | 150–210 | 150–230 |
| Median | 165 | 150 | 180 | 150 |
*Lower than dentate gyrus and CA3, p < 0.05, ANOVA on ranks with Dunn's method.
†Higher than dentate gyrus.
‡Lower than CA1.
Preictal unit activity
Data were obtained from interneurons across multiple seizures and days. Individual interneurons were recognized by the consistency of their waveform, spike symmetry, spike width, and firing rate characteristics (Fig. 4A). Interneuron firing rates were evaluated in PETHs of the period beginning 10 min before seizure onset, with the 10–5 min before seizure onset considered to be the baseline. Firing rates fluctuated during the baseline and preictal periods (Fig. 4B). Individual interneurons in all hippocampal subregions were recorded for an average of 11 ± 1 seizures (median, 7 seizures; range, 1–59 seizures). For each interneuron, PETHs from all seizures were averaged (Fig. 4C). Next, average PETHs of individual interneurons were averaged for all interneurons in each hippocampal subregion (Fig. 5).
Figure 4.
Interneurons were recorded during multiple spontaneous seizures. A1, A2, Waveforms of an interneuron recorded in the dentate gyrus by four channels of a tetrode 1 d (A1) and 9 d later (A2). The tetrode was not moved between days. Across days, waveforms (A1, A2), baseline firing rates (5.8 and 5.2 Hz, respectively), spike symmetry indices (0.87 and 0.85), spike widths (0.18 and 0.18 ms), and relative amplitude relationships among the four channels were similar. B1–B2, Firing rate data from six consecutively recorded seizures are plotted from the day corresponding to A1 (B1) and A2 (B2). C, A total of 59 seizures recorded during six sessions over a 35 d period were averaged. Error bars indicate the SEM.
Figure 5.
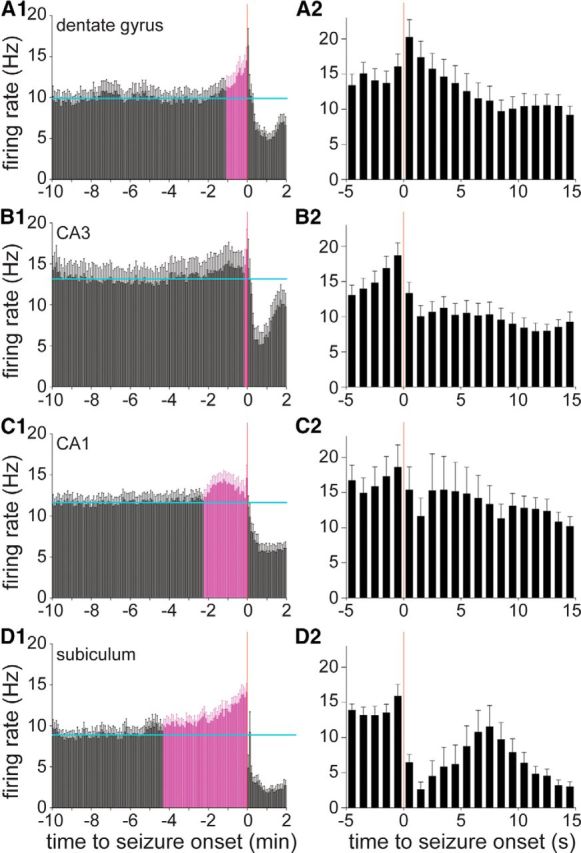
A–D, Average preictal activity of dentate gyrus (A), CA3 (B), CA1 (C), and subicular (D) interneurons (n = 35, 25, 30, and 17, respectively). A1, B1, C1, D1, Horizontal cyan lines indicate the average baseline firing rate during the 10–5 min period before seizure onset. Error bars indicate the SEM. Coloring indicates bars beginning immediately before seizure onset that are consistently >2 SDs greater than the baseline average. A2, B2, C2, D2, Same data around seizure onset plotted in 1 s bins.
The average preictal activity of dentate gyrus interneurons (n = 35) increased significantly (>2 SDs from the baseline average) and progressively beginning 65 s before seizure onset (Fig. 5A1). In the 5 s bin immediately preceding seizure onset, the average firing rate reached 1.5 times the baseline value. Examples of dentate gyrus interneurons whose firing rates increased before seizure onset are shown in Figures 2A3 and 4B,C. In CA3, the average preictal activity of interneurons (n = 25) was significantly increased 75–15 s before seizure onset, but then returned toward baseline levels until the last 10 s before seizure onset (Fig. 5B1). At its peak, the average preictal firing rate of CA3 interneurons reached 1.3 times baseline. In CA1, the average preictal activity of interneurons (n = 30) increased significantly beginning 135 s before seizure onset, peaked 75 s before seizure onset at 1.2 times baseline, and then declined until the last 5 s bin immediately preceding seizure onset, at which time it peaked again at 1.3 times baseline (Fig. 5C1). In the subiculum, the average preictal activity of interneurons (n = 17) increased significantly beginning 260 s before seizure onset and peaked immediately before seizure onset at 1.6 times baseline (Fig. 5D1). These findings revealed that seconds to minutes before the onset of a spontaneous seizure, the average firing rates of interneurons increased significantly. Subicular interneurons displayed the earliest and largest average preictal increase, whereas CA3 interneurons displayed the least change.
To evaluate the changes in average preictal activity with greater temporal resolution, PETHs were generated with 1 s bins for the period from 5 s before until 15 s after seizure onset. For interneurons in the dentate gyrus, the peak in average firing rate was during the 1 s period following seizure onset (Fig. 5A2). In CA3, CA1, and the subiculum, the peak average firing rate occurred during the 1 s period preceding seizure onset (Fig. 5B2–D2).
To test whether there were differences in preictal activity before convulsive versus nonconvulsive seizures, average PETHs were generated for each seizure type. Sample sizes of nonconvulsive seizures that occurred during unit recordings in the subiculum and CA3 region were limited (n = 10 and 4, respectively) compared with convulsive seizures (n = 165 and 210, respectively), which precluded rigorous comparisons. However, sample sizes in the dentate gyrus and CA1 region were sufficient, and average PETHs revealed similar preictal activation patterns before both convulsive and nonconvulsive seizures (data not shown).
Next, firing rate data were evaluated interneuron by interneuron. Two methods were used to classify interneurons based on whether their activity increased, remained unchanged, or decreased before seizure onset. An example of an interneuron in the dentate gyrus whose firing rate decreased before seizure onset is shown in Figure 2A2. The first classification method calculated the average baseline value of an interneuron and the preictal firing rates for all seizures during which it was recorded (Fig. 4C). The average firing rate during a preictal period (30 s before seizure onset) was compared with that during baseline (10–5 min before seizure onset) to determine whether the average preictal firing rate was >2 SDs from the baseline average. In the dentate gyrus, CA3, CA1, and subiculum, respectively, results were as follows (Fig. 6): preictal-increase: 51% (18 of 35 interneurons), 24% (6 of 25 interneurons), 43% (13 of 30 interneurons), and 76% (13 of 17 interneurons); unchanged: 43% (15 of 35 interneurons), 64% (16 of 25 interneurons), 30% (9 of 30 interneurons), and 24% (4 of 17 interneurons); preictal-decrease: 6% (2 of 35 interneurons), 12% (3 of 25 interneurons), 27% (8 of 30 interneurons), and 0% (0 of 17 interneurons). These findings revealed that interneurons with increased preictal activity were most prevalent in the subiculum, those with decreased preictal activity were most common in CA1, and CA3 interneurons were least likely to change their firing rate preictally.
Figure 6.
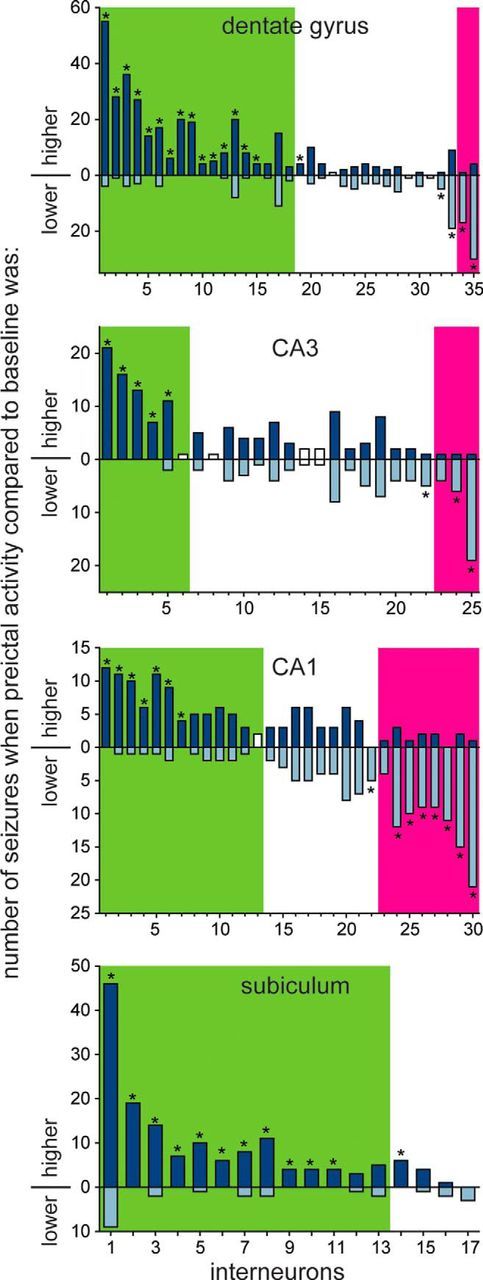
Many interneurons displayed significantly consistent preictal-increased (or preictal-decreased) activity. Number of dentate gyrus, CA3, CA1, and subicular interneurons classified as preictally increased, unchanged, or preictally decreased. Each bar represents a single interneuron and indicates the number of seizures when its firing rate during the last 30 s before seizure onset was greater than the average baseline firing rate for that seizure (top, dark blue part of bar) and the number of seizures when its preictal firing rate was less than baseline (bottom, light blue part of bar). For example, the first interneuron in the dentate gyrus was recorded during 59 seizures, 55 of which had higher preictal versus baseline firing rates and 4 of which had lower preictal versus baseline firing rates. Green and magenta shading indicates neurons classified as preictally increased or preictally decreased, respectively, based on comparison of preictal (last 30 s before seizure onset) and baseline firing rates averaged across all seizures for that neuron (>2 SDs from baseline average). Asterisks indicate neurons with significantly higher or lower preictal activity based on a scrambling test. White bars are neurons for which the scrambling test could not be performed, because firing rate variability was too high.
A second method classified interneurons based on the consistency of their preictal activity. A scrambling test was used to determine for each interneuron whether the number of seizures with firing rates higher (or lower) preictally (30 s before seizure onset) compared with baseline exceeded chance levels (Fig. 6). The test required that an interneuron was recorded during at least 3–33 seizures depending on its variability in firing rate, and 93% of interneurons (99 of 107 of interneurons) qualified. In the dentate gyrus, 50% of interneurons (16 of 32 interneurons) were significantly more consistent at firing faster preictally compared with baseline. Of those 16 interneurons, 8 fired faster preictally before 100% of the 4–20 seizures during which they were recorded, and the average for all 16 interneurons was 94% (range, 71–100%). Conversely, 13% of dentate gyrus interneurons (4 of 32 interneurons) were significantly consistent at firing slower preictally compared with baseline and did so during an average of 84% of seizures (range, 68–94% of seizures). In CA3, 24% of interneurons (5 of 21 interneurons) were significantly more likely to fire faster preictally and did so during an average of 97% of seizures (range, 85–100%), whereas 14% interneurons (3 of 21 interneurons) were more likely to fire more slowly preictally and did so during an average of 88% of seizures (range, 83–95%). In CA1, 24% of interneurons (7 of 29 interneurons) were significantly more likely to fire faster preictally and did so during an average of 92% of seizures (range, 82–100%), whereas 28% interneurons (8 of 29 interneurons) were more likely to fire more slowly preictally and did so during an average of 90% of seizures (range, 80–100%). In the subiculum, 71% of interneurons (12 of 17 interneurons) were significantly more likely to fire more quickly preictally and did so during an average of 94% of seizures (range, 80–100%). No subicular interneurons were significantly more likely to fire more slowly preictally. These findings revealed that substantial proportions of hippocampal interneurons displayed significantly consistent increased or decreased preictal activity. Increased preictal activity was most common in the subiculum (71% of interneurons). Decreased preictal activity was most common among CA1 interneurons (28% of interneurons).
Preictal theta
The findings described above revealed changes in interneuron firing that preceded seizure onset by seconds to minutes, raising the question of what might be the underlying mechanism. Many interneurons are more active during theta activity (Fox and Ranck, 1975), suggesting that preictal changes in interneuron firing rate might be related to preictal changes in theta activity, which have been reported previously (Butuzova and Kitchigina, 2008; Popova et al., 2008; Kitchigina and Butuzova, 2009; Grasse et al., 2013; Sedigh-Sarvestani et al., 2014). Preictal theta was evident in recordings of the present study (Fig. 2B2). To test whether theta activity was significantly more likely to occur before seizure onset, PETHs of theta/delta frequency ratios were generated (data not shown) and evaluated. Theta/delta frequency ratios would increase if there were more theta activity or less delta activity. Spectrograms of broadband local field potentials recorded in each subregion of the dorsal hippocampus of many rats included in the present study revealed that the largest preictal change was increased power in the 5–8 Hz band beginning at least a minute before seizure onset (Fujita et al., 2014), suggesting that increases in theta/delta frequency ratios are largely attributable to more theta activity. In the present study, compared with baseline, the average preictal theta/delta frequency ratios were significantly increased in all hippocampal regions, beginning 4.5 min before seizure onset in the subiculum, then CA1 (3.0 min), CA3 (2.5 min), and, finally, the dentate gyrus (1.5 min). Maximal preictal increases in theta/delta frequency ratios were highest in the subiculum (1.50 times baseline), then CA1 (1.39), CA3 (1.20), and finally the dentate gyrus (1.16). These findings confirmed increased preictal theta activity in all recorded regions, and revealed that it was earliest and greatest in the subiculum.
During theta activity, the firing rates of most interneurons increase, but a minority of interneurons discharges less frequently (Mizumori et al., 1990; Konopacki et al., 1992; Csicsvari et al., 1999; Bland et al., 2002). Interneurons were divided into theta-on and theta-off groups depending on whether their firing rate during theta activity, recorded during interictal baseline periods, was higher or lower, respectively, than that during NSNT periods. Similar to CA1 interneurons in control rats (Czurkó et al., 2011), 79% of all interneurons (85 of 107 interneurons) in all hippocampal regions had theta/NSNT firing rate ratios of >1 (theta-on). The rest had theta/NSNT firing rate ratios of <1 (theta-off).
To test whether theta-related firing corresponded with preictal activity, the average firing rates of theta-on and theta-off interneurons were plotted relative to seizure onset. In the dentate gyrus, 89% of interneurons (31 of 35 interneurons) were theta-on, and their average firing rate increased significantly above baseline beginning 65 s before seizure onset, reaching 1.6 times baseline in the 5 s bin immediately preceding seizure onset (Fig. 7A1). Only 11% of dentate gyrus interneurons (4 of 35 interneurons) were theta-off, and their average firing dropped significantly below baseline 35 s before seizure onset, dipping maximally to 75% baseline in the 10 s bin before seizure onset (Fig. 7A2). In CA3, 64% of interneurons (16 of 25 interneurons) were theta-on, and their average firing rate increased significantly above baseline beginning 70 s before seizure onset, reaching 1.4 times baseline in the 5 s bin immediately preceding seizure onset (Fig. 7B1), whereas 36% (9 of 25 interneurons) were theta-off, and their average preictal firing rate did not persistently drop significantly below baseline (Fig. 7B2). In CA1, 70% of interneurons (21 of 30 interneurons) were theta-on, and their average firing rate increased significantly above baseline beginning 130 s before seizure onset, reaching 1.5 times baseline in the 5 s bin immediately preceding seizure onset (Fig. 7C1), whereas 30% (9 of 30 interneurons) were theta-off, and their average firing dropped significantly below baseline beginning 50 s before seizure onset, dipping maximally to 56% baseline in the 10 s bin before seizure onset (Fig. 7C2). All interneurons in the subiculum were theta-on (Fig. 5D1). These findings revealed correlations between preictal activity and interictal theta activity, and raised the possibility that preictal changes in interneuron firing correlated with preictal theta activity.
Figure 7.
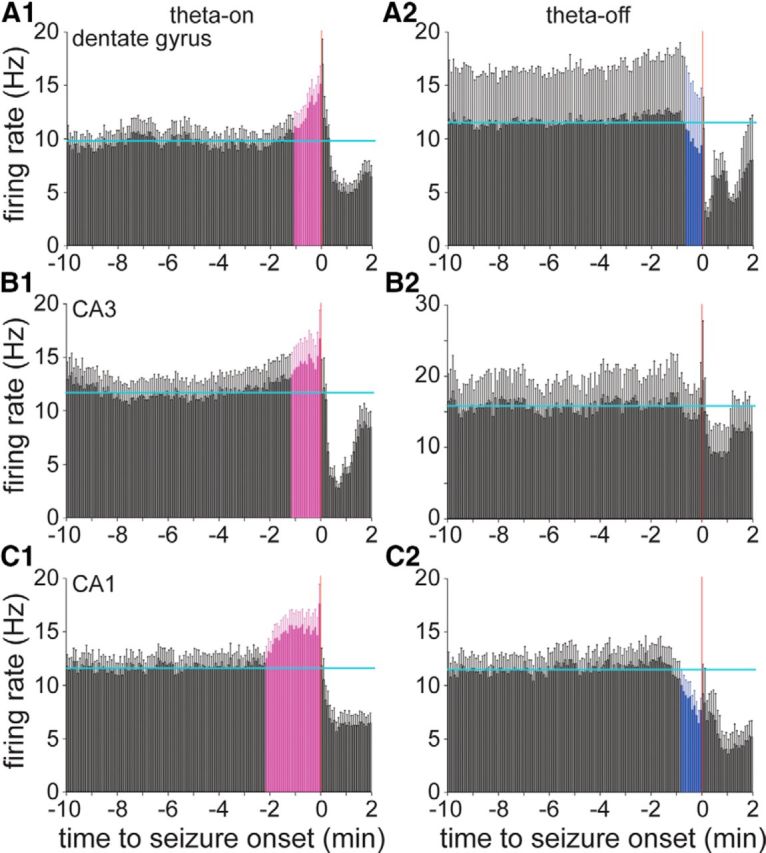
A1–C2, Average preictal activity of dentate gyrus, CA3, and CA1 interneurons classified as theta-on (A1, B1, C1) or theta-off (A2, B2, C2), depending on whether their average firing increased or decreased, respectively, during interictal theta waves. Horizontal cyan lines indicate the average baseline firing rate during the 10–5 min period before seizure onset. Error bars indicate the SEM. Coloring indicates bars beginning immediately before seizure onset that are consistently >2 SDs from the baseline average: magenta indicates higher than average, and blue indicates lower than average. The average firing rates of theta-on interneurons in all regions increased significantly preictally. All subicular interneurons were theta-on (Fig. 5D1). The average firing rates of theta-off interneurons in the dentate gyrus and CA1, but not CA3, decreased significantly before seizure onset. All plots use the same y-axis scale except that in B2.
To test whether factors other than theta activity might correlate with increased preictal activity, the effects of preictal theta activity were eliminated by analyzing only seizures in which theta/delta frequency ratios remained constant or decreased from baseline to preictal periods. For example, in the dentate gyrus 69% of interneuron recordings (336 of 489 recordings) during seizures displayed preictal theta activity, which were evident as higher theta/delta frequency ratios during the last 0.5 min before seizure onset compared with a baseline period 5.5–5.0 min before seizure onset (Fig. 8A1). Excluding seizures with increased preictal theta left those in which theta/delta frequency ratios remained the same or decreased preictally (Fig. 8A2). If increased preictal firing rate correlated exclusively with theta activity, then, after excluding seizures with increased preictal theta activity, preictal firing rates should not increase. That was not the case for dentate gyrus interneurons. Instead, the average firing rate of dentate gyrus interneurons 0.5–0 min before the onset of seizures without increased preictal theta activity was 1.26 times higher than that at 5.5–5.0 min before seizure onset (14.2 ± 0.8 vs 11.2 ± 0.7 Hz, respectively; p < 0.05, paired t test; Fig. 8B).
Figure 8.
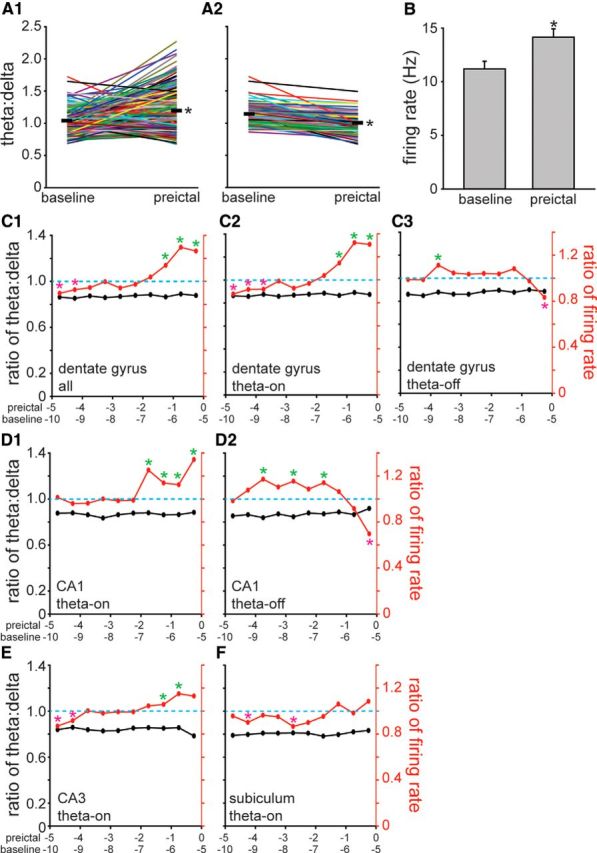
Increased preictal firing of subicular interneurons was theta dependent, but preictal changes in the firing rate of interneurons in other hippocampal regions were at least partly theta independent. A1, Baseline and preictal theta/delta frequency ratios of all seizures during which dentate gyrus interneurons were recorded. Data from individual seizures are indicated by colored lines. Thick, black horizontal lines represent the average theta/delta frequency ratios 5.5–5.0 min (baseline) and 0.5–0 min before seizure onset (preictal). *p < 0.001, paired t test. A2, Seizures in which theta/delta frequency ratios increased from baseline to preictal periods were excluded, leaving only those in which theta/delta frequency ratios were unchanged or decreased preictally. B, Average firing rates of dentate gyrus interneurons 5.5–5.0 min (baseline) and 0.5–0 min before onset (preictal) of seizures without preictal theta (A2). Values represent the mean ± SEM. *p < 0.05, paired t test. C1, Average firing rates of all interneurons recorded in the dentate gyrus (n = 35) increased preictally during seizures without preictal theta activity (p < 0.05, paired t test). The right-most marker in the theta/delta frequency plot was calculated by dividing the average theta/delta frequency ratio during the preictal period by that of the baseline period (values in A2). Similarly, the right-most marker in the firing rate plot was calculated by dividing the preictal by the baseline average firing rate (values in B). The next set of markers to the left in C1 represent values calculated identically, except the baseline period was 6.0–5.5 min and the preictal period was 1.0–0.5 min before seizure onset, and so on. A green (magenta) asterisk indicates significantly higher (lower) average preictal versus baseline firing rates (p < 0.05, paired t test). All average preictal theta/delta frequency ratios were significantly lower than baseline (p < 0.05, paired t test), as expected, because seizures with preictal theta waves were excluded. C2, C3, Average action potential firing rates of theta-on interneurons recorded in the dentate gyrus (n = 31) increased preictally during seizures without preictal theta activity (C2), whereas theta-off interneurons (n = 4) reduced their average firing rate preictally (C3). D1, D2, Theta-on interneurons in CA1 (n = 21) increased their average firing rate preictally without preictal theta (D1), whereas theta-off interneurons in CA1 (n = 9) decreased their average firing rate preictally (D2). E, Theta-on interneurons in CA3 (n = 16) increased their average firing rate before seizure onset without preictal theta. F, In contrast, after excluding seizures with increased preictal theta activity, the average firing rate of subicular interneurons did not change significantly during the preictal period.
To determine the timing of theta-independent changes in preictal firing of dentate gyrus interneurons, baseline and preictal bins were compared by repeating the process described above after shifting stepwise to progressively earlier pairs of 0.5-min-duration bins separated by 5 min (e.g., the baseline bin 6.0–5.5 min before seizure onset and the preictal bin 1.0–0.5 min before seizure onset). For each pair of baseline and preictal bins, preictal-to-baseline ratios were calculated for theta/delta frequency and firing rate. Plots revealed that ratios of theta/delta frequency were stable over the preictal period and were <1, as expected, because seizures with increased preictal theta activity had been excluded (Fig. 8C1). In contrast, during the 1.5 min before seizure onset, ratios of firing rate were >1 and were significantly higher than those at baseline (p < 0.05, paired t test). Repeating the analysis after dividing dentate gyrus interneurons into theta-on and theta-off groups revealed that theta-on interneurons had significantly higher firing rates during the last 1.5 min before seizure onset (Fig. 8C2), whereas theta-off interneurons had significantly lower firing rates during the last 0.5 min before seizure onset (Fig. 8C3). These findings revealed substantial changes in the preictal activity of dentate gyrus interneurons that were independent of preictal theta activity.
Theta-independent increases and decreases in preictal activity by theta-on and theta-off interneurons, respectively, also were evident in CA1. CA1 theta-on interneurons increased their firing rate independently of theta activity beginning 2 min before seizure onset (Fig. 8D1), which corresponded with the timing of increased activity by theta-on interneurons in CA1 for all seizures (Fig. 7C1). CA1 theta-off interneurons decreased their firing rate independently of theta activity in the last 0.5 min before seizure onset (Fig. 8D2), which corresponded with the timing of decreased activity by theta-off interneurons for all seizures (Fig. 7C2). After excluding seizures with increased preictal theta activity, firing rates of theta-off interneurons tended to have preictal/delta frequency firing rate ratios of >1, which was as expected since they fire more slowly during theta activity. However, during the immediate preictal period their activity decreased significantly. CA3 theta-on interneurons displayed theta-independent increases in preictal firing (Fig. 8E). In contrast, increased preictal firing of subicular interneurons, all of which were theta-on, failed to persist after seizures with preictal theta activity were eliminated (Fig. 8F). There is no theta-off plot for subiculum because no subicular interneurons displayed significant preictal inactivation. There is no theta-off plot for CA3 because theta-off CA3 interneurons did not display significant preictal inactivation (Fig. 7B2). Together, these findings revealed that for subicular neurons theta activity was the predominant correlating factor of increased firing rate during preictal periods. In contrast, changes in preictal firing by interneurons in other hippocampal regions could be substantially independent of preictal theta.
Interneuron action potential amplitude decreases only slightly preictally
Findings described above revealed that before seizure onset subsets of interneurons in the dentate gyrus and CA1 reduced their firing rate, and the mechanism was largely independent of preictal theta activity. Mechanisms of preictal inactivation are important to identify because reduced interneuron firing might reduce the inhibition of principal cells and contribute to seizure initiation. One possible mechanism is depolarization block, which has been reported to occur in interneurons before or during seizure-like events (Dichter and Spencer, 1969; Ziburkus et al., 2006; Cammarota et al., 2013). If the membrane potential of a neuron remains sufficiently depolarized, voltage-gated sodium channel inactivity cannot be removed completely, and channel activation is reduced, resulting in small-amplitude action potentials (Hille, 1992). Amplitudes of action potentials in unit recordings are related to their intracellular correlates (Henze et al., 2000). Therefore, if the membrane potential of a neuron gradually depolarized to the point of blocking action potentials, one would expect gradual reduction of action potential amplitudes in unit recordings. Interneurons with decreased preictal activity were most prevalent in CA1, so CA1 interneurons were evaluated in more detail to test the possibility that depolarization block contributes to preictal inactivation.
In preictal-decrease CA1 interneurons (n = 8 interneurons recorded during 91 seizures) during the last 36 s before seizure onset, the average spike amplitudes were >3 SDs below the baseline average in 12 of 18 (67%) of the 2-s-duration bins (Fig. 9). However, the maximal reduction was only to 96.7% of baseline. To test whether preictal reductions in average spike amplitude were specific to interneurons with decreased preictal activity, the same analysis was performed on CA1 interneurons whose firing rates increased before seizure onset (n = 13 interneurons recorded during 85 seizures). They too displayed similar small but significantly reduced average spike amplitudes during the last 34 s before seizure onset (97.0% of baseline). Together, these findings revealed minor preictal reductions in average spike amplitudes regardless of whether the interneuron firing rate increased or decreased, suggesting that depolarization block was an unlikely mechanism of preictal reductions in firing frequency.
Figure 9.
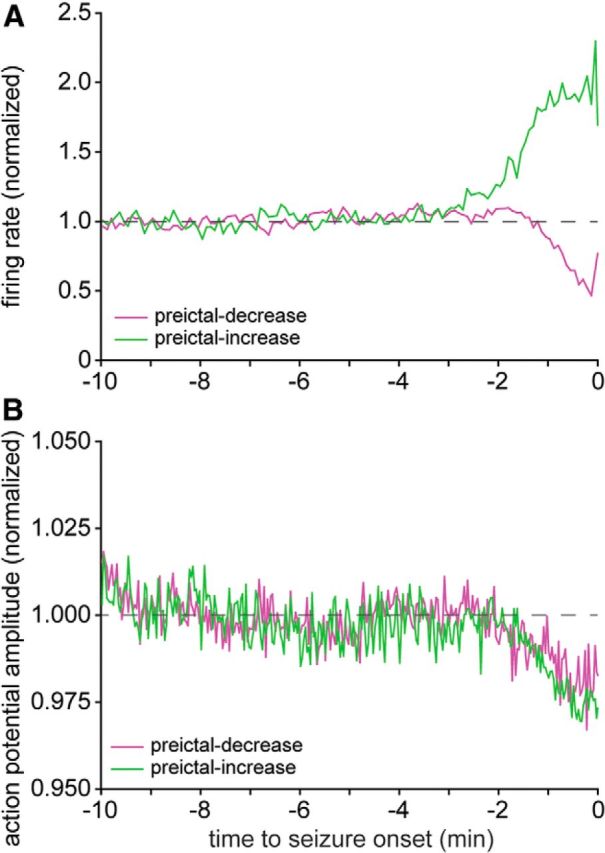
Action potential amplitude decreased slightly preictally in both preictally decreased and preictally increased interneurons. A, Average normalized firing rates of preictal-increase (green) and preictal-decrease (magenta) CA1 interneurons. B, Average normalized action potential amplitudes of preictal-increase and preictal-decrease CA1 interneurons. Note that the y-axis does not begin at zero.
Ictal unit activity
The primary focus of the present study was on the preictal period. However, recordings extended beyond seizure onset. Many interneurons displayed peaks in firing rate near seizure onset followed by lower rates during seizures (Fig. 4B). The average firing rates during seizures were below baseline in all hippocampal regions (Fig. 5A1–D1). Examination of average firing rates after seizure onset at higher temporal resolution suggested a first drop close to onset followed by partial recovery and then a second decline (Fig. 5A2–D2). Postonset reductions in average firing rate were most severe in the subiculum (Fig. 5D2).
Examination of unit discharges by individual interneurons in all hippocampal subregions revealed that many displayed an abrupt pause in firing around the time of seizure onset, and a second more gradually developing and longer lasting reduction in firing rate that occurred later in the seizure. Figure 10 shows an example from CA1 in which the firing rate of the interneuron slows immediately after seizure onset (Fig. 10A1,A4, arrow). Then, firing resumes for the next ∼30 s, during which time seizure activity grows in amplitude. As seizure activity builds further, the firing rate of the interneuron declines, eventually reaching zero, where it remains for ∼15 s until seizure activity begins to wane (Fig. 10A3,A6).
To quantify seizure-related interneuron inactivation, drops in firing frequency were measured as a percentage of the maximum firing rate during 4 s bins that began 8 s before seizure onset and extended until seizure termination. Firing rates were normalized by the maximum in any of the bins. First, seizures were evaluated for a reduction in firing rate that occurred over a period of ≤12 s that exceeded 0.3 times the maximum firing rate. In other words, the magnitude of the firing rate drop was at least 30% of the maximum rate. Firing rate drops were detected 49% of the time that an interneuron was recorded during a seizure (562 of 1155 occasions), and the bin centered at 2 s before seizure onset was most frequently the onset (i.e., the peak before the drop; Fig. 10B). (The number of seizures listed here, 1155, is greater than the number in Table 1 because multiple interneurons were recorded simultaneously during some seizures.) Next, those seizures that displayed an early drop in firing rate detected after the first analysis were screened for a second, later and longer, drop that occurred over a period of ≤20 s and exceeded 0.3 times the maximum firing rate. Second drops in firing rate were common (558 of 562 seizures, 99% of seizures with a first drop) and began most frequently 14 s after seizure onset. Seizures that displayed both early and late drops in firing rate were included for further analysis. The proportions of interneurons displaying drops in firing rate were similar in all hippocampal subregions, so data were combined. Average group data revealed that the early drop in firing frequency had an amplitude of 75 ± 1% (range, 30–100%) of the maximum firing rate and duration of 9.3 ± 0.2 s (range, 4–56 s; Fig. 10C). The second drop in firing rate had an average amplitude of 68 ± 1% (range, 30–100%) and an average duration of 19.5 ± 0.5 s (range, 4–80 s).
To determine whether interneurons with specific characteristics were more or less likely to inactivate during seizures, those with significant early and late drops in firing rate were categorized with respect to preictal activity. Preictal-increase interneurons accounted for 54% of cases (306 of 562 cases), preictal-decrease neurons accounted for 8% (55 of 562 cases), and 36% were unchanged (201 of 562 cases). Those proportions were not significantly different from the distribution of preictal firing types in the entire sample (p = 0.33, χ2 test). Theta-on interneurons accounted for 80% of the cases (450 of 562 cases) with seizure-related firing rate drops, and theta-off cells accounted for 20% (112 of 562 cases). Again, those proportions were not significantly different from the distribution in the entire sample (p = 0.99, χ2 test). These findings suggest that seizure-related inactivation of interneurons was not related to their firing patterns preictally or during theta activity.
To test whether seizure-related drops in interneuron firing rate might be attributable to depolarization block, action potential amplitudes were plotted. Action potential amplitudes were measured by binning (4 s), averaging, and normalizing values from each interneuron to its baseline average (10–5 min before seizure onset). Then, data from interneurons in all hippocampal regions were averaged (Fig. 10C). During the first drop in firing rate, the average normalized spike amplitude remained stable, starting at 0.996 and ending at 0.990 (99% of the initial value). In contrast, during the second drop in firing rate, the average normalized spike amplitude declined from 0.993 to 0.935 (94% of the initial value) and continued to decline to a minimum of 0.908 (91% of the initial value). The time course of the average drop in spike amplitude paralleled that of the average second drop in firing rate. An example of a coincident drop in interneuron firing rate and action potential amplitude is shown in Figure 10A4–A6. These findings suggest that depolarization block might have contributed to the second drop in firing rate that occurred later in the seizure but not to the initial, shorter pause in firing that occurred near seizure onset.
To test for potential correlations between action potential amplitude or firing rate with seizure activity, seizure amplitudes were measured by high-pass filtering (>10 Hz) local field potentials and calculating the rms in 4 s bins. The average seizure amplitude was small at onset, remained small for ∼6 s, increased over the next 16 s, then remained high until seizure termination (Fig. 10C). The average seizure amplitude began increasing at the end of the first pause in interneuron firing rate, when the average action potential amplitude remained high, near baseline values. Seizure activity continued to increase dramatically as the second drop in interneuron firing rate and the reduction in action potential amplitude began. These findings revealed that the first period of interneuron inactivation preceded the onset of increased seizure activity, and that seizure amplitude began increasing before the interneuron action potential amplitude began to decline and firing rate began to drop for a second time.
Interneuron identity
Hippocampal interneurons consist of various classes defined by morphological, neurochemical, circuit, and functional characteristics (Freund and Buzsáki, 1996; Klausberger and Somogyi, 2008). To test whether preictal and seizure-related activity patterns correlated with specific interneuron classes or not, unit data and local field potential recordings were evaluated in an attempt to classify individual interneurons. Analysis was restricted to CA1 interneurons, because they have been characterized most thoroughly and verified most completely with corresponding anatomy (Somogyi et al., 2014). CA1 interneuron types were identified based on action potential firing characteristics, especially during theta waves (Czurkó et al., 2011) and sharp waves (Csicsvari et al., 1999).
Sharp waves usually are detected by identifying associated ripples (130–230 Hz). However, action potentials of neurons targeted for recording could have confounded ripple detection (Schomburg et al., 2012), so in the present study sharp waves were detected by amplitude and duration criteria instead. To focus on sharp waves and minimize the inclusion of interictal spikes, which are reported to be briefer, durations were limited to 40–100 ms (Buzsáki et al., 1989). Sharp-wave polarity was either positive or negative depending on the position of a tetrode with respect to strata in CA1. After automated detection, only the clearest sharp-wave examples were selected for further analysis of sharp wave-related firing rate and probability of firing of each CA1 interneuron.
Of the 30 interneurons recorded in CA1, 7 had characteristics that most clearly suggested they belonged to a previously described interneuron class (Table 3). All had spike symmetry indices close to 1 and firing rates of >4 Hz measured during NSNT periods, which were features shared by all of the interneurons included in the present study (Fig. 3). Two cells matched previously described bistratified interneurons (Klausberger et al., 2004; Katona et al., 2014). Both were recorded in the CA1 pyramidal cell layer during four and six seizures each. Theta oscillations typically are standardized so that the negative trough of the local field potential recorded in stratum oriens or stratum pyramidale is set to phase 0° (or 360°) (Klausberger and Somogyi, 2008). The preferred phases of firing of putative bistratified cells were near the trough of theta (9° and 351°), and they discharged extensively during sharp waves (Fig. 11A), as follows: 25 and 39 Hz, 2.0 and 5.1 ratios of firing during sharp waves versus NSNT periods, and 0.72 and 0.89 probability for firing during sharp waves. Both putative bistratified cells were theta-on (1.6 and 1.7 ratio of firing during theta vs NSNT), fired significantly faster than baseline beginning 85 and 160 s before seizure onset (Fig. 11B), and displayed an abrupt pause in firing around the onset of all seizures. One displayed a later drop in firing rate during all seizures, the other during half of the seizures.
Table 3.
Characteristics of putatively identified CA1 interneurons
| Putative cell type | Bistratified-1 | Bistratified-2 | OLM-1 | OLM-2 | PV-BC-1 | PV-BC-2 | Ivy |
|---|---|---|---|---|---|---|---|
| Stratum | Pyramidale | Pyramidale | Pyramidale | Oriens | Pyramidale | Oriens | Pyramidale |
| Spike symmetry | 0.89 | 0.77 | 0.88 | 0.97 | 0.90 | 0.87 | 1.02 |
| NSNT firing rate (Hz) | 19.6 | 4.9 | 16.7 | 10.2 | 6.1 | 12.3 | 5.6 |
| Theta firing rate (Hz) | 30.8 | 8.2 | 27.1 | 9.8 | 14.3 | 10.5 | 4.1 |
| Theta/NSNT firing rate ratio | 1.6 | 1.7 | 1.6 | 1.0 | 2.4 | 0.9 | 0.7 |
| Theta angle (°) | 9 | 351 | 315 | 27 | 261 | 297 | 81 |
| Rayleigh value | 0.00 | 0.17 | 0.00 | 0.35 | 0.01 | 0.03 | 0.01 |
| SW firing rate (Hz) | 39.2 | 25.1 | 11.1 | 9.1 | 39.5 | 36.3 | 7.2 |
| SW/NSNT firing rate ratio | 2.0 | 5.1 | 0.7 | 0.9 | 6.5 | 3.0 | 1.3 |
| Probability of spiking during a sharp wave | 0.89 | 0.72 | 0.46 | 0.48 | 0.94 | 0.83 | 0.31 |
| Spike amplitude (μV) | 128 | 173 | 140 | 93 | 167 | 157 | 111 |
| Spike width (ms) | 0.15 | 0.15 | 0.21 | 0.18 | 0.21 | 0.18 | 0.18 |
PV-BC, Parvalbumin-positive basket cell; SW, sharp wave.
Figure 11.

Preictal activity patterns of putatively identified CA1 interneuron types. A1, A2, Interneuron types were identified based on theta phase preference (A1) and firing characteristics during sharp waves (A2). Putative bistratified (bistrat.), parvalbumin-positive basket cells (PV-BC), OLM cells, and an ivy cell were identified. Traces are local field potentials (top) and unit activity (bottom). A1, In theta-phase plots, red dashed vertical lines indicate positive peaks of the local field potential recorded in stratum oriens or pyramidale. Spike counts from 0° to 360° are duplicated through 720° for ease of viewing. A2, Zero is the peak amplitude of the sharp wave in the histograms. B, Preictal firing rate histograms of two putative bistratified neurons, OLM cells, PV-BCs, and an ivy cell. Cells in the top row correspond to cells in A. Horizontal cyan lines indicate the average baseline firing rate during the 10-5 min period before seizure onset. Error bars indicate SEM. Coloring indicates bars closely approaching seizure onset that are >2 SDs from the baseline average: magenta indicates higher than average, and blue indicates lower than average.
Two other cells resembled previously described oriens lacunosum moleculare (OLM) interneurons (Klausberger et al., 2003; Varga et al., 2012; Forro et al., 2013; Katona et al., 2014). One cell was recorded in stratum oriens, and the other in the CA1 pyramidal cell layer. They were recorded during five and seven seizures each. Like bistratified cells, their preferred phase of firing was approximately near the trough of theta frequency (27° and 315°), but, in contrast, their firing rate either decreased or changed little during sharp waves (Fig. 11A), as follows: 0.7 and 0.9 ratio of firing during sharp waves versus NSNT periods, and 0.46 and 0.48 probability of firing during sharp waves. Both putative OLM cells were classified as theta-on interneurons, but their firing rates did not change significantly before seizure onset (Fig. 11B). Both displayed an abrupt pause around onset and a later drop in firing rate during most (>70%) seizures.
Another two CA1 interneurons matched previously described parvalbumin-positive basket cells (Klausberger et al., 2003; Lapray et al., 2012; Varga et al., 2012; Forro et al., 2013). One interneuron was recorded in stratum oriens, and the other in the CA1 pyramidal cell layer during 11 and 12 seizures each. They fired preferentially on the descending phase of theta waves (261° and 297°) and discharged extensively during sharp waves (Fig. 11A), as follows: 36 and 40 Hz, 3.0 and 6.5 ratios of firing during sharp waves versus NSNT periods, and 0.83 and 0.94 probability for firing during sharp waves. One putative parvalbumin-positive basket cell was classified as theta-on (2.4 ratio of firing during theta activity vs NSNT), and its average firing rate increased significantly above baseline beginning 85 s before seizure onset (Fig. 11B, top). This cell displayed an early abrupt pause and a later drop in firing rate during all seizures. The other cell rarely displayed an abrupt early pause around seizure onset (9% of seizures), and its later drops in firing rate were more gradual than most other interneurons. It was classified as theta-off (0.9 ratio of firing during theta activity vs NSNT). Its average firing rate increased significantly above baseline beginning 125 s before seizure onset, then dropped significantly below baseline from 40 to 5 s before seizure onset (Fig. 11B, bottom).
Finally, one CA1 interneuron resembled previously described ivy cells (Fuentealba et al., 2008; Lapray et al., 2012). It was recorded in the CA1 pyramidal cell layer during 11 seizures, had a low NSNT firing rate (5.6 Hz), fired preferentially on the ascending phase of the theta wave (81°), and did not discharge much during sharp waves (Fig. 11A), as follows: 7.2 Hz, 1.3 ratio of firing during sharp waves versus NSNT periods, and 0.31 probability for firing during sharp waves. It was classified as a theta-off cell (0.7 ratio of firing during theta activity vs NSNT), and its average firing rate decreased significantly 35–25 s and 20–5 s before seizure onset (Fig. 11B). This cell displayed an abrupt early pause in firing around the onset of all seizures and a later drop during most (73%) seizures.
Discussion
The principal findings of the present study are the following. Most interneurons in the dentate gyrus, CA1, and subiculum, and some in CA3 changed their firing rate seconds to minutes before spontaneous seizures in epileptic pilocarpine-treated rats. On an individual interneuron basis, most preictal changes were significantly consistent across seizures. Of those interneurons whose activity changed preictally, most became more active, especially in the subiculum. A substantial proportion of CA1 interneurons became less active beginning, on average, >30 s before seizure onset. Activity that increased or decreased preictally correlated with whether interneurons fired faster or more slowly, respectively, during theta activity. Theta waves were more likely to occur before seizure onset, and theta-correlated increased preictal firing was common in subicular interneurons. Preictal changes by interneurons in CA1, CA3, and the dentate gyrus were largely independent of theta activity. Decreased preictal activity was not specifically associated with reduced action potential amplitude. Near seizure onset, many hippocampal interneurons displayed a brief pause in firing that was not associated with a change in action potential amplitude. Later, during the seizure, another longer lasting reduction in firing rate occurred, which was associated with reduced action potential amplitude. Seizure amplitude increased dramatically near the end of the initial, brief pause in interneuron activity before the second period of interneuron inactivity and declining action potential amplitude. Identifying CA1 interneuron subtypes based on firing characteristics during theta and sharp waves suggested putative bistratified cells and a parvalbumin-positive basket cell, but not oriens lacunosum moleculare interneurons, were activated preictally, whereas an ivy cell and another parvalbumin-positive basket cell were inactivated before seizure onset.
Preictal activation of interneurons
Preictal activation of interneurons began earliest, increased maximally, and was most prevalent in the subiculum. Preictal activation of subicular interneurons coincided with preictal theta waves and disappeared after excluding seizures with preictal theta waves, suggesting common mechanisms. If activated subicular interneurons inhibited principal cells, these findings are consistent with an anti-seizure role for theta activity (Miller et al., 1994; Colom et al., 2006). In contrast, theta activity also has been proposed to be proseizure (Kitchigina and Butuzova, 2009; Grasse et al., 2013; Sedigh-Sarvestani et al., 2014), and some subicular principal cells have reversed chloride gradients, which renders them susceptible to depolarizing responses to GABAA receptor activation (Cohen et al., 2002; Knopp et al., 2005, 2008; Huberfeld et al., 2007). Hence, the consequences of preictal activation of subicular interneurons are unclear. Principal neurons in the subiculum increase or do not change their firing rate preictally (Fujita et al., 2014), suggesting that subicular interneurons might not be inhibiting principal cells effectively at that time.
In CA1 and the dentate gyrus, 15–18% of principal neurons display reduced preictal activity (Fujita et al., 2014), which is consistent with inhibition by interneurons. Unlike the subiculum, preictal increased activity of interneurons in CA1, CA3, and the dentate gyrus was independent of preictal theta waves. Nevertheless, there was an intriguing correlation between cells whose activity increased preictally and during theta activity. The non-theta sources of preictal activation are unclear, but the possibilities include afferents and local principal cells. The average activity of excitatory neurons in the subiculum, CA1, and dentate gyrus increases beginning 2–4 min before seizure onset (Fujita et al., 2014), which makes local principal cells a likely source of synaptic activation of interneurons during preictal periods. Interestingly, both principal cells and interneurons in CA3 display little, if any, preictal change in average firing rate (Grasse et al., 2013), suggesting that some hippocampal subregions are more important and others are less important in generating spontaneous seizures.
Seizure activity in neocortex evokes surround inhibition (Prince and Wilder, 1967; Schevon et al., 2012) that is generated by feedforward activation of interneurons (Trevelyan et al., 2006; Cammarota et al., 2013). However, the time scale is much shorter than that found in the present study. Many seizures in epileptic pilocarpine-treated rats initiate in the ventral hippocampus and subiculum (Toyoda et al., 2013). Therefore, most seizures in the present study probably began elsewhere and propagated into the right, dorsal hippocampus, where recordings were obtained. It takes <7 s on average for seizure activity to spread throughout the rat brain, and preictal activity of interneurons in the dentate gyrus, CA1, and subiculum increased significantly beginning more than a minute before seizure onset. Therefore, seizure activity outside of the recording site cannot account for preictal changes in interneuron firing rate. Interneuron activation associated with seizures provoked by tetanic stimulation, GABAA receptor antagonism, low magnesium levels, or potassium channel blockade (see Introduction) also occurs at a shorter time scale than the seconds-to-minutes-long preictal build up described in the present study.
The overall effect of the increased preictal activity of interneurons is likely to be the inhibition of principal cells, despite impending seizure activity and evidence of preictal activation of principal cells (Fujita et al., 2014). Increased interneuron activity is consistent with previous reports of increased preictal inhibition in the dentate gyrus (Bragin et al., 2005; Queiroz et al., 2009). According to this scenario, neuronal activity builds over the minutes preceding a seizure, and interneurons attempt to suppress the hyperactivity but ultimately fail. Limited samples of putatively identified CA1 interneurons suggest that bistratified cells and a parvalbumin-positive basket cell, but not OLM cells and an ivy cell, were activated preictally. Bistratified cells inhibit CA1 pyramidal cell dendrites that receive glutamatergic Schaffer collateral/commissural input (Klausberger et al., 2004; Lovett-Barron et al., 2012), and parvalbumin-positive basket cells inhibit pyramidal cell somata.
Preictal inactivation of interneurons
Surprisingly, some interneurons in CA1 and the dentate gyrus inactivated before seizure onset. Firing rates of a putative parvalbumin-positive basket cell and ivy cell in CA1 dropped before seizure onset. Ivy cells provide widespread synaptic and extrasynaptic slow inhibition of CA1 pyramidal cell dendrites that receive glutamatergic Schaffer collateral/commissural input (Fuentealba et al., 2008; Lapray et al., 2012). Impairment of slow dendritic inhibition is associated with transitions to seizure activity (Wendling et al., 2002). If this single putative ivy cell is representative, the effect of decreased preictal activity might be important, in part because they are the most abundant GABAergic interneurons in CA1.
Interneurons displayed a correlation between decreased activity preictally and decreased activity during theta activity. Nevertheless, preictal inactivation occurred even without theta activity. The mechanism of preictal inactivation did not appear to be depolarization block, because spike amplitude reductions were minor and not specific to interneurons with decreased preictal activity. Another possible mechanism of interneuron inactivation is synaptic inhibition by other interneurons (Gulyás et al., 2003; Liu et al., 2014; Tyan et al., 2014). The consequences of preictal inactivation might be important, especially if interneurons are attempting to control hyperactivity as seizures approach.
Ictal inactivation of interneurons
The average firing rates of interneurons were unexpectedly reduced during seizures. Reduced unit activity during seizures might be an artifact, because spike-sorting methods make false-negative results probable during periods of high activity (Henze et al., 2000; Cymerblit-Sabba and Schiller, 2012). Therefore, single-unit firing rate data during seizures should be interpreted with caution. Acknowledging this caveat, many interneurons in all hippocampal regions appeared to briefly pause near seizure onset, then resume activity and gradually reduce firing rate a second time later in the seizure. The initial pause typically followed a burst of interneuron activity, which also occurs in a bicuculline model of seizures (Gnatkovsky et al., 2008). The mechanism underlying the initial pause is unclear. Depolarization block seems unlikely because spike amplitudes did not change appreciably. The consequences of the initial pause are unclear, but it might contribute to increasing seizure amplitude. In contrast, the later second drop in firing rate followed the onset of increasing seizure amplitude and coincided with declining action potential amplitudes. High levels of activity cause cell swelling and shrink extracellular space (Dietzel et al., 1980), which might alter unit recordings and spike amplitudes. Another possibility is depolarization block resulting from elevated extracellular potassium ion concentrations that occur during seizures (Somjen and Giacchino, 1985) and affect hippocampal interneurons (Shin et al., 2010), which may be more susceptible to depolarization block than pyramidal cells (Ziburkus et al., 2006). If so, there may be a vicious cycle of seizure activity reducing interneuron activity, which promotes more seizure activity. Consistent with that possibility, tetanic stimulation of the perforant path reduces interneuron action potential amplitude and activity, and increases seizure amplitude (Bragin et al., 1997). Consistent with a role of interneuron control of seizure progression, optogenetic activation of interneurons curtails seizures (Krook-Magnuson et al., 2013).
In summary, these findings suggest that interneurons frequently inactivate, perhaps by depolarization block late in a seizure, and briefly pause firing by an unknown mechanism around seizure onset. Preictally, many interneurons fire progressively faster, as do many excitatory neurons (Fujita et al., 2014). However, substantial numbers of interneurons, especially in CA1, failed to activate or inactivated at the critical time preceding seizure onset, suggesting the hypothesis that ictogenesis in temporal lobe epilepsy might be caused in part by inadequate preictal activation of interneurons.
Footnotes
This research was supported by the Epilepsy Foundation, and the National Institute of Neurological Disorders and Stroke and Office of the Director of the National Institutes of Health. We thank Kasen Riemersma for assistance with data acquisition.
The authors declare no competing financial interests.
References
- Avoli M, de Curtis M. GABAergic synchronization in the limbic system and its role in the generation of epileptiform activity. Prog Neurobiol. 2011;95:104–132. doi: 10.1016/j.pneurobio.2011.07.003. [DOI] [PMC free article] [PubMed] [Google Scholar]
- Ben-Ari Y, Krnjević, Reinhardt W. Hippocampal seizures and failure of inhibition. Can J Physiol Pharmacol. 1979;57:1462–1466. doi: 10.1139/y79-218. [DOI] [Google Scholar]
- Bland BH, Konopacki J, Dyck RH. Relationship between membrane potential oscillations and rhythmic discharges in identified hippocampal theta-related cells. J Neurophysiol. 2002;88:3046–3066. doi: 10.1152/jn.00315.2002. [DOI] [PubMed] [Google Scholar]
- Bower MR, Buckmaster PS. Changes in granule cell firing rates precede locally recorded spontaneous seizures by minutes in an animal model of temporal lobe epilepsy. J Neurophysiol. 2008;99:2431–2442. doi: 10.1152/jn.01369.2007. [DOI] [PubMed] [Google Scholar]
- Bragin A, Csicsvári J, Penttonen M, Buzsáki G. Epileptic afterdischarge in the hippocampal-entorhinal system: current source density and unit studies. Neuroscience. 1997;76:1187–1203. doi: 10.1016/S0306-4522(96)00446-0. [DOI] [PubMed] [Google Scholar]
- Bragin A, Azizyan A, Almajano J, Wilson CL, Engel J., Jr Analysis of chronic seizure onsets after intrahippocampal kainic acid injection in freely moving rats. Epilepsia. 2005;46:1592–1598. doi: 10.1111/j.1528-1167.2005.00268.x. [DOI] [PubMed] [Google Scholar]
- Brooks-Kayal AR, Shumate MD, Jin H, Rikhter TY, Coulter DA. Selective changes in single cell GABA(A) receptor expression and function in temporal lobe epilepsy. Nat Med. 1998;4:1166–1172. doi: 10.1038/2661. [DOI] [PubMed] [Google Scholar]
- Butuzova MV, Kitchigina VF. Repeated blockade of GABAA receptors in the medial septal region induces epileptiform activity in the hippocampus. Neurosci Lett. 2008;434:133–138. doi: 10.1016/j.neulet.2008.01.050. [DOI] [PubMed] [Google Scholar]
- Buzsáki G, Ponomareff GL, Bayardo F, Ruiz R, Gage FH. Neuronal activity in the subcortically denervated hippocampus: a chronic model for epilepsy. Neuroscience. 1989;28:527–538. doi: 10.1016/0306-4522(89)90002-X. [DOI] [PubMed] [Google Scholar]
- Cammarota M, Losi G, Chiavegato A, Zonta M, Carmignoto G. Fast spiking interneuron control of seizure propagation in a cortical slice model of focal epilepsy. J Physiol. 2013;591:807–822. doi: 10.1113/jphysiol.2012.238154. [DOI] [PMC free article] [PubMed] [Google Scholar]
- Chauvière L, Rafrafi N, Thinus-Blanc C, Bartolomei F, Esclapez M, Bernard C. Early deficits in spatial memory and theta rhythm in experimental temporal lobe epilepsy. J Neurosci. 2009;29:5402–5410. doi: 10.1523/JNEUROSCI.4699-08.2009. [DOI] [PMC free article] [PubMed] [Google Scholar]
- Cohen I, Navarro V, Clemenceau S, Baulac M, Miles R. On the origin of interictal activity in human temporal lobe epilepsy in vitro. Science. 2002;298:1418–1421. doi: 10.1126/science.1076510. [DOI] [PubMed] [Google Scholar]
- Colom LV, García-Hernández A, Castañeda MT, Perez-Cordova MG, Garrido-Sanabria ER. Septo-hippocampal networks in chronically epileptic rats: potential antiepileptic effects of theta rhythm generation. J Neurophysiol. 2006;95:3645–3653. doi: 10.1152/jn.00040.2006. [DOI] [PubMed] [Google Scholar]
- Csicsvari J, Hirase H, Czurkó A, Mamiya A, Buzsáki G. Oscillatory coupling of hippocampal pyramidal cells and interneurons in the behaving rat. J Neurosci. 1999;19:274–287. doi: 10.1523/JNEUROSCI.19-01-00274.1999. [DOI] [PMC free article] [PubMed] [Google Scholar]
- Cymerblit-Sabba A, Schiller Y. Development of hypersynchrony in the cortical network during chemoconvulsant-induced epileptic seizures in vivo. J Neurophysiol. 2012;107:1718–1730. doi: 10.1152/jn.00327.2011. [DOI] [PubMed] [Google Scholar]
- Czurkó A, Huxter J, Li Y, Hangya B, Muller RU. Theta phase classification of interneurons in the hippocampal formation of freely moving rats. J Neurosci. 2011;31:2938–2947. doi: 10.1523/JNEUROSCI.5037-10.2011. [DOI] [PMC free article] [PubMed] [Google Scholar]
- de Lanerolle NC, Kim JH, Robbins RJ, Spencer DD. Hippocampal interneuron loss and plasticity in human temporal lobe epilepsy. Brain Res. 1989;495:387–395. doi: 10.1016/0006-8993(89)90234-5. [DOI] [PubMed] [Google Scholar]
- Derchansky M, Jahromi SS, Mamani M, Shin DS, Sik A, Carlen PL. Transition to seizures in the isolated immature mouse hippocampus: a switch from dominant phasic inhibition to dominant phasic excitation. J Physiol. 2008;586:477–494. doi: 10.1113/jphysiol.2007.143065. [DOI] [PMC free article] [PubMed] [Google Scholar]
- Dichter M, Spencer WA. Penicillin-induced interictal discharges from the cat hippocampus. II. Mechanisms underlying origin and restriction. J Neurophysiol. 1969;32:663–687. doi: 10.1152/jn.1969.32.5.663. [DOI] [PubMed] [Google Scholar]
- Dietzel I, Heinemann U, Hofmeier G, Lux HD. Transient changes in the size of the extracellular space in the sensorimotor cortex of cats in relation to stimulus-induced changes in potassium concentration. Exp Brain Res. 1980;40:432–439. doi: 10.1007/BF00236151. [DOI] [PubMed] [Google Scholar]
- Ellender TJ, Raimondo JV, Irkle A, Lamsa KP, Akerman CJ. Excitatory effects of parvalbumin-expressing interneurons maintain hippocampal epileptiform activity via synchronous afterdischarges. J Neurosci. 2014;34:15208–15222. doi: 10.1523/JNEUROSCI.1747-14.2014. [DOI] [PMC free article] [PubMed] [Google Scholar]
- Finch DM, Babb TL. Response decrement in a hippocampal basket cell. Brain Res. 1977;130:354–559. doi: 10.1016/0006-8993(77)90282-7. [DOI] [PubMed] [Google Scholar]
- Forro T, Valenti O, Lasztoczi B, Klausberger T. Temporal organization of GABAergic interneurons in the intermediate CA1 hippocampus during network oscillations. Cereb Cortex. 2013 doi: 10.1093/cercor/bht316. doi: 10.1093/cercor/bht316. Advance online publication. Retrieved March 22, 2015. [DOI] [PubMed] [Google Scholar]
- Fox SE, Ranck JB., Jr Localization and anatomical identification of theta and complex spike cells in dorsal hippocampal formation of rats. Exp Neurol. 1975;49:299–313. doi: 10.1016/0014-4886(75)90213-7. [DOI] [PubMed] [Google Scholar]
- Freund TF, Buzsáki G. Interneurons of the hippocampus. Hippocampus. 1996;6:347–470. doi: 10.1002/(SICI)1098-1063(1996)6:4<347::AID-HIPO1>3.0.CO;2-I. [DOI] [PubMed] [Google Scholar]
- Fuentealba P, Begum R, Capogna M, Jinno S, Márton LF, Csicsvari J, Thomson A, Somogyi P, Klausberger T. Ivy cells: a population of nitric-oxide-producing, slow-spiking GABAergic neurons and their involvement in hippocampal network activity. Neuron. 2008;57:917–929. doi: 10.1016/j.neuron.2008.01.034. [DOI] [PMC free article] [PubMed] [Google Scholar]
- Fujita S, Toyoda I, Thamattoor AK, Buckmaster PS. Preictal activity of subicular, CA1, and dentate gyrus principal neurons before spontaneous seizures in a rat model of temporal lobe epilepsy. J Neurosci. 2014;34:16671–16687. doi: 10.1523/JNEUROSCI.0584-14.2014. [DOI] [PMC free article] [PubMed] [Google Scholar]
- Fujiwara-Tsukamoto Y, Isomura Y, Nambu A, Takada M. Excitatory GABA input directly drives seizure-like rhythmic synchronization in mature hippocampal CA1 pyramidal cells. Neuroscience. 2003;119:265–275. doi: 10.1016/S0306-4522(03)00102-7. [DOI] [PubMed] [Google Scholar]
- Fujiwara-Tsukamoto Y, Isomura Y, Kaneda K, Takada M. Synaptic interactions between pyramidal cells and interneurone subtypes during seizure-like activity in the rat hippocampus. J Physiol. 2004;557:961–979. doi: 10.1113/jphysiol.2003.059915. [DOI] [PMC free article] [PubMed] [Google Scholar]
- Fujiwara-Tsukamoto Y, Isomura Y, Imanishi M, Ninomiya T, Tsukada M, Yanagawa Y, Fukai T, Takada M. Prototypic seizure activity driven by mature hippocampal fast-spiking interneurons. J Neurosci. 2010;30:13679–13689. doi: 10.1523/JNEUROSCI.1523-10.2010. [DOI] [PMC free article] [PubMed] [Google Scholar]
- Gnatkovsky V, Librizzi L, Trombin F, de Curtis M. Fast activity at seizure onset is mediated by inhibitory circuits in the entorhinal cortex in vitro. Ann Neurol. 2008;64:674–686. doi: 10.1002/ana.21519. [DOI] [PubMed] [Google Scholar]
- Grasse DW, Karunakaran S, Moxon KA. Neuronal synchrony and the transition to spontaneous seizures. Exp Neurol. 2013;248:72–84. doi: 10.1016/j.expneurol.2013.05.004. [DOI] [PubMed] [Google Scholar]
- Gulyás AI, Hájos N, Katona I, Freund TF. Interneurons are the local targets of hippocampal inhibitory cells which project to the medial septum. Eur J Neurosci. 2003;17:1861–1872. doi: 10.1046/j.1460-9568.2003.02630.x. [DOI] [PubMed] [Google Scholar]
- Harris KD, Henze DA, Csicsvari J, Hirase H, Buzsaki G. Accuracy of tetrode spike separation as determined by simultaneous intracellular and extracellular measurements. J Neurophysiol. 2000;84:401–414. doi: 10.1152/jn.2000.84.1.401. [DOI] [PubMed] [Google Scholar]
- Hellier JL, Dudek FE. Spontaneous motor seizures in rats with kainate-induced epiilepsy: effect of time of day and activity state. Epilepsy Res. 1999;35:47–57. doi: 10.1016/S0920-1211(98)00127-2. [DOI] [PubMed] [Google Scholar]
- Henze DA, Borhegyi Z, Csicsvari J, Mamiya A, Harris KD, Buzsáki G. Intracellular features predicted by extracellular recordings in the hippocampus in vivo. J Neurophysiol. 2000;84:390–400. doi: 10.1152/jn.2000.84.1.390. [DOI] [PubMed] [Google Scholar]
- Higashima M, Kinoshita H, Yamaguchi N, Koshino Y. Activation of GABAergic function necessary for afterdischarge generation in rat hippocampal slices. Neurosci Lett. 1996;207:101–104. doi: 10.1016/0304-3940(96)12496-4. [DOI] [PubMed] [Google Scholar]
- Hille B. Ionic channels of excitable membranes. Sunderland, MA: Sinauer; 1992. pp. 42–44. [Google Scholar]
- Huberfeld G, Wittner L, Clemenceau S, Baulac M, Kaila K, Miles R, Rivera C. Perturbed chloride homeostasis and GABAergic signaling in human temporal lobe epilepsy. J Neurosci. 2007;27:9866–9873. doi: 10.1523/JNEUROSCI.2761-07.2007. [DOI] [PMC free article] [PubMed] [Google Scholar]
- Inostroza M, Brotons-Mas JR, Laurent F, Cid E, de la Prida LM. Specific impairment of “what-where-when” episodic-like memory in experimental models of temporal lobe epilepsy. J Neurosci. 2013;33:17749–17762. doi: 10.1523/JNEUROSCI.0957-13.2013. [DOI] [PMC free article] [PubMed] [Google Scholar]
- Jung MW, McNaughton BL. Spatial selectivity of unit activity in the hippocampal granular layer. Hippocampus. 1993;3:165–182. doi: 10.1002/hipo.450030209. [DOI] [PubMed] [Google Scholar]
- Katona L, Lapray D, Viney TJ, Oulhaj A, Borhegyi Z, Micklem BR, Klausberger T, Somogyi P. Sleep and movement differentiates actions of two types of somatostatin-expressing GABAergic interneuron in rat hippocampus. Neuron. 2014;82:872–886. doi: 10.1016/j.neuron.2014.04.007. [DOI] [PMC free article] [PubMed] [Google Scholar]
- Kitchigina VF, Butuzova MV. Theta activity of septal neurons during different epileptic phases: the same frequency but different significance? Exp Neurol. 2009;216:449–458. doi: 10.1016/j.expneurol.2009.01.001. [DOI] [PubMed] [Google Scholar]
- Klausberger T, Somogyi P. Neuronal diversity and temporal dynamics: the unity of hippocampal circuit operations. Science. 2008;321:53–57. doi: 10.1126/science.1149381. [DOI] [PMC free article] [PubMed] [Google Scholar]
- Klausberger T, Magill PJ, Márton LF, Roberts JD, Cobden PM, Buzsáki G, Somogyi P. Brain-state- and cell-type-specific firing of hippocampal interneurons in vivo. Nature. 2003;421:844–848. doi: 10.1038/nature01374. [DOI] [PubMed] [Google Scholar]
- Klausberger T, Márton LF, Baude A, Roberts JD, Magill PJ, Somogyi P. Spike timing of dendrite-targeting bistratified cells during hippocampal network oscillations in vivo. Nat Neurosci. 2004;7:41–47. doi: 10.1038/nn1159. [DOI] [PubMed] [Google Scholar]
- Knopp A, Kivi A, Wozny C, Heinemann U, Behr J. Cellular and network properties of the subiculum in the pilocarpine model of temporal lobe epilepsy. J Comp Neurol. 2005;483:476–488. doi: 10.1002/cne.20460. [DOI] [PubMed] [Google Scholar]
- Knopp A, Frahm C, Fidzinski P, Witte OW, Behr J. Loss of GABAergic neurons in the subiculum and its functional implications in temporal lobe epilepsy. Brain. 2008;131:1516–1527. doi: 10.1093/brain/awn095. [DOI] [PubMed] [Google Scholar]
- Kogure S. Simultaneous recordings from two types of hippocampal nonpyramidal cells during electrically induced paroxysmal discharges. Exp Neurol. 1987;95:763–767. doi: 10.1016/0014-4886(87)90315-3. [DOI] [PubMed] [Google Scholar]
- Konopacki J, Bland BH, Colom LV, Oddie SD. In vivo intracellular correlates of hippocampal formation theta-on and theta-off cells. Brain Res. 1992;586:247–255. doi: 10.1016/0006-8993(92)91633-P. [DOI] [PubMed] [Google Scholar]
- Krook-Magnuson E, Armstrong C, Oijala M, Soltesz I. On-demand optogenetic control of spontaneous seizures in temporal lobe epilepsy. Nat Comm. 2013;4:1376. doi: 10.1038/ncomms2376. [DOI] [PMC free article] [PubMed] [Google Scholar]
- Lapray D, Lasztoczi B, Lagler M, Viney TJ, Katona L, Valenti O, Hartwich K, Borhegyi Z, Somogyi P, Klausberger T. Behavior-dependent specialization of identified hippocampus interneurons. Nat Neurosci. 2012;15:1265–1271. doi: 10.1038/nn.3176. [DOI] [PMC free article] [PubMed] [Google Scholar]
- Lasztóczi B, Nyitrai G, Héja L, Kardos J. Synchronization of GABAergic inputs to CA3 pyramidal cells precedes seizure-like event onset in juvenile rat hippocampal slices. J Neurophysiol. 2009;102:2538–2553. doi: 10.1152/jn.91318.2008. [DOI] [PubMed] [Google Scholar]
- Lenck-Santini PP, Holmes GL. Altered phase precession and compression of temporal sequences by place cells in epileptic rats. J Neurosci. 2008;28:5053–5062. doi: 10.1523/JNEUROSCI.5024-07.2008. [DOI] [PMC free article] [PubMed] [Google Scholar]
- Lévesque M, Salami P, Gotman J, Avoli M. Two seizure-onset types reveal specific patterns of high-frequency oscillations in a model of temporal lobe epilepsy. J Neurosci. 2012;32:13264–13272. doi: 10.1523/JNEUROSCI.5086-11.2012. [DOI] [PMC free article] [PubMed] [Google Scholar]
- Liu YC, Cheng JK, Lien CC. Rapid dynamic changes of dendritic inhibition in the dentate gyrus by presynaptic activity patterns. J Neurosci. 2014;34:1344–1357. doi: 10.1523/JNEUROSCI.2566-13.2014. [DOI] [PMC free article] [PubMed] [Google Scholar]
- Lopantsev V, Avoli M. Participation of GABAA-mediated inhibition in ictallike discharges in the rat entorhinal cortex. J Neurophysiol. 1998;79:352–360. doi: 10.1152/jn.1998.79.1.352. [DOI] [PubMed] [Google Scholar]
- Lovett-Barron M, Turi GF, Kaifosh P, Lee PH, Bolze F, Sun XH, Nicoud JF, Zemelman BV, Sternson SM, Losonczy A. Regulation of neuronal input transformations by tunable dendritic inhibition. Nat Neurosci. 2012;15:423–430. S1–S3. doi: 10.1038/nn.3024. [DOI] [PubMed] [Google Scholar]
- Mathern GW, Babb TL, Pretorius JK, Leite JP. Reactive synaptogenesis and neuron densities for neuropeptide Y, somatostatin, and glutamate decarboxylase immunoreactivity in the epileptogenic human fascia dentata. J Neurosci. 1995;15:3990–4004. doi: 10.1523/JNEUROSCI.15-05-03990.1995. [DOI] [PMC free article] [PubMed] [Google Scholar]
- Miller JW, Turner GM, Gray BC. Anticonvulsant effects of the experimental induction of hippocampal theta activity. Epilepsy Res. 1994;18:195–204. doi: 10.1016/0920-1211(94)90040-X. [DOI] [PubMed] [Google Scholar]
- Mitchell SJ, Ranck JB., Jr Generation of theta rhythm in medial entorhinal cortex of freely moving rats. Brain Res. 1980;189:49–66. doi: 10.1016/0006-8993(80)90006-2. [DOI] [PubMed] [Google Scholar]
- Mizumori SJ, Barnes CA, McNaughton BL. Behavioral correlates of theta-on and theta-off cells recorded from hippocampal formation of mature young and aged rats. Exp Brain Res. 1990;80:365–373. doi: 10.1007/BF00228163. [DOI] [PubMed] [Google Scholar]
- Paxinos G, Watson C. The rat brain in stereotaxic coordinates. Burlington, MA: Elsevier/Academic; 2009. [Google Scholar]
- Perreault P, Avoli M. 4-Aminopyridine-induced epileptiform activity and a GABA-mediated long-lasting depolarization in the rat hippocampus. J Neurosci. 1992;12:104–115. doi: 10.1523/JNEUROSCI.12-01-00104.1992. [DOI] [PMC free article] [PubMed] [Google Scholar]
- Popova IY, Sinelnikova VV, Kitchigina VF. Disturbance of the correlation between hippocampal and septal EEGs during epileptogenesis. Neurosci Lett. 2008;442:228–233. doi: 10.1016/j.neulet.2008.07.016. [DOI] [PubMed] [Google Scholar]
- Prince DA, Wilder BJ. Control mechanisms in cortical epileptogenic foci. Arch Neurol. 1967;16:194–202. doi: 10.1001/archneur.1967.00470200082007. [DOI] [PubMed] [Google Scholar]
- Queiroz CM, Gorter JA, Lopes da Silva FH, Wadman WJ. Dynamics of evoked local field potentials in the hippocampus of epileptic rats with spontaneous seizures. J Neurophysiol. 2009;101:1588–1597. doi: 10.1152/jn.90770.2008. [DOI] [PubMed] [Google Scholar]
- Quesney LF. Clinical and EEG features of complex partial seizures of temporal lobe origin. Epilepsia. 1986;27(Suppl 2):S27–S45. doi: 10.1111/j.1528-1157.1986.tb05738.x. [DOI] [PubMed] [Google Scholar]
- Racine RJ. Modification of seizure activity by electrical stimulation. II. Motor seizure. Electroencephalogr Clin Neurophysiol. 1972;32:281–294. doi: 10.1016/0013-4694(72)90177-0. [DOI] [PubMed] [Google Scholar]
- Schevon CA, Weiss SA, McKhann G, Jr, Goodman RR, Yuste R, Emerson RG, Trevelyan AJ. Evidence of an inhibitory restraint of seizure activity in humans. Nat Comm. 2012;3:1060. doi: 10.1038/ncomms2056. [DOI] [PMC free article] [PubMed] [Google Scholar]
- Schomburg EW, Anastassiou CA, Buzsáki G, Koch C. The spiking component of oscillatory extracellular potentials in the rat hippocampus. J Neurosci. 2012;32:11798–11811. doi: 10.1523/JNEUROSCI.0656-12.2012. [DOI] [PMC free article] [PubMed] [Google Scholar]
- Schwartzkroin PA, Prince DA. Changes in excitatory and inhibitory synaptic potentials leading to epileptogenic activity. Brain Res. 1980;183:61–76. doi: 10.1016/0006-8993(80)90119-5. [DOI] [PubMed] [Google Scholar]
- Sedigh-Sarvestani M, Thuku GI, Sunderam S, Parkar A, Weinstein SL, Schiff SJ, Gluckman BJ. Rapid eye movement sleep and hippocampal theta oscillations precede seizure onset in the tetanus toxin model of temporal lobe epilepsy. J Neurosci. 2014;34:1105–1114. doi: 10.1523/JNEUROSCI.3103-13.2014. [DOI] [PMC free article] [PubMed] [Google Scholar]
- Shin DS, Yu W, Fawcett A, Carlen PL. Characterizing the persistent CA3 interneuronal spiking activity in elevated extracellular potassium in the young rat hippocampus. Brain Res. 2010;1331:39–50. doi: 10.1016/j.brainres.2010.03.023. [DOI] [PubMed] [Google Scholar]
- Sirota A, Montgomery S, Fujisawa S, Isomura Y, Zugaro M, Buzsáki G. Entrainment of neocortical neurons and gamma oscillations by the hippocampal theta rhythm. Neuron. 2008;60:683–697. doi: 10.1016/j.neuron.2008.09.014. [DOI] [PMC free article] [PubMed] [Google Scholar]
- Somjen GG, Giacchino JL. Potassium and calcium concentrations in interstitial fluid of hippocampal formation during paroxysmal responses. J Neurophysiol. 1985;53:1098–1108. doi: 10.1152/jn.1985.53.4.1098. [DOI] [PubMed] [Google Scholar]
- Somogyi P, Katona L, Klausberger T, Lasztóczi B, Viney TJ. Temporal redistribution of inhibition over neuronal subcellular domains underlies state-dependent rhythmic change of excitability in the hippocampus. Philos Trans R Soc Lond B Biol Sci. 2014;369:20120518. doi: 10.1098/rstb.2012.0518. [DOI] [PMC free article] [PubMed] [Google Scholar]
- Spencer SS, Williamson PD, Spencer DD, Mattson RH. Human hippocampal seizure spread studied by depth and subdural recording: the hippocampal commissure. Epilepsia. 1987;28:479–489. doi: 10.1111/j.1528-1157.1987.tb03676.x. [DOI] [PubMed] [Google Scholar]
- Sperling MR, O'Connor MJ. Comparison of depth and subdural electrodes in recording temporal lobe seizures. Neurology. 1989;39:1497–1504. doi: 10.1212/WNL.39.11.1497. [DOI] [PubMed] [Google Scholar]
- Timofeev I, Grenier F, Steriade M. The role of chloride-dependent inhibition and the activity of fast-spiking neurons during cortical spike-wave electrographic seizures. Neuroscience. 2002;114:1115–1132. doi: 10.1016/S0306-4522(02)00300-7. [DOI] [PubMed] [Google Scholar]
- Toyoda I, Bower MR, Leyva F, Buckmaster PS. Early activation of the ventral hippocampus and subiculum during spontaneous seizures in a rat model of temporal lobe epilepsy. J Neurosci. 2013;33:11100–11115. doi: 10.1523/JNEUROSCI.0472-13.2013. [DOI] [PMC free article] [PubMed] [Google Scholar]
- Trevelyan AJ, Sussillo D, Watson BO, Yuste R. Modular propagation of epileptiform activity: evidence for an inhibitory veto in neocortex. J Neurosci. 2006;26:12447–12455. doi: 10.1523/JNEUROSCI.2787-06.2006. [DOI] [PMC free article] [PubMed] [Google Scholar]
- Trombin F, Gnatkovsky V, de Curtis M. Changes in action potential features during focal seizure discharges in the entorhinal cortex of the in vitro isolated guinea pig brain. J Neurophysiol. 2011;106:1411–1423. doi: 10.1152/jn.00207.2011. [DOI] [PubMed] [Google Scholar]
- Truccolo W, Donoghue JA, Hochberg LR, Eskandar EN, Madsen JR, Anderson WS, Brown EN, Halgren E, Cash SS. Single-neuron dynamics in human focal epilepsy. Nat Neurosci. 2011;14:635–641. doi: 10.1038/nn.2782. [DOI] [PMC free article] [PubMed] [Google Scholar]
- Tyan L, Chamberland S, Magnin E, Camiré O, Francavilla R, David LS, Deisseroth K, Topolnik L. Dendritic inhibition provided by interneuron-specific cells controls the firing rate and timing of the hippocampal feedback inhibitory circuitry. J Neurosci. 2014;34:4534–4547. doi: 10.1523/JNEUROSCI.3813-13.2014. [DOI] [PMC free article] [PubMed] [Google Scholar]
- Varga C, Golshani P, Soltesz I. Frequency-invariant temporal ordering of interneuronal discharges during hippocampal oscillations in awake mice. Proc Natl Acad Sci U S A. 2012;109:E2726–E2743. doi: 10.1073/pnas.1210929109. [DOI] [PMC free article] [PubMed] [Google Scholar]
- Velazquez JL, Carlen PL. Synchronization of GABAergic interneuronal networks during seizure-like activity in the rat horizontal hippocampal slice. Eur J Neurosci. 1999;11:4110–4118. doi: 10.1046/j.1460-9568.1999.00837.x. [DOI] [PubMed] [Google Scholar]
- Viskontas IV, Ekstrom AD, Wilson CL, Fried I. Characterizing interneuron and pyramidal cells in the human medial temporal lobe in vivo using extracellular recordings. Hippocampus. 2007;17:49–57. doi: 10.1002/hipo.20241. [DOI] [PubMed] [Google Scholar]
- Walker WG, Dovey VJ. Electro-encephalography in cases of subcortical tumour. J Neurol Neurosurg Psych. 1944;7:57–65. doi: 10.1523/JNEUROSCI.5024-07.2008. [DOI] [PMC free article] [PubMed] [Google Scholar]
- Wendling F, Bartolomei F, Bellanger JJ, Chauvel P. Epileptic fast activity can be explained by a model of impaired GABAergic dendritic inhibition. Eur J Neurosci. 2002;15:1499–1508. doi: 10.1046/j.1460-9568.2002.01985.x. [DOI] [PubMed] [Google Scholar]
- Zhang ZJ, Koifman J, Shin DS, Ye H, Florez CM, Zhang L, Valiante TA, Carlen PL. Transition to seizure: ictal discharge is preceded by exhausted presynaptic GABA release in the hippocampal CA3 region. J Neurosci. 2012;32:2499–2512. doi: 10.1523/JNEUROSCI.4247-11.2012. [DOI] [PMC free article] [PubMed] [Google Scholar]
- Ziburkus J, Cressman JR, Barreto E, Schiff SJ. Interneuron and pyramidal cell interplay during in vitro seizure-like events. J Neurophysiol. 2006;95:3948–3954. doi: 10.1152/jn.01378.2005. [DOI] [PMC free article] [PubMed] [Google Scholar]