Abstract
Acidification of the extracellular and/or intracellular environment is involved in many aspects of cell physiology and pathology. Eukaryotic elongation factor 2 kinase (eEF2K) is a Ca2+/calmodulin-dependent kinase that regulates translation elongation by phosphorylating and inhibiting eEF2. Here we show that extracellular acidosis elicits activation of eEF2K in vivo, leading to enhanced phosphorylation of eEF2. We identify five histidine residues in eEF2K that are crucial for the activation of eEF2K during acidosis. Three of them (H80, H87, and H94) are in its calmodulin-binding site, and their protonation appears to enhance the ability of calmodulin to activate eEF2K. The other two histidines (H227 and H230) lie in the catalytic domain of eEF2K. We also identify His108 in calmodulin as essential for activation of eEF2K. Acidification of cancer cell microenvironments is a hallmark of malignant solid tumors. Knocking down eEF2K in cancer cells attenuated the decrease in global protein synthesis when cells were cultured at acidic pH. Importantly, activation of eEF2K is linked to cancer cell survival under acidic conditions. Inhibition of eEF2K promotes cancer cell death under acidosis.
INTRODUCTION
Acidification is implicated in physiological and pathological processes, including high-intensity exercise (1), diabetic ketoacidosis, and ischemia (2), and in solid tumors (3). Acidosis is associated with conditions of increased energy demand or enhanced flux through anaerobic glycolysis; therefore, under acidosis, cells require a mechanism that turns off processes such as protein synthesis, which has a very high demand for energy (4), under conditions such as hypoxia and energy shortage (5, 6). In addition, low extracellular pH (usually pH 6.5 to 6.9, may reach pH 6.2) is a hallmark of malignant solid tumors. Acidic tumor microenvironments drive cancer cell invasion (7) and boost aggressiveness by promoting angiogenesis and impeding immune rejection (3). Acidosis is cytotoxic to normal tissues and causes both apoptotic and necrotic cell death, yet cancer cells can resist acidic conditions (8). However, the exact survival mechanism(s) remains poorly understood.
Another unanswered question is “how do cells turn off protein synthesis in response to acidosis?” Previously, it has been shown that activation of mammalian target of rapamycin (mTOR) complex 1 (mTORC1), which controls anabolic processes, including mRNA translation (9), is acutely inhibited by extracellular acidosis (5). mTORC1 can be positively regulated by many signals via the tuberous sclerosis 1 and 2 (TSC1/2) complex, a GTPase activator protein for the small G protein Rheb (10). GTP-bound Rheb activates mTORC1. The best-characterized downstream targets of mTORC1 involved in mRNA translation include the ribosomal protein S6 (rpS6) kinases (S6Ks) (11), eukaryotic initiation factor-4E-binding proteins (4E-BPs) (12), and eukaryotic elongation factor 2 (eEF2) kinase (eEF2K) (13–16).
eEF2K is a Ca2+/calmodulin (CaM)-dependent protein kinase that phosphorylates eEF2 on Thr56 and impairs the binding of eEF2 to ribosomes, thereby inhibiting elongation (17, 18). eEF2K is activated by low pH in vitro (19). However, the mechanism underlying this effect and its physiological and pathological significance remained obscure. Here, we show that eEF2K is acutely activated in cells during acidosis. Furthermore, we identify the specific histidine residues in eEF2K, and in CaM, that are involved in the activation of eEF2K at low pH. Finally, we show that eEF2K confers cellular resistance to acidosis, promoting cancer cell survival. These results provide a rationale for using eEF2K inhibitors as anticancer drugs against tumor cells in acidic environments.
MATERIALS AND METHODS
Chemicals and reagents.
All chemicals were from Sigma-Aldrich unless otherwise stated. The Bradford assay reagent was from Bio-Rad. [γ-32P]ATP and [35S]methionine-cysteine were from PerkinElmer. Rapamycin was from Merck. AZD8055 was kindly provided by AstraZeneca. Isopropyl-β-d-1-thiogalactopyranoside (IPTG) was from Promega. A484954 was from Tocris Bioscience. Peptides were made by China Peptides (Shanghai, China).
Cell lines.
Mouse embryonic fibroblasts (MEFs) from eEF2K−/− mice and matched wild-type (WT) counterparts were prepared from embryos at day 13.5. AMPKα1/α2+/+ and AMPKα1/α2−/− MEFs are kind gifts from Benoît Viollet (Institut Cochin, University of Paris). TSC2+/+ and TSC2−/− MEFs were kindly provided by David J. Kwiatkowski (Harvard Medical School, Boston, MA). 4EBP1/2+/+ and 4EBP1/2−/− MEFs were kindly provided by Nahum Sonenberg (McGill University, Montréal, Canada). HCT116 and A549 cells expressing inducible short hairpin RNA (shRNA) against eEF2K were generously provided by Janssen Pharmaceutica. To induce knockdown of eEF2K, cells were cultured for 5 days with 1 mM IPTG prior to use.
Animals.
Mice were maintained at Biomedical Research Facility, University of Southampton, in line with the United Kingdom Animals (Scientific Procedures) Act 1986.
Cell culture and lysis.
HEK293 cells, MEFs, and A549 cells were cultured in Dulbecco's modified Eagle medium (DMEM); HCT116 cells were maintained in McCoy's 5A medium containing 10% (vol/vol) fetal bovine serum and 1% penicillin-streptomycin. pH was adjusted by adding different concentrations of NaHCO3.
After treatment, cells were lysed by scraping into ice-cold lysis buffer containing 1% (vol/vol) Triton X-100, 20 mM Tris-HCl (pH 7.5), 150 mM NaCl, 1 mM EDTA, 1 mM EGTA, 2.5 mM NaH2P2O7, 1 mM β-glycerophosphate, 1 mM Na3VO4, and protease inhibitor cocktail (1×). Lysates were spun at 16,000 × g for 10 min, the supernatants were kept, and total protein concentration was quantified by the Bradford assay.
Generation of eEF2K knockout MEFs.
The generation of eEF2K knockout mice was as described in reference 20. MEFs from these mice and matched wild-type counterparts were prepared from embryos at embryonic day 13.5.
Real-time RT-PCR amplification analysis.
Total RNA was extracted using TRIzol (Life Technologies). cDNA was produced using the ImProm-II reverse transcription (RT) system (Promega) with oligo(dT)15. Subsequently, real-time PCR was performed using specific primers (PrimerDesign) for human eEF2K (5′-CCAGCCAAGACTTCAGTGTT-3′; 5′-ATTTTACCTGCTTCATTGTTCATTTAA) and 18S rRNA (HK-SY-hu-600 from PrimerDesign) as a control. Samples were analyzed in triplicate (for each experiment) with SYBR green dye mix (PrimerDesign) on an ABI Step One Plus qPCR (quantitative PCR) instrument (Applied Biosystems). The comparative threshold cycle (CT) method was used to determine the amount of specific mRNAs compared with the level of 18S rRNA.
Plasmid transfections.
mCherry/de4GFP fusion plasmid was a kind gift from Michel Roberge (University of British Columbia, Vancouver, Canada [21]). pHM-FLAG-eEF2K wild-type and K170M vectors were described previously (22). pcDNA3.1-FLAG-Rheb was from Addgene (plasmid 19996; Cambridge, MA). Green fluorescent protein (GFP)-spectrin was a kind gift from Terence P. Herbert (Royal Melbourne Institute of Technology, Melbourne, Australia). HEK293 cells were transfected using the calcium phosphate method (23). Plasmid transfections in HCT116 cells were performed using FuGENE HD (Promega).
Intracellular pH measurement.
Intracellular pH measurement was performed as described in reference 21. Briefly, fluorescent signals of the pH-sensitive de4GFP (excitation, 488 nm) and the pH-insensitive mCherry (excitation, 543 nm) were captured by a Leica Confocal microscope. A standard curve was established using the high-[K+]/nigericin technique, and changes in intracellular pH in response to extracellular pH were determined by measuring the mCherry/de4GFP fluorescence ratios, which were then converted to pH via interpolation on the calibration curve.
SDS-PAGE and Western blot analysis.
SDS-PAGE and Western blot analysis were performed as previously described (24). Anti-P-eEF2 Thr56 and eEF2K were from Eurogentec, and anti-S6K1, rpS6, FLAG, TSC2, tubulin, and NHE-1 were from Santa Cruz Biotechnology (Santa Cruz, CA). Anti-P-eEF2K Ser441/Ser445 was a gift from Daniele Guardavaccaro (Hubrecht Institute-KNAW and University Medical Centre Utrecht, Netherlands). All other antibodies were purchased from New England BioLabs (Hitchin, Herts, United Kingdom).
mTOR complex immunoprecipitation and mTORC1 kinase assay.
mTOR complexes were immunoprecipitated as previously described (25). For mTORC1 kinase assays, after washing with lysis buffer, mTOR complex immunoprecipitates were further washed twice in reaction buffer (25 mM HEPES at pH 6.0, 6.6, or 7.4, 50 mM NaCl, 20% glycerol, 10 mM MgCl2, 4 mM MnCl2, and 1 mM dithiothreitol [DTT]), and assays were performed in 20 μl reaction buffer containing 1 μg recombinant 4E-BP1, 50 mM unlabeled ATP, and 1 μCi [γ-32P]ATP at 30°C for 20 min. Reactions were stopped by adding 20 μl of 2× Laemmli sample buffer; samples were then heated at 100°C for 4 min followed by SDS-PAGE. Proteins were stained with Coomassie blue, and phosphorylated 4E-BP1 was detected by a Typhoon FLA 7000 phosphorimager (GE Healthcare).
Protein expression, mutagenesis, and purification.
The expression vector pNIC28-Bsa4 containing the sequence for wild-type CaM was generously provided by the SGC (Oxford). Point mutations were introduced by PCR mutagenesis using the QuikChange system (Stratagene). CaM was expressed in Escherichia coli BL21(DE3) cells. Protein purifications were performed as described previously (26).
eEF2K assays.
To assay endogenous eEF2K, protein G beads were preincubated with eEF2K antibody at 4°C overnight. After treatment and lysis, 100 μg HEK293 cell lysate was incubated with protein G beads plus eEF2K antibody for 2 h at 4°C. eEF2K activity assays were performed as described in reference 26 using recombinant eEF2K prepared in E. coli; the CaM concentration was 16 ng/assay volume (unless otherwise stated).
ELISA for CaM binding.
Wells of a Maxisorp enzyme-linked immunosorbent assay (ELISA) tray (Nunc) were coated overnight at 4°C with 0.2 μg/ml CaM in phosphate-buffered saline (PBS). Wells were then washed with PBST (PBS plus 0.05% Tween 20) and blocked with 5% bovine serum albumin (BSA) in PBST. eEF2K peptides corresponding to residues 76 to 95 [eEF2K(76–95)] (wild-type and mutant) were diluted in buffer containing 50 mM MOPS (morpholinepropanesulfonic acid), 100 mM NaCl, 2 mM CaCl2, 0.05% Tween 20, and 0.5% BSA, adjusted to the desired pH. One hundred microliters of the peptides was added to the wells and incubated for 1 h at room temperature. Wells were washed with buffer containing 50 mM MOPS, 100 mM NaCl, 2 mM CaCl2, and 0.05% Tween 20 adjusted to the corresponding pH. Bound glutathione S-transferase (GST)–eEF2K was detected using an anti-GST antibody followed by anti-IgG–horseradish peroxidase (HRP) antibody.
ITC.
Isothermal titration calorimetry (ITC) measurements were carried out using an iTC200 MicroCalorimeter (GE Healthcare) at 25°C. CaM and all peptides were prepared and dialyzed in the same buffer, i.e., 20 mM piperazine-N,N′-bis(2-ethanesulfonic acid) (PIPES), 150 mM NaCl, and 10 mM CaCl2, pH 6.8 or pH 7.5). Ligand was titrated into protein solution corresponding to approximately 230 μM ligand (peptide) and 18 μM protein (CaM). Each experiment consisted of an initial injection of 0.3 μl followed by 39 injections of 1 μl peptide solution into the cell containing CaM, while stirring at 800 rpm. Control titrations (peptide into buffer) were measured. Data acquisition and analysis were performed using the Origin scientific graphing and analysis software package (OriginLab). Data analysis was performed by generating a binding isotherm and best fit using the following parameters: N (number of sites), ΔH (calories/mole), ΔS (calories/mole/degree), and K (binding constant in molar−1). Following data analysis, K was converted to the dissociation constant (Kd) (micromolar).
CaMK1 assays.
GST-CaMK1 and CaMK1 substrate (EP2544 [YLRRRLSDSNF]) were purchased from the University of Dundee, Division of Signal Transduction Therapy, and diluted in 50 mM Tris-HCl (pH 7.5), 10 mM DTT, 1 mg/ml BSA. CaMK1 assays were carried out at 30°C by incubating 0.9 μg CaMK1 in 40 μl of 50 mM Tris-HCl (pH 7.5), 10 mM DTT, 10 mM magnesium acetate, 0.1 mM CaCl2, 1 μM CaM (19.4 ng/μl or as indicated in the figure legends), 300 μM EP2544, and 1 μCi [γ-32P]ATP. Samples were taken at 5, 10, 15, and 30 min by spotting 8-μl aliquots from the 40-μl assay mixture onto squares of Whatman P81 paper (2 cm by 2 cm), which were washed three times (5 min each) in 75 mM phosphoric acid followed by methanol before drying in air and scintillation counting.
IHC.
An appropriately consented archival lung adenocarcinoma was selected for optimization and demonstration of markers by immunohistochemistry (IHC). Sequential 4-μm sections were stained by IHC using the EnvisionFLEX visualization system (Dako) and Autostainer Link48 automated platforms (Dako). Primary antibodies GLUT-1, NHE-1, and P-eEF2 Thr56 were retrieved, visualized, and counterstained with hematoxylin. Images were taken using a Zeiss Axio Scope A1 microscope (magnification, ×200) and an Axiocam MRc5 camera (5 megapixel).
NMR studies.
All nuclear magnetic resonance (NMR) experiments were recorded at 600 MHz at 298 K on a Varian INOVA-600 instrument fitted with a z-gradient cold probe (Agilent technologies). One-dimensional (1D) proton spectra were recorded with an acquisition time of 0.4 s using 1D sequence with Watergate water suppression as implemented in Biopack (Agilent Technologies). The 1H resonances were referenced to (3-trimethyl silyl)propionate-2,2,3,3-d4 (sodium salt) at 0 ppm and processed with mild resolution enhancement and water deconvolution in VnmrJ3.1 (Agilent Technologies).
Peptide samples corresponding to residues 78 to 100 of eEF2K [referred to here as eEF2K(78–100)] were prepared in D2O buffer containing 25 mM bis-Tris, 150 mM KCl, and 10 mM CaCl2. Twenty-eight 1D spectra were recorded over a pH range of 4.8 to 8.9. The chemical shifts of the CH2 protons of the imidazole side chains of the histidine residues were determined with an accuracy of 0.02 ppm. The data were fitted to the Hill equation (27) using a Hill coefficient of 1 and allowing the pKa to vary using nonlinear fitting routines in Grace (Grace Development Team). The pKa of the imidazole ring of histidine was determined to be 6.13 in a separate titration. pKa values were corrected by 0.04 units to account for the isotope effect of D2O (28).
UV cross-linking/ATP binding assay.
The binding of eEF2K to ATP was studied by UV cross-linking as described in reference 26. Briefly, recombinant GST-eEF2K was incubated in the presence or absence of CaM (16 ng/assay) and [α-32P]ATP. UV irradiation was performed using a hand-held light source (UVP model UVGL-58 Mineralight lamp with emission wavelength maximum at 254 nm) held 2 to 3 cm above the open microcentrifuge tube containing the sample for 60 min. Samples were then subjected to SDS/PAGE and autoradiography.
Cell ATP/viability assay.
Cells were cultured in 96-well plates for 48 h; ATP levels were measured using the CellTiter-Glo luminescent cell viability assay kit (catalog number G7570; Promega).
Cell death/cytotoxicity assay.
Cells were cultured in 96-well plates for 48 h unless otherwise specified. Cytotoxicity was determined using the CellTox Green assay (catalog number G8741; Promega), which measures changes in cell membrane integrity.
Flow cytometry analysis.
Following treatment, the cells were trypsinized and fixed in 90% methanol. Cells were pelleted by centrifugation at 200 × g for 5 min and resuspended in 1 ml PBS containing 20 μg/ml propidium iodide and 100 μg/ml RNase A. Quantification of propidium iodide staining was performed using a FACSCalibur flow cytometer (BD Biosciences). A total of 20,000 gated events were recorded per sample.
Protein synthesis measurements.
Cells were preincubated in pH-buffered methionine-, cysteine-, and NaHCO3-free DMEM (customized by Labtech International, United Kingdom) for 1 h, before the addition of 10 μCi [35S]methionine-cysteine and incubation for a further hour. Incorporated radioactivity was determined as described previously (24).
Polysome analysis.
Polysome analysis was performed as described previously (24).
RESULTS
Activation of eEF2K and suppression of mTORC1 activity under extracellular acidosis.
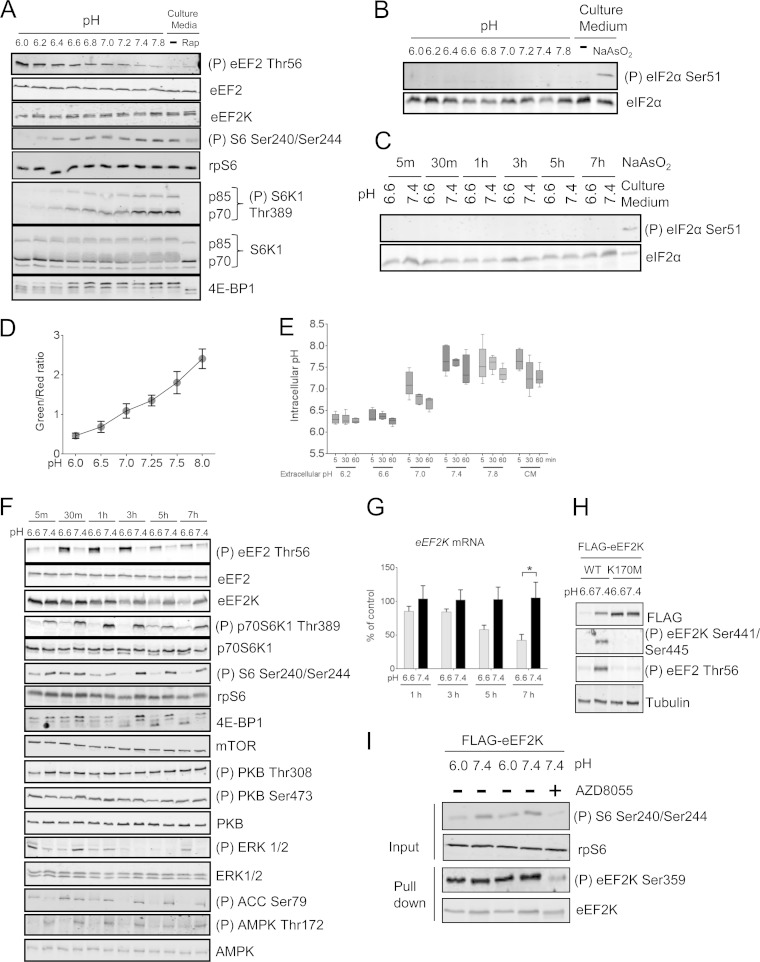
Previous data showed that eEF2 phosphorylation increases when mouse liver extract is incubated in acidified HEPES-KOH buffer and that the activity of recombinant eEF2K kinase is enhanced by acidic pH in vitro (19). However, it was unknown if acidic cytosolic pH increases endogenous eEF2K activity in cells directly or indirectly, via upstream signaling events, e.g., extracellular acidosis can inhibit mTORC1 signaling, and this is mainly TSC2 dependent (5, 29). To study this, we cultured HEK293 cells in acid-buffered growth medium for 30 min. As expected, extracellular acidosis increased eEF2 phosphorylation, indicating activation of eEF2K, and decreased mTORC1 signaling, as shown by the diminished phosphorylation of S6K1 and S6 and the increased mobility of S6K1 and 4EBP1 on SDS-PAGE (Fig. 1A). In contrast, acidic pH did not affect eIF2α phosphorylation, which often increases in response to stresses (e.g., sodium arsenite) (Fig. 1B and C). In addition, extracellular acidification decreases intracellular pH (Fig. 1D and E).
FIG 1.
Extracellular acidosis inhibits mTORC1 and activates eEF2K. (A) HEK293 cells were incubated in pH-buffered medium or normal culture medium for 30 min with/without 100 nM rapamycin (Rap). (B and C) HEK293 cells were incubated in pH media buffered to different pHs for the indicated periods of time or in culture medium in the presence or absence of 0.5 mM NaAsO2 for 2 h. The levels of total and phospho-eIF2α (Ser51) were analyzed by Western blotting. (D) HEK293 cells transfected with mCherry/de4GFP were under high-[K+]/nigericin pH clamp from pH 6.0 to 8.0 for 10 min. An increase in red fluorescence indicates an acidic pH shift. The standard curve was established by determining the relationship between pH and the green/red fluorescence ratio. (E) HEK293 cells transfected with mCherry/de4GFP were cultured in either pH-buffered or culture medium (CM) for the indicated times. The intracellular pH of cells was determined via interpolation of green/red fluorescence ratio into the standard curve illustrated in panel D. (F) HEK293 cells were incubated in medium buffered at pH 6.6 or 7.4 for the indicated times. (G) HEK293 cells were cultured at pH 6.6 or 7.4 buffered medium for up to 7 h, and expression of EEF2K mRNA was quantified by real-time RT-PCR. Results are given as means ± standard errors (SE) from 3 independent experiments and expressed as a percentage of the control (pH 7.4). *, 0.01 ≤ P < 0.05 as determined by two-way analysis of variance (ANOVA). (H) HEK293 cells were transfected with vectors for wild-type or K170M (kinase-dead) FLAG-tagged eEF2K; 24 h later, cells were cultured at pH 6.6 or 7.4 for 7 h before lysis. (I) HEK293 cells were cultured at pH 6.0 or 7.4 buffered medium for 30 min, eEF2K was immunoprecipitated from the lysates, and Ser359 phosphorylation was analyzed by Western blotting. For all SDS-PAGE and Western blot experiments, data shown are representative of three independent experiments.
To study the effect of acidosis on mTORC1/eEF2K-related signaling over longer times, HEK293 cells were incubated in medium buffered at pH 6.6 or pH 7.4 for up to 7 h (Fig. 1F). Interestingly, we observed a decrease in both eEF2K mRNA (after 5 h [Fig. 1H]) and eEF2K protein levels (after 3 h [Fig. 1G]) at pH 6.6. However, despite the decreased eEF2K levels, eEF2 phosphorylation remained higher at pH 6.6 than at pH 7.4 for up to 7 h, indicating sustained activation of eEF2K. The activity of eEF2K is clearly required for its degradation, since kinase-dead eEF2K (K170M) was stable at pH 6.6 (Fig. 1H).
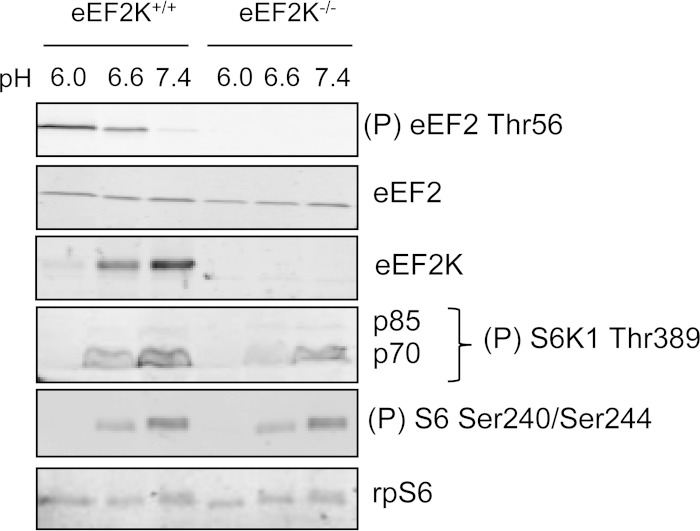
We have recently generated eEF2K−/− (knockout) mice (20). MEFs from these mice and matched wild-type counterparts were prepared from embryos at embryonic day 13.5. We confirmed that the phosphorylation of eEF2 during acidosis was exclusively mediated through eEF2K, because it was absent in eEF2K−/− MEFs (Fig. 2).
FIG 2.
eEF2K is responsible for the induction of eEF2 phosphorylation under acidosis. eEF2K+/+ or eEF2K−/− MEFs were cultured at pH 6.0, 6.6, or 7.4 for 24 h. Blots were developed with the indicated antibodies. Data shown are representative of three independent experiments.
We also observed a time-dependent impairment of mTORC1 signaling in HEK293 cells cultured at pH 6.6, whereas mTORC2 activity, assessed by phosphorylation of PKB at Ser473 (30), was unaffected (Fig. 1F). Phosphorylation of PKB at Thr308, essential for its stimulation (31), was also unaffected (Fig. 1F). Changes in ERK phosphorylation did not correlate with changes in eEF2K activity or mTORC1 signaling (Fig. 1F). SAPK4, whose activity has been shown to be inhibited under acidic conditions (32), is able to phosphorylate eEF2K at Ser359, which strongly inhibits its activity (13), so that an increase in SAPK4 activity could not activate eEF2K in this way. Nevertheless, we have tested whether low pH affects phosphorylation of eEF2K at Ser359. It did not, while in contrast, the mTOR inhibitor AZD8055 did, as expected, block phosphorylation of eEF2K at Ser359 (Fig. 1L). Although low pH does impair mTORC1 activity (Fig. 3), it does not affect Ser359 phosphorylation. The reason for this is currently unknown. Nevertheless, this is good evidence that SAPK4 does not play a role in that acidosis-induced activation of eEF2K.
FIG 3.
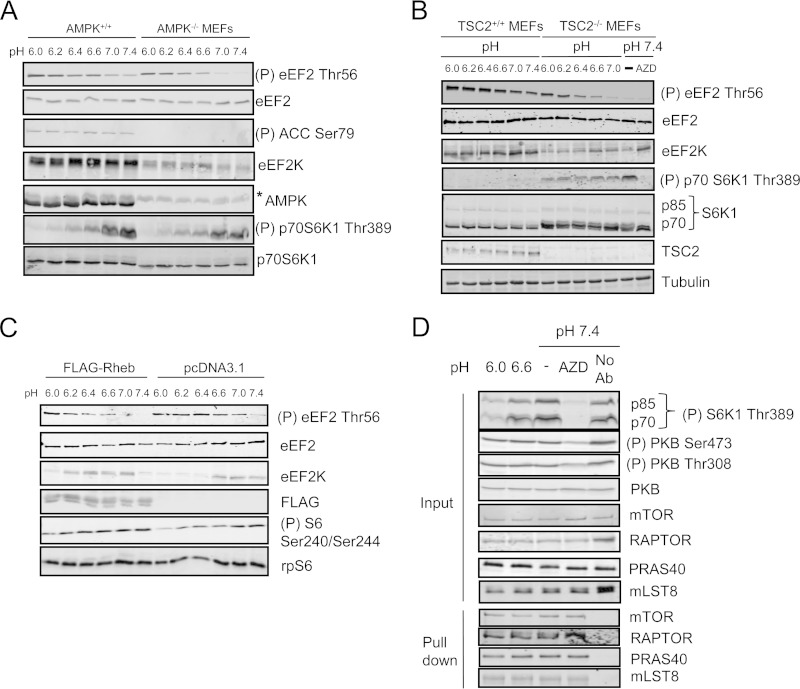
mTORC1 inhibition is not responsible for the activation of eEF2K under acidosis. (A) AMPK+/+ or AMPK−/− MEFs were incubated in pH-buffered medium for 30 min. *, nonspecific band. (B) TSC2+/+ and TSC2−/− MEFs were cultured in pH buffered medium for 1 h with/without 100 nM AZD8055 (AZD). (C) HEK293 cells transfected with either an empty vector or one encoding FLAG-tagged Rheb were cultured at different pHs for 30 min. Blots were developed with the indicated antibodies. (D) HEK293 cells were incubated in pH buffered media for 30 min, and cells were lysed in lysis buffer containing 3-[(3-cholamidopropyl)-dimethylammonio]-1-propanesulfonate (CHAPS). Samples of lysate were analyzed by immunoblotting for the indicated proteins. mTOR complexes were isolated via immunoprecipitation, and the integrity of mTORC1 was then analyzed by Western blotting for components of this complex. For panels A and D, data shown are representative of three independent experiments, For panels B and C, data shown are representative of five independent experiments.
Interestingly, acidosis also decreased phosphorylation (activation) of AMPK and ACC (a substrate for AMPK) (Fig. 1F). In AMPK−/− MEFs, eEF2 and S6K1 phosphorylation levels were still altered by acidosis, similar to what was seen in wild-type MEFs (Fig. 3A). Thus, AMPK is not required for acidosis-induced changes in eEF2K and mTORC1 signaling. Notably, eEF2K expression is lower in AMPK−/− cells than in WT cells, suggesting that AMPK regulates eEF2K expression.
mTORC1 negatively regulates eEF2K activity (13–16); thus, inhibition of mTORC1 by acidosis might increase eEF2K activity. However, although rapamycin effectively did slightly increase eEF2 phosphorylation in HEK293 cells, eEF2 phosphorylation was much higher in cells cultured under acidic conditions than in rapamycin-treated ones, suggesting that acidosis-induced eEF2K activation is independent of inhibition of mTORC1 signaling (Fig. 1A). Furthermore, in TSC2−/− MEFs, where mTORC1 is hyperactivated, eEF2 still became phosphorylated under acidic conditions, although eEF2 phosphorylation was lower in TSC2−/− MEFs than in wild-type cells, perhaps reflecting lower levels of eEF2K protein (Fig. 3B). Inhibiting mTORC1 using the ATP-competitive mTOR inhibitor AZD8055 (33) restored eEF2K protein levels in TSC2-null MEFs, suggesting that mTORC1 hyperactivation negatively regulates eEF2K expression (Fig. 3B). Furthermore, in HEK293 cells exogenously expressing Rheb, which causes constitutive activation of mTORC1, eEF2 phosphorylation remained sensitive to changes in extracellular pH, although eEF2 phosphorylation was lower in Rheb-transfected cells than controls (Fig. 3C). At pH 7.4, Rheb overexpression led to a decrease in eEF2K expression. mTORC1 activation was inhibited when pH was decreased, which might be responsible for rescuing the expression of eEF2K (Fig. 3C). The data suggest that although acidosis-induced eEF2K stimulation is unlikely to be mediated by inhibition of mTORC1, hyperactive mTORC1 signaling in TSC-null cells may partially suppress eEF2 phosphorylation at low pH, by impairing the expression and activity of eEF2K.
Acidosis directly inhibits mTORC1 kinase activity and promotes the activation of eEF2K.
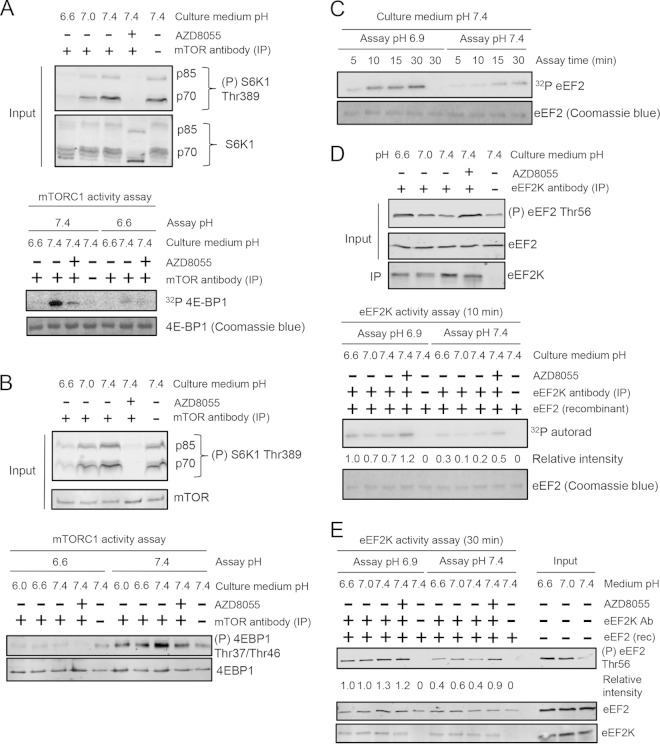
Although mTORC1 activity was less sensitive to changes in ambient pH in TSC2−/− MEFs than in WT MEFs, acidification still inhibited mTORC1 in them (Fig. 3B), suggesting that pH might directly affect mTORC1's catalytic activity. To study this, HEK293 cells were incubated in medium buffered at physiological (7.4) or acidic (6.6 or 6.0) pH, with or without AZD8055. After lysis, mTOR complexes were immunoprecipitated from cell lysates and assayed in vitro at pH 7.4 or 6.6 against recombinant 4E-BP1. The activity of mTORC1 isolated from cells preincubated in acidic pH-buffered medium was lower than that of mTORC1 from control cells (Fig. 4A and B). Importantly, decreased activity was also seen when mTORC1 from control cells was assayed at pH 6.6. mTORC1 is comprised of several proteins, including in particular RAPTOR (essential for mTORC1), mLST8, and PRAS40 (34). Low pH (6.6 and 6.0) does not affect the binding of these proteins to mTORC1 (Fig. 3D). Therefore, mTORC1 kinase activity is substantially decreased at acidic pH values such as those encountered during acidosis (i) by stable changes that occur within the cell and (ii) because mTOR is itself less active at lower pH.
FIG 4.
Effects of pH on mTORC1 and eEF2K kinase activity. (A) HEK293 cells were incubated at different pHs for 30 min, and mTOR complexes were immunoprecipitated and subjected to mTORC1 activity assay with [γ-32P]ATP. (B) The mTORC1 activity assay was performed as described for panel A but with nonradiolabeled ATP. (C) eEF2K was immunoprecipitated from lysates of HEK293 cells cultured at pH 7.4 for 30 min, followed by assays for the indicated times. (D) HEK293 cells were cultured at pH 6.6, 7.0, or 7.4 for 30 min, and eEF2K was immunoprecipitated from cell lysates and subjected to activity assays for 10 min. (E) As described for panel D, except that the activity assays were performed for 30 min using nonradiolabeled ATP. For panels A, B, and D, upper panels represent the samples of the lysates (inputs) that were subsequently used in kinases assays. Data shown are representative of three independent experiments.
The activity of recombinant eEF2K is enhanced under acidic conditions in vitro (19), but it remained unclear whether this also applied to endogenous eEF2K. Endogenous eEF2K was immunoprecipitated from lysates of HEK293 cells that had been preincubated in buffered medium (pH 7.4, 7.0, or 6.6), and its activity was assayed using purified eEF2. eEF2 was more rapidly phosphorylated when the assay was performed at pH 6.9 than 7.4, confirming that acidic pH increases eEF2K activity (Fig. 4C to E). As expected, endogenous eEF2K purified from cells kept at pH 7.4 and treated with AZD8055 also showed increased catalytic activity (Fig. 4D and E), and this was further enhanced when assayed at pH 6.9, providing additional evidence that activation of eEF2K under acidosis is independent of mTORC1 inhibition. Thus, endogenous eEF2K is indeed directly activated by low pH in cells, resulting from stable modification(s) of eEF2K and/or an effect of pH on its intrinsic activity.
Protonation of histidines in the CaM-binding domain of eEF2K is involved in the increase in eEF2K activity at acidic pH.
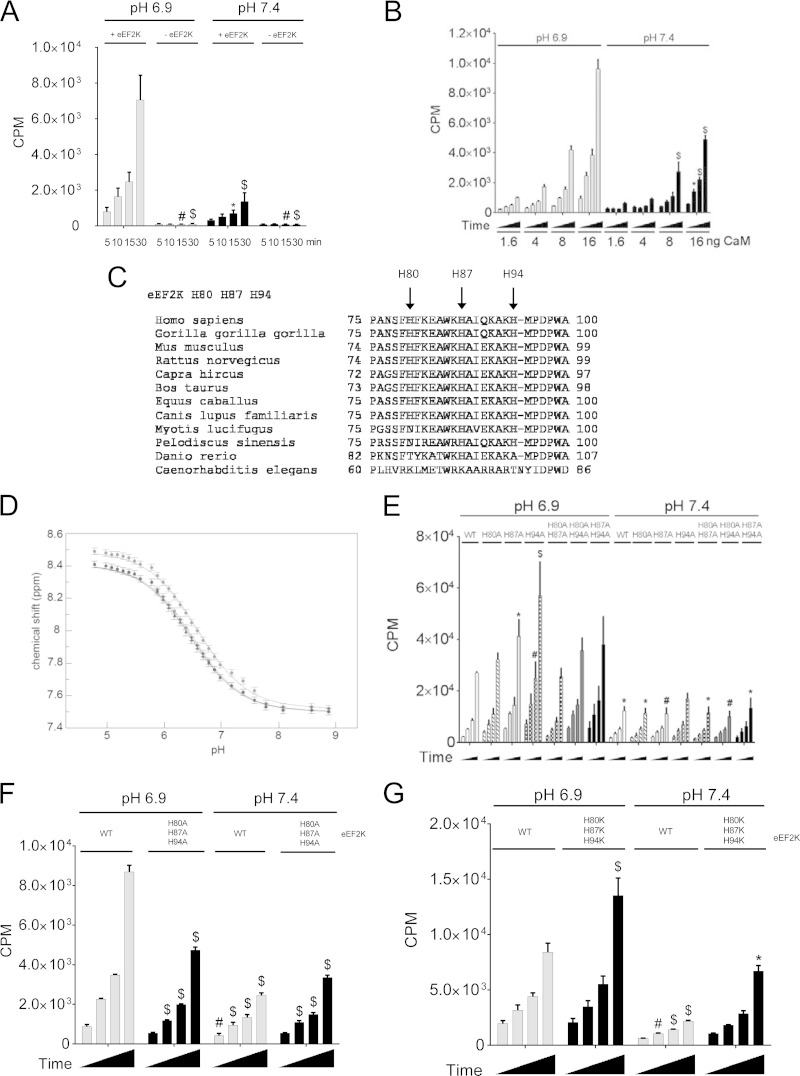
It was important to elucidate the molecular mechanism through which pH affects eEF2K activity. We first performed in vitro kinase assays using recombinant eEF2K. To ensure accurate, easily quantifiable data, we used the MH-1 peptide as the substrate (35). Reactions were within the linear range (Fig. 5A). eEF2K activity was higher when assayed at acidic pH (6.9) than at pH 7.4 (Fig. 5A), and eEF2K activity was dependent upon CaM (Fig. 5B).
FIG 5.
Histidine residues within the CaM-binding site of eEF2K are important for eEF2K activation under low pH. (A) eEF2K activity assay with or without wild-type recombinant eEF2K at either pH 6.9 or 7.4. (B) eEF2K activity assays with the indicated amount of CaM per assay. (C) Sequence alignment of eEF2K CaM-binding domain among species. (D) Chemical shift titration curves for the CH2 protons of the imidazole side chains of the 3 histidine residues in eEF2K(82–100). (E) Activity of WT eEF2K compared to the single or double H80A/H87A/H94A mutants. (F) Comparison of the activity of wild-type eEF2K with that of the H80A/H87A/H94A triple mutant. (G) eEF2K assay for eEF2K(H80K/H87K/H94K). Results are means ± SE, n = 3. P values were obtained by two-way ANOVA followed by Dunnett's test. *, 0.01 ≤ P < 0.05; #, 0.01 < P ≤ 0.001; $, P < 0.001.
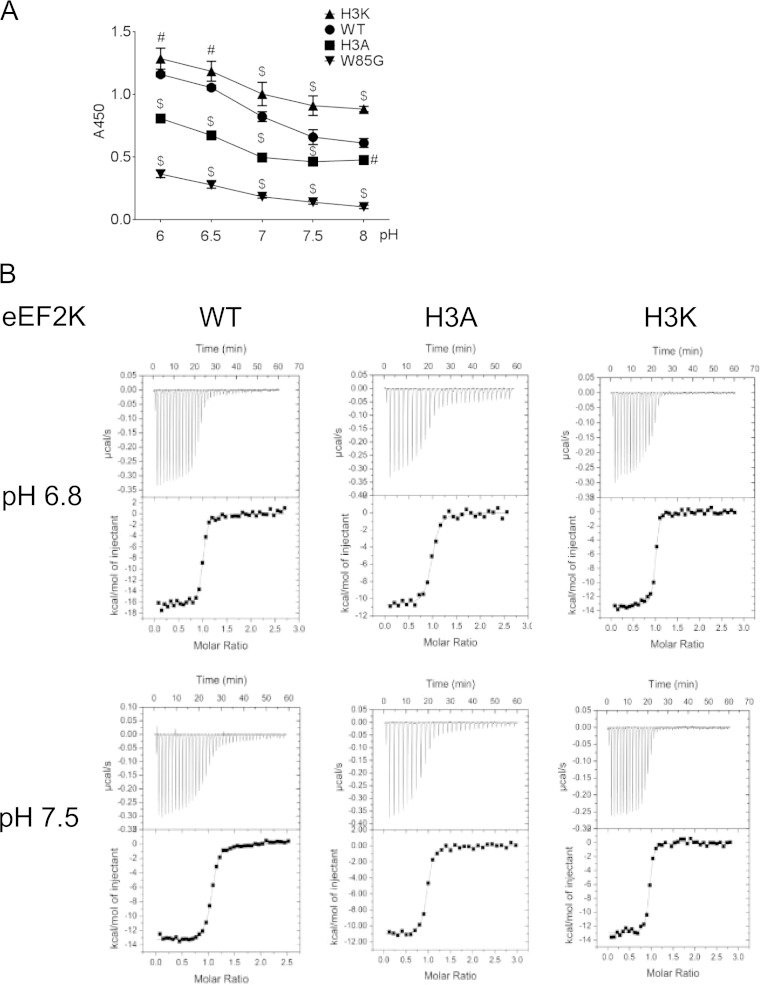
Earlier data indicated that acidic conditions promote binding of eEF2K to CaM, thereby enhancing eEF2K activity (19, 26). The imidazole group of histidine ionizes around neutral pH. The CaM-binding region of eEF2K contains three highly conserved histidines (H80, H87, and H94) (Fig. 5C). To study their properties in detail, without interference from other histidines in eEF2K, we synthesized a peptide corresponding to residues 78 to 100 of eEF2K. NMR studies showed that the pKa values of these histidines are pH 6.45, 6.5, and 6.6, i.e., in the range where eEF2K activity is sensitive to pH (Fig. 5D). (Note that we cannot identify which histidine corresponds to which pKa from these data.) This prompted us to test their importance for the effect of pH on binding of CaM to eEF2K. When 1 or 2 of these histidines were replaced by nonionizable alanines, eEF2K activity was still enhanced at lower pH. Indeed, eEF2K(H87A) and eEF2K(H94A) actually displayed enhanced kinase activity at pH 6.9 (Fig. 5E). However, when all three histidines were mutated to alanine (H80A/H87A/H94A [H3A]), the activation of eEF2K at acidic pH was greatly blunted (Fig. 5F). Conversely, when all three were mutated to lysines (H80K/H87K/H94K [H3K]), which are charged at both acidic pH and physiological pH, eEF2K activity was enhanced at both pH values (Fig. 5G). Consistent with this, the affinity of the peptide eEF2K(78–100)(H3A) for CaM was decreased (Kd = 97 ± 9 nM) compared to that of the corresponding peptide based on WT eEF2K under acidic conditions (Kd = 38 ± 3 nM), whereas CaM binding to eEF2K(78–100)(H3K) peptide was tighter (Kd = 32.5 ± 3.2 nM) than the WT peptide (Kd = 66 ± 9.3 nM) at physiological pH (Fig. 6A, B; Table 1). eEF2K(78–100)(W85G), a mutant that is unable to bind CaM (26), was used as a negative control. These data strongly suggest that protonation of all 3 histidines promotes binding of CaM to eEF2K, contributing to the stimulation of eEF2K activity at acidic pH.
FIG 6.
eEF2K H80/H87/H94 are important for CaM binding to eEF2K under low pH. (A) CaM ELISA using the eEF2K(76-95) peptide based on wild-type eEF2K or H80A/H87A/H94A (H3A), H80K/H87K/H94K (H3K), and W85G mutant peptides. Results are expressed as means ± SE from 3 independent experiments. P values were obtained by two-way ANOVA followed by Dunnett's test. *, 0.01 ≤ P < 0.05; #, 0.01 < P ≤ 0.001; $, P < 0.001. (B) Calorimetric titrations of wild-type CaM with the eEF2K peptides (78–100) (WT, H80A/H87A/H94A [H3A], and H80K/H87K/H94K [H3K]) at pH 6.8 and 7.5. These experiments were performed at 25°C in 20 mM piperazine-N,N′-bis(2-ethanesulfonic acid) (PIPES) 150 mM KCl, and 10 mM CaCl2 at either pH 6.8 or pH 7.5 as described in Materials and Methods. In all cases, the upper graph represents the original titration curve while the lower graph shows the binding isotherm obtained from the experiments shown in the top graph (these data are related to those given in Table 1).
TABLE 1.
Isothermal titration calorimetric analysis of the binding of calmodulin to peptides corresponding to residues 78 to 100 of eEF2Ka
| Peptide | pH | Kd (nM) | ΔH (kcal/mol) | ΔS at 298K (cal/mol) | −TΔS (kcal/mol) | ΔG (kcal/mol) | N |
|---|---|---|---|---|---|---|---|
| Wild type | 6.8 | 38 (±2.6) | −16.8 (±0.53) | −22.6 | −6.7 | −10.1 | 1.02 (±0.03) |
| Wild type | 7.5 | 66 (±9.3) | −15.2 (±0.7) | −18.4 | −5.4 | −9.7 | 0.98 (±0.03) |
| H3A | 6.8 | 97 (±6.5) | −11.2 (±0.5) | −5.6 | −1.6 | −9.5 | 1.03 (±0.09) |
| H3A | 7.5 | 99 (±1.7) | −11.9 (±0.4) | −7.9 | −2.3 | −9.5 | 0.953 (±0.009) |
| H3K | 6.8 | 28 (±4.1) | −13.2 (±0.4) | −9.7 | −2.9 | −10.3 | 0.97 (±0.005) |
| H3K | 7.5 | 32.5 (±3.2) | −13.3 (±0.3) | −10.4 | −3.1 | −10.2 | 0.946 (±0.01) |
Errors (in parentheses) are expressed as standard errors of the means for three independent experiments. Thermodynamic parameters were obtained by fitting the ITC data to a single-state binding model. H3A, H80A/H87A/H94A; H3K, H80K/H87K/H94K; N, stoichiometry of the interaction determined in the experiment; Kd, dissociation constant (Kd is the reciprocal of Ka); ΔH, change in enthalpy; ΔS, change in entropy; ΔG (Gibb's free energy), ΔH − TΔS.
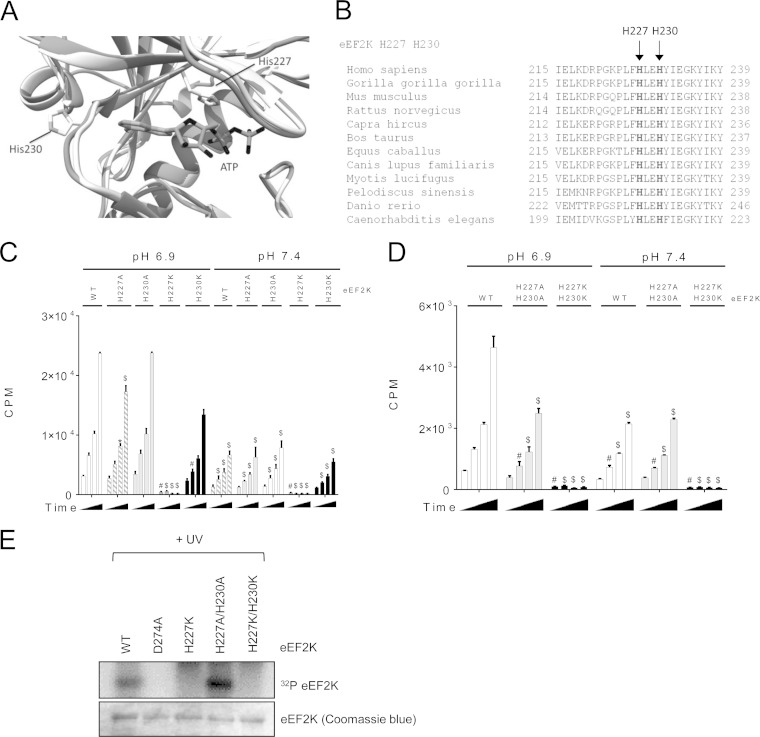
However, although the activity of eEF2K(H3K) was higher at pH 7.4, it still increased 1.9-fold at lower pH, although less so than for WT eEF2K (3.8-fold [Fig. 5G]), implying that additional (perhaps histidine) residues in eEF2K play roles in its acidosis-mediated activation. There are two highly conserved histidine residues (H227 and H230) in the ATP-binding site of eEF2K (Fig. 7A and B). eEF2K(H227K) was inactive at pH 7.4 or 6.9. At physiological pH, eEF2K(H227A), eEF2K(H230A), and eEF2K(H230K) all showed activities similar to those of wild-type eEF2K. At acidic pH, the activity of eEF2K(H230K) was lower than that of wild-type eEF2K (Fig. 7C). Interestingly, eEF2K(H227A/H230A) showed activity similar to that of wild-type kinase at pH 7.4, whereas its activity was not enhanced at acidic pH (Fig. 7D). Consistent with these data, eEF2K(H227K) and eEF2K(H227KH230K) were unable to bind ATP as judged from UV cross-linking using [α-32P]ATP (Fig. 7E). eEF2K(D274A), an inactive mutant (35), was also unable to bind ATP and was used as a control. eEF2K(H227A/H230A) strongly bound to ATP (Fig. 7E) but still showed reduced activity at pH 6.9 compared to the wild-type eEF2K (Fig. 7D). Therefore, protonation of these two histidines appears likely to be required for the activation of eEF2K at acidic pH, not simply for binding ATP.
FIG 7.
Histidine residues within the ATP-binding site of eEF2K (light gray) and MHCK A (dark gray) are required for eEF2K activation under low pH. (A) Front view of superimposed homology model of eEF2K and the structure of MHCK A (PDB code 3LKH); histidines (H227 and H230) and ATP are shown as sticks. (B) Sequence alignment of eEF2K ATP-binding region among species. (C) eEF2K assay using MH-1 with either wild-type eEF2K or the H227A or H230A mutants. (D) eEF2K assay with wild-type eEF2K, eEF2K(H227A/H230A), or eEF2K(H227K/H230K). Results in panels C, D, and E are expressed as means ± SE from 3 independent experiments. *, 0.01 ≤ P < 0.05; #, 0.01 < P ≤ 0.001; $, P < 0.001. (E) ATP binding of eEF2K mutants was determined by UV cross-linking using [α-32P]ATP. Data shown are representative of three independent experiments.
H108 in CaM contributes to activation of eEF2K at low pH.
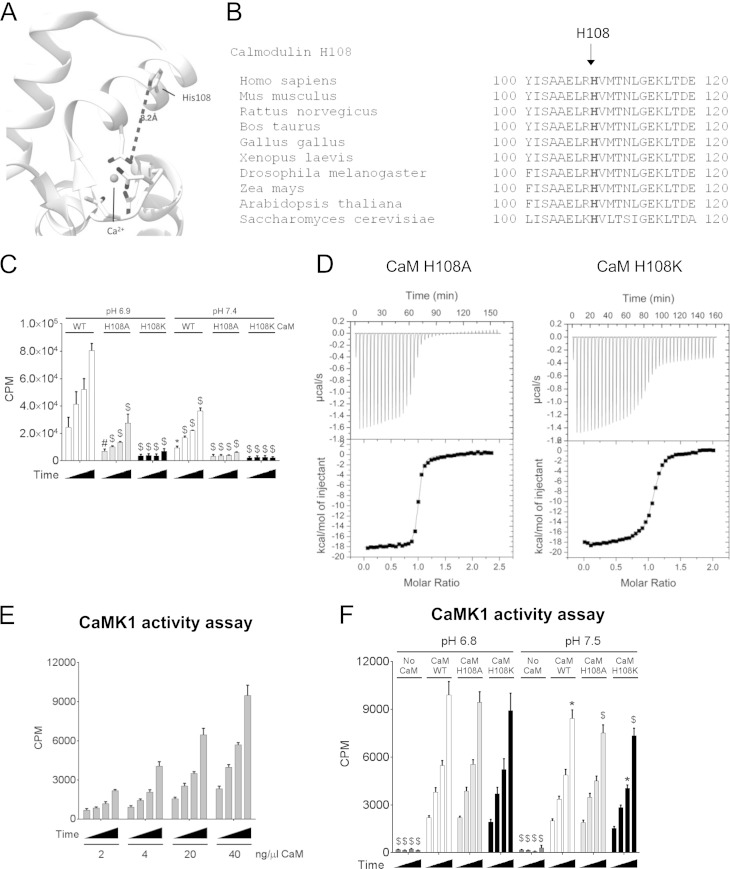
The sole, highly conserved histidine residue in CaM (H108; Fig. 8A, B) could also be involved in the effect of acidification on CaM-eEF2K binding. Interaction sites on CaM for eEF2K have been identified by NMR chemical shift perturbation analysis (K. J. Hooper, H. Mikolajek, and J. M. Werner, unpublished data), but H108 is outside this region and therefore unlikely to be involved in binding eEF2K. However, the CaM(H108K) mutant failed to activate eEF2K (Fig. 8C). Nevertheless, both CaM(H108A) and (H108K) still bound eEF2K(78–100) [at pH 6.8, Kd CaM(H108A) = 42 nM; Kd CaM(H108K) = 122 nM] (Fig. 8D), although, in the case of CaM(H108K), not as well as wild-type CaM (Kd = 38 nM at pH 6.8 [Fig. 6B]). The impaired ability of CaM(H108A) to activate eEF2K cannot reflect an effect on eEF2K binding. Important to note is that the CaM concentration used in previous assays does not reach saturation, so that for the H108K mutant, its inability to activate eEF2K may reflect, but probably partly, decreased affinity for eEF2K (Fig. 5B). These data strongly suggest that H108 in CaM is required for the ability of CaM to activate eEF2K independently of the modest alteration in binding affinity. To assess whether H108 played a general role in the activation of kinases by CaM, we also studied its role in activating another CaM-dependent kinase, CaMK1. CaMK1 was activated to similar extents by wild-type CaM, H108A, or H108K, at either pH 7.4 or 6.8 (Fig. 8E and F). Thus, H108 in CaM does not play a general role in activating CaM-dependent kinases.
FIG 8.
CaM H108 is essential for eEF2K activation. (A) Ribbon diagram of the closed CaM structure (PDB code 1CDL). The histidine (H108) and residues coordinating the Ca2+ ions are shown as sticks, and the Ca2+ ion is shown as a sphere. (B) Sequence alignment of CaM(110–120) among species. (C) eEF2K kinase assay using wild-type CaM or the H108A or H108K mutant of CaM at pH 6.9 and pH 7.4. (D) Calorimetric titrations of CaM mutants with eEF2K(78–100) at pH 6.8. eEF2K(78–100) peptide corresponds to the sequence of the CaM-binding site in eEF2K(78–100). P values were obtained by two-way ANOVA followed by Dunnett's test (control, pH 6.9, wild-type eEF2K). (E) CaMK1 activity assay at pH 6.8 with the indicated amount of CaM per assay. (F) CaMK1 activity assay using 16 μg of wild-type CaM of the H108A or H108K mutant of CaM at pH 6.9 and pH 7.4. Results are expressed as means ± SE from 3 (in panels C and E) or 4 (in panel F) independent experiments. *, 0.01 ≤ P < 0.05; #, 0.01 < P ≤ 0.001; $, P < 0.001. For data in panel F, P values were obtained by two-way ANOVA followed by Dunnett's test (control, pH 6.9, wild-type eEF2K and wild-type CaM).
eEF2K promotes cancer cell survival under acidosis.
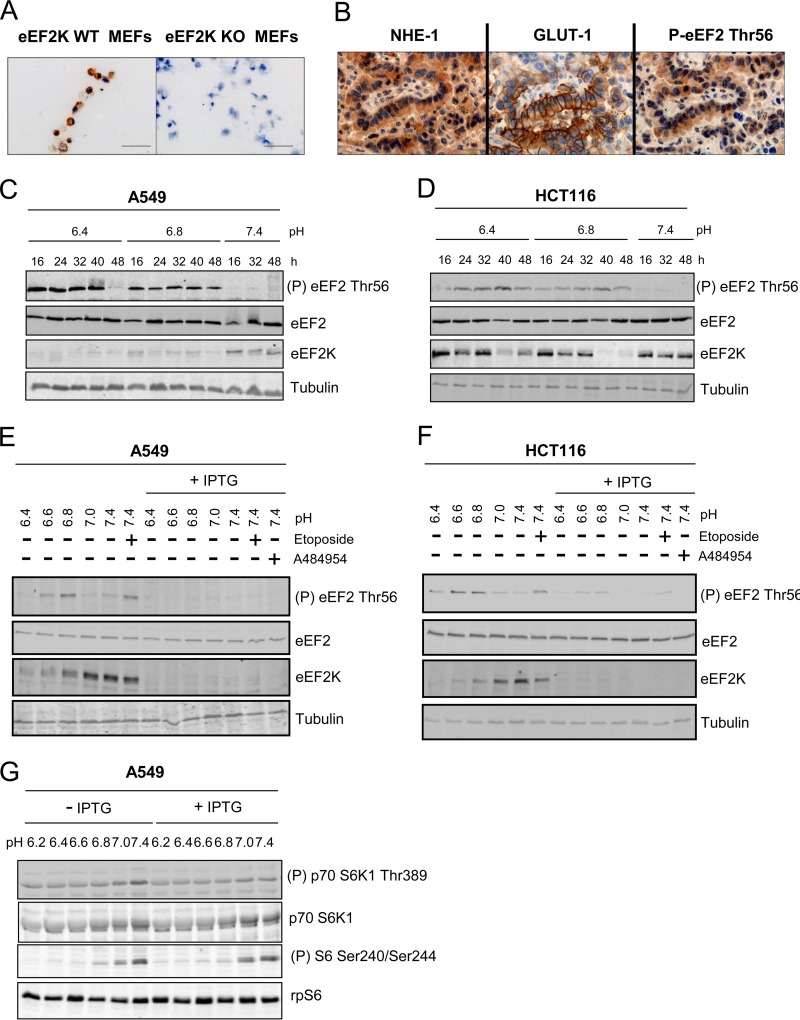
While the environment around normal tissues is pH 7.2 to 7.4, the extracellular pH around malignant tumors is usually between 6.5 and 6.9 (36) and may fall to 6.2 (37). Acidic extracellular pH is toxic to normal cells, yet cancer cells can withstand acidic environments (3). Notably, in human lung adenocarcinoma tissues, high expression levels of NHE-1 and GLUT-1 (glucose transporter 1), markers of tumor acidification (7), coincided with high levels of eEF2 phosphorylation (Fig. 9A and B). eEF2K has recently been shown to be critical for cancer cell survival during nutrient deprivation, another condition under which eEF2K is activated (38); we therefore asked whether eEF2K also helps cancer cells resist acidosis-induced cell death. To test this, two cancer cell lines, A549 (human lung adenocarcinoma) and HCT116 (human colon carcinoma) cells expressing an inducible shRNA against eEF2K were developed. Cells were also treated with etoposide, a cytotoxic topoisomerase inhibitor, as a positive control. eEF2 phosphorylation increased when control A549 or HCT116 cells were cultured at low pH (6.4 and 6.8), although eEF2 phosphorylation dropped by 48 h (Fig. 9C and D). Total eEF2K levels in acidic pH-buffered medium cultures fell in A549 cells and more slowly in HCT116 cells (Fig. 9C and D). The fact that eEF2 phosphorylation increases even though eEF2K levels actually decline at lower pH strongly supports the notion that the intrinsic activity of eEF2K is strongly enhanced at low pH.
FIG 9.
Acidosis activates eEF2K in cancer cells. (A) Validation of the P-eEF2 Thr56 antibody for immunohistochemistry. eEF2K WT and knockout (KO) MEFs were stained with P-eEF2 Thr56. Scale bar, 50 μm. (B) Representative sequential sections of human lung cancer to support expression of NHE-1, GLUT-1, and P-eEF2 Thr56. Nuclei were counterstained with hematoxylin. Ten lung cancer carcinoma samples were stained in total, 7 of which showed strong areas of GLUT-1 expression; of these, 6 codisplayed NHE-1 and P-eEF2 Thr56. Scale bar, 100 μm. A549 (C) or HCT116 (D) cells were cultured in medium buffered at pH 6.4, 6.8, or 7.4 for the indicated times. IPTG (1 μM) was added to A549 (E) or HCT116 (F) cells 5 days before the experiment. Cells were then incubated in medium buffered at different pH values for 48 h with/without 1 mM IPTG, 30 μM A484954, or 25 μM etoposide, followed by lysis and Western blot analysis. (G) A549 cells were treated as described for panel E, and Western blot analysis was then performed to study the phosphorylation of p70S6K1 at Thr389 and S6 at Ser240/Ser244. For panels C to G, data shown are representative of three independent experiments.
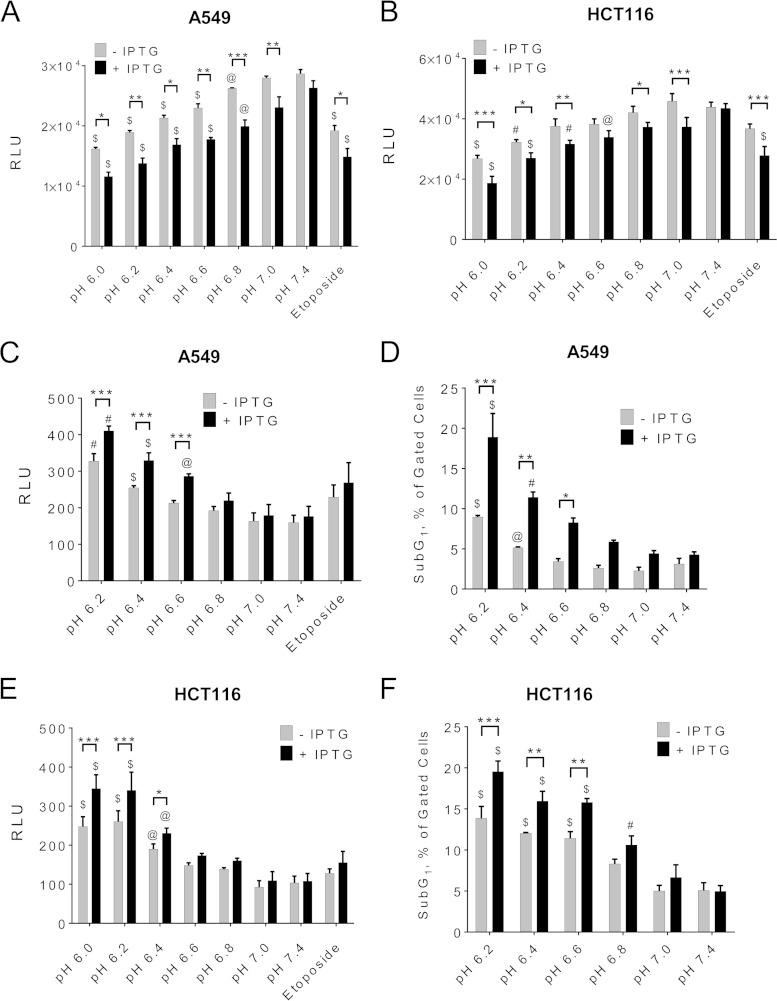
Induction of shRNA against eEF2K effectively knocked down eEF2K expression and decreased eEF2 phosphorylation under acidic conditions in A549 cells (Fig. 9E). eEF2K knockdown was less effective in HCT116 cells (we still observed residual eEF2 phosphorylation at low pH [Fig. 9F]). Extracellular acidification decreased cellular ATP levels, and this was enhanced upon shRNA-mediated eEF2K knockdown in A549 or HCT116 cells (Fig. 10A and B). This likely reflects the fact that eEF2K negatively regulates translation elongation (17, 18), a process in which almost all the energy needed by protein synthesis is consumed. eEF2K may be cytoprotective under acidosis (as it is during nutrient starvation [38]). We did indeed observe increased cell death under low pH, as revealed by the CellTox green cytotoxicity assay, and a higher sub-G1 population, and this was further increased upon eEF2K knockdown in A549 (Fig. 10C and D) or HCT116 (Fig. 10E and F) cells.
FIG 10.
Activation of eEF2K is important in cancer cell survival under acute acidic conditions. A549 (A) or HCT116 (B) cells were treated as described for Fig. 9E and F, respectively, and then subjected to cell ATP assay using the CellTitre-Glo kit. A549 (C) or HCT116 (E) cells were treated as described for panels A and B, respectively, and then subjected to cytotoxicity assay using CellTox Green kit. A549 (D) or HCT116 (F) cells were cultured as described for panels A and B, respectively, and then subjected to flow cytometry analysis. The percentage of sub-G1 population is presented. For panels A, B, C, and E, results are expressed as means ± SE from 3 independent experiments in duplicate. For panel D, results are means ± SE from 3 independent experiments. For panel E, results are means ± SE from 2 independent experiments and a third one in duplicate. P values were obtained either by two-way ANOVA (*, 0.01 ≤ P < 0.05; **, 0.01 < P ≤ 0.001; ***, P < 0.001) or by one-way ANOVA followed by Dunnett's test (@, 0.01 ≤ P < 0.05; #, 0.01 < P ≤ 0.001; $, P < 0.001).
Depletion of eEF2K by shRNA in A549 cells led to a small decrease in S6K1 phosphorylation at pH 7.4 but did not affect mTORC1 signaling under other pH conditions (Fig. 9G), indicating that loss of eEF2K activity, rather than an effect on mTORC1, accounts for acidosis-mediated cell death. In contrast, acidosis did not increase cell death in eEF2K+/+ or eEF2K−/− MEFs (J. Xie and C. G. Proud, unpublished results) and we cannot use them to assess whether eEF2K plays a cytoprotective role.
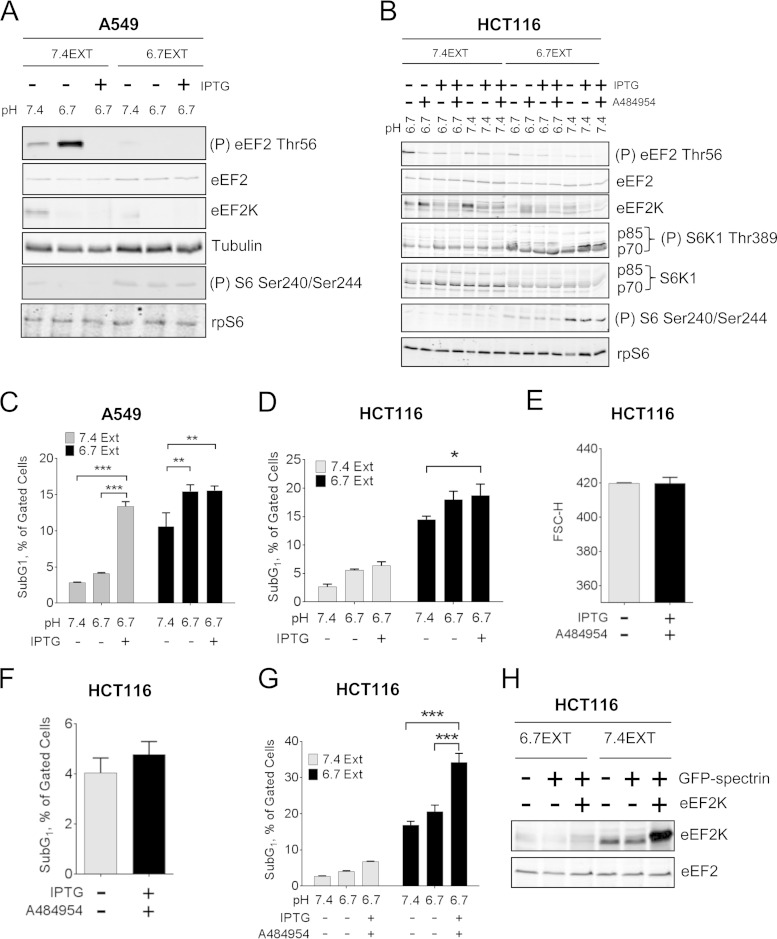
While these data demonstrate that eEF2K plays an important role in maintaining cancer cell survival under acute extracellular acidosis, solid tumors can be surrounded by an acidic microenvironment for months in vivo. To test whether eEF2K plays roles in cancer cell survival at acidic pH over an extended time period, we cultured A549 and HCT116 cells in medium buffered at acidic pH (6.7) for approximately 3 months (denoted 6.7EXT). As controls, cells were also maintained in medium buffered at physiological pH (7.4) for the same period of time (denoted 7.4EXT). Interestingly, both eEF2K protein levels and eEF2 phosphorylation were lower in 6.7EXT cells than in 7.4EXT cells (Fig. 11A and B), which correlated with an increase in the sub-G1 population for 6.7EXT cells (Fig. 11C and D), suggesting that decreased eEF2K expression and eEF2 phosphorylation may account for the impaired cell viability upon chronic acidosis. Surprisingly, we found that 6.7EXT HCT116 cells showed enhanced mTORC1 signaling (Fig. 11A and B). This may be an acquired adaptive mechanism to help maintain cell growth and proliferation under chronic acidosis.
FIG 11.
The role of eEF2K in cancer cell survival under chronic extracellular acidosis. A549 (A) or HCT116 (B) cells were cultured in pH 6.7 (6.7EXT) or pH 7.4 (7.4EXT) buffered medium for about 3 months. Cells were then cultured in pH 6.7 or 7.4-buffered media for 48 h with/without 1 mM IPTG and/or 30 μM A484954, before lysis and Western blot analysis. A549 (C) or HCT116 (D, G) cells were also subjected to flow cytometry to determine subG1 population. (E) HCT116 cells were cultured at pH 7.4 in the presence or absence of 1 mM IPTG and 30 μM A484954 for 48 h, and G1 cell size was then determined by flow cytometry. Results are shown as forward scatter-height (FSC-H). (F) HCT116 cells were cultured as described for panel E and then subjected to flow cytometry analysis; the percentage of sub-G1 population is shown. (H) HCT116 cells cultured at pH 6.7 (6.7EXT) or 7.4 (7.4EXT) for approximately 3 months were transfected with GFP-spectrin alone or GFP-spectrin plus FLAG-tagged eEF2K as indicated. Cells were lysed 8 h after transfection, and eEF2K levels were analyzed by Western blotting. Data are expressed as mean ± SE from 3 independent experiments. P values were obtained by two-way ANOVA. *, 0.01 ≤ P < 0.05; **, 0.01 < P ≤ 0.001; ***, P < 0.001. For panels A and B, data shown are representative of three independent experiments.
Because shRNA knockdown of eEF2K is incomplete in 6.7EXT HCT116 cells, we also treated HCT116 cells expressing shRNA against eEF2K with A484954, a selective eEF2K inhibitor (39). This completely abolished the acidosis-induced eEF2 phosphorylation (Fig. 11B). At pH 7.4, A484954 plus IPTG did not affect cell size (Fig. 11E) or cell viability (Fig. 11F), indicating that it is not toxic to cells maintained at physiological pH. Importantly, knockdown of eEF2K by inducible shRNA concomitant with its inhibition by A484954 in 6.7EXT HCT116 cells, which did not alter mTORC1 activation (Fig. 11B), further enhanced acidosis-induced cell death (Fig. 11G). We have also tried to express eEF2K exogenously to test whether this would rescue acidosis-induced cell death; GFP-spectrin was coexpressed with eEF2K to select transfected cells by flow cytometry. However, it was not feasible to express exogenous eEF2K in cells cultured under acidic conditions, because exogenous wild-type eEF2K is degraded during acidosis (Fig. 11H), and to date, we have not identified a nondegradable mutant of eEF2K that is also active (further supporting the conclusion that the pH-induced degradation of eEF2K requires its activity). Nevertheless, the data strongly suggest that the levels of eEF2K expression and eEF2 phosphorylation dictate the survival rates of cancer cells in acidic environments.
eEF2K suppresses protein synthesis at low pH.
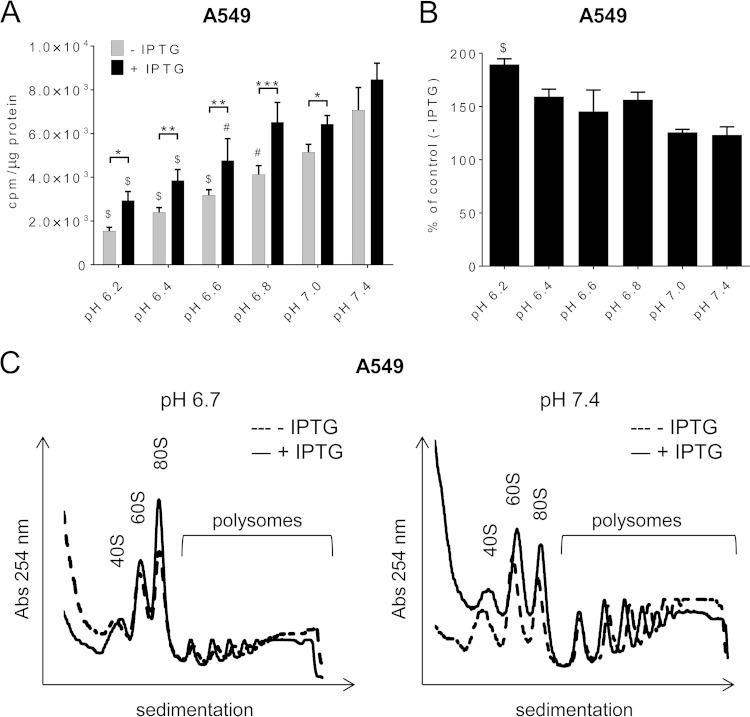
It has previously been shown that overexpressing eEF2K in 3T3 fibroblasts suppresses protein synthesis at pH 6.4 but not pH 7.4 (19). However, it was not known whether endogenous eEF2K regulates protein synthesis at low pH. To investigate this, we cultured A549 cells in methionine-free medium buffered at different pHs (6.2 to 7.4), to allow us to use the incorporation of [35S]methionine to measure protein synthesis. As expected (5), acidic conditions led to a reduction in protein synthesis. Protein synthesis was faster in cells where eEF2K had been knocked down than in the control cells (Fig. 12A), and the effect of eEF2K knockdown on the enhancement of protein synthesis was greater when cells were cultured at acidic pH (Fig. 12B), suggesting that eEF2K plays a greater role in limiting protein synthesis at low pH than at physiological pH (consistent with its activation at low pH). We also analyzed ribosome distribution in A549 during acidosis (pH 6.7) versus physiological conditions (pH 7.4). We observed an increase in translationally inactive monosomal fractions and a concomitant decrease in translationally active polysomal fractions in both control and eEF2K knockdown cells incubated at pH 6.7 compared to those maintained at pH 7.4 (Fig. 12C), indicative of impaired initiation. However, strikingly, at pH 6.7 the proportion of subpolysomal material was markedly greater in eEF2K knockdown cells than controls. This likely reflects faster translation elongation in the knockdown cells, due to low levels of eEF2 phosphorylation, leading to ribosomal “runoff” and loss of polysomes. This illustrates that eEF2K normally restrains elongation, especially at low pH. The relatively higher rates of protein synthesis in eEF2K knockdown cells may account for the higher consumption of energy at acidic pH, resulting in impaired cell viability.
FIG 12.
The role of eEF2K in protein synthesis under acidosis. (A) IPTG (1 μM) was added to A549 cells 5 days before experiment. A549 cells were then transferred to media at different pH values for 1 h with/without 1 μM IPTG. Rates of protein synthesis were determined, and results are presented as counts per minute (cpm) per microgram protein and expressed as means ± SE from 4 independent experiments. (B) Quantification of IPTG-treated cells as described for panel A expressed as a percentage of control (no IPTG treatment). For panels A and B, P values were obtained either by two-way ANOVA (*, 0.01 ≤ P < 0.05; **, 0.01 < P ≤ 0.001; ***, P < 0.001) or by one-way ANOVA followed by Dunnett's test (@, 0.01 ≤ P < 0.05; #, 0.01 < P ≤ 0.001; $, P < 0.001). (C) A549 cells were incubated at pH 6.7 or 7.4 for 1 h. Lysates were fractionated on sucrose density gradients. Positions of the 40S, 60S, and 80S ribosomal particles and polysome fractions are shown. Absorbance values (254 nm) are in arbitrary units and on the same scale for each panel. Representative data from 4 independent experiments are shown.
DISCUSSION
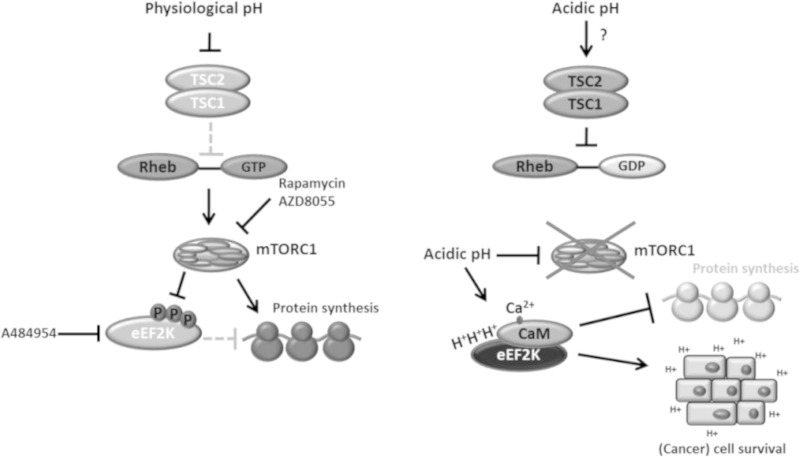
Here we show that eEF2K is rapidly activated in response to acidosis in cells, an effect that is followed by its downregulation. To our knowledge, eEF2K is the first protein kinase known to be strongly activated by low pH in vitro (19). However, previous to this study, it was not known how eEF2K is activated under acidosis in vivo, and in particular, the physiological or pathological roles of this activation were also unclear. Importantly, we show that eEF2K contributes to cancer cell survival under acidic conditions, potentially providing a therapeutic target for treatment of solid tumors that are surrounded by acidic pH (Fig. 13).
FIG 13.
Schematic presentation of molecular mechanisms by which acidosis controls the mTORC1 and eEF2K pathway to shut down protein synthesis and aid cancer cell survival. Arrows, positive effects or activation; solid “T” lines, inhibition; dotted “T” lines, inhibitory effect that is alleviated upon upstream inhibition.
It has previously been shown that mTORC1 activity can be inhibited by extracellular acidosis and that this can be dependent or independent of TSC1/2 (5, 29). Here we have demonstrated that the intrinsic kinase activity of mTORC1 is itself decreased at acidic pH. Since mTORC1 signaling promotes anabolism, this effect is physiologically sensible, as it will act to slow down anabolism processes under adverse conditions associated with acidosis. mTORC1 promotes the phosphorylation of eEF2K on at least 7 sites (16), leading to its inactivation. Release of this negative input at acidic pH could provide a mechanism for activation of eEF2K under such conditions. However, inhibition of mTORC1 was unlikely to be the main cause of the activation of eEF2K by acidic pH, because (i) the levels of eEF2 phosphorylation induced by acidosis in cells were much higher than in rapamycin-treated cells (Fig. 1A) and (ii) in TSC2-null cells, where mTORC1 signaling is hyperactivated, eEF2 phosphorylation remained sensitive to changes in extracellular pH (Fig. 3B), although the levels of eEF2 phosphorylation are lower in such cells, presumably due to lower eEF2K expression and/or repression of eEF2K activity (Fig. 3B).
Thus, given earlier findings (19) and the data reported here, the activity of eEF2K appeared to be controlled directly by pH in cells. This could reflect the protonation of certain amino acid side chains in eEF2K (19, 26). Histidine is the only amino acid whose side chain normally has a pKa within this range. The affinity of eEF2K for CaM has been shown to be enhanced at low pH (26). Here we identify 3 histidines (H80, H87, and H94) in the CaM-binding domain of eEF2K and two more (H227 and H230) in the ATP-binding region of eEF2K, all of which play important roles in the activation of eEF2K at low pH. We also show that the sole histidine residue in CaM (H108) is crucial for eEF2K activation at both acidic and physiological pH. These histidines in eEF2K are not conserved in other α-kinases.
CaM binds up to four Ca2+ ions, and H108 is located close to one of the four Ca2+-binding regions (Fig. 8A). Although it is therefore possible that H108 plays a role in the binding of Ca2+ to CaM, it is hard to explain why this mutation has no effect on the activation of CaMK1 by CaM (Fig. 8F). Carbethoxylation of CaM H108 does not affect CaM-mediated stimulation of cyclic nucleotide phosphodiesterase (40). The regulation of eEF2K by low pH involves two unusual effects: an enhancement of its activation by CaM, which is not seen, e.g., for CaMK1, and histidines in its catalytic domain, which are not conserved in other α-kinases.
Acidosis also leads to a reduction in eEF2K protein levels, which could result from downregulation of eEF2K mRNA levels (Fig. 1G), increased degradation of the eEF2K protein, and/or, perhaps, decreased translation of its mRNA. While this decrease in eEF2K levels may seem surprising when its activation aids cell survival, excessive eEF2K activity may be deleterious to cells in the long term (for an example, see reference 41) and its decreased expression may help maintain appropriate levels of eEF2 phosphorylation/elongation and/or allow cells subsequently to recover from acidotic stress.
Acidification of the extracellular environment is an important feature of malignant solid tumors and results from their preference for anaerobic glycolysis (42) and poor vascularization. However, unlike peritumoral normal tissues, which are susceptible to acidosis-induced cell death, tumor cells display resistance to acidic cytotoxicity, favoring their invasion into the damaged adjacent normal tissues (7). eEF2K is highly expressed and activated in solid tumor cells (38). Extracellular acidity not only dictates cancer aggressiveness and promotes evasion of immune rejection but also generates chemoresistance, because most cancer drugs are mildly basic, and acidosis renders cancer cells less susceptible to their cytotoxic effects upon their protonation at low pH (43). Significant effort has been applied to study how to impair tumor cell survival under acidic conditions, e.g., by neutralizing the acidic environment using agents such as bicarbonate, by using proton pump inhibitors to reduce intracellular pH, or by hyperacidification of the intra- and/or extracellular space (43). Nevertheless, to our knowledge, prior to this study, no protein kinase involved in cancer cell survival under acidosis had been described.
The activities of mTORC1 and thus eEF2K are highly sensitive to nutrient availability (25, 38). Notably, inhibition of mRNA translation protects cancer cells from nutrient deprivation-induced cell death (38, 44). Similarly, acidosis also suppresses mRNA translation (5, 6), and this may also protect cells, by decreasing nutrient/energy demand. Here we provide evidence that the activation of eEF2K plays a role in the adaptation of cancer cells to acidic stress. The survival rates of tumor cells under acidotic conditions depend on the activity and expression levels of eEF2K. In keeping with this, stimulation of the AMPK-eEF2K pathway and the subsequent inhibition of translation elongation play crucial roles in cancer cell survival when nutrient availability is compromised (38). Since acidosis is a consequence of altered energy-generating metabolism, it is to be expected that highly energy-demanding cellular processes, such as protein synthesis, are slowed down to save ATP and preserve energy balance under such conditions. Indeed, knockdown of eEF2K increased protein synthesis in cancer cells cultured at acidic pH (Fig. 12A and B). It is therefore plausible that activation of eEF2K during acidosis slows down protein synthesis to protect cancer cells from energy overconsumption and consequent death. The activation of eEF2K during acidosis could also affect the translation of certain mRNAs (45), which may include proapoptotic/necrotic factors or proteins needed for cell adaptation to acidic stress (Fig. 13). The slowing down of protein synthesis caused by the pH-dependent activation of eEF2K may also be important in decreasing energy consumption in other settings, such as tissue acidosis. We tried testing whether using cycloheximide to restore elongation inhibition in cells where eEF2K had been knocked down could rescue cell survival at acidic pH. However, cycloheximide further increased cell death under all pH conditions tested (data not shown), in line with several previous studies that showed that cycloheximide is cytotoxic to a variety of cancer cells (46–49).
Hypoxia, another major characteristic of solid tumors, has also been shown to evoke tumor extracellular acidification (50). In fact, it has previously been reported that eEF2K activation also aids cancer cell survival under hypoxia (51). Moreover, high levels of eEF2K expression correlate with the most aggressive subtype of medulloblastoma and glioblastoma multiforme (38). Taken together, these data strongly support the development of anticancer therapeutic strategies with eEF2K as a target.
ACKNOWLEDGMENTS
These studies were funded by Grants from the Canadian Institutes for Health Research and the United Kingdom Biotechnology and Biological Sciences Research Council (to C.G.P.), and from the Wellcome Trust (to C.G.P. and J.M.W.). We especially thank members of the Proud lab, S. Thirdborough, M. Willet, and S. Findlow, for their support and help. We gratefully acknowledge access to the Biophysical Instrument Facility at the University of Oxford and to the Southampton Centre for Biological NMR and Imaging & Microscopy Centre at the University of Southampton. Finally, we are indebted to the late H.-J. Schuppe for his expertise in microscopy.
We declare that we have no potential conflicts of interest.
Jianling Xie conducted most of the experiments; Halina Mikolajek, Kelly J. Hooper, Craig R. Pigott, Hafeez Mohammed, Toby Mellows, and Claire E. Moore also contributed data; Jörn M. Werner, Gareth J. Thomas, and Christopher G. Proud provided supervision; Christopher G. Proud was the principal investigator (PI) on the relevant grants and helped design experiments, interpret the data, and write the paper.
REFERENCES
- 1.Fitts RH. 1994. Cellular mechanisms of muscle fatigue. Physiol Rev 74:49–94. [DOI] [PubMed] [Google Scholar]
- 2.Kraut JA, Madias NE. 2010. Metabolic acidosis: pathophysiology, diagnosis and management. Nat Rev Nephrol 6:274–285. doi: 10.1038/nrneph.2010.33. [DOI] [PubMed] [Google Scholar]
- 3.Neri D, Supuran CT. 2011. Interfering with pH regulation in tumours as a therapeutic strategy. Nat Rev Drug Discov 10:767–777. doi: 10.1038/nrd3554. [DOI] [PubMed] [Google Scholar]
- 4.Buttgereit F, Brand MD. 1995. A hierarchy of ATP-consuming processes in mammalian cells. Biochem J 312(Part 1):163–167. [DOI] [PMC free article] [PubMed] [Google Scholar]
- 5.Balgi AD, Diering GH, Donohue E, Lam KK, Fonseca BD, Zimmerman C, Numata M, Roberge M. 2011. Regulation of mTORC1 signaling by pH. PLoS One 6:e21549. doi: 10.1371/journal.pone.0021549. [DOI] [PMC free article] [PubMed] [Google Scholar]
- 6.England BK, Chastain JL, Mitch WE. 1991. Abnormalities in protein synthesis and degradation induced by extracellular pH in BC3H1 myocytes. Am J Physiol 260:C277–C282. [DOI] [PubMed] [Google Scholar]
- 7.Estrella V, Chen T, Lloyd M, Wojtkowiak J, Cornnell HH, Ibrahim-Hashim A, Bailey K, Balagurunathan Y, Rothberg JM, Sloane BF, Johnson J, Gatenby RA, Gillies RJ. 2013. Acidity generated by the tumor microenvironment drives local invasion. Cancer Res 73:1524–1535. doi: 10.1158/0008-5472.CAN-12-2796. [DOI] [PMC free article] [PubMed] [Google Scholar]
- 8.Damaghi M, Wojtkowiak JW, Gillies RJ. 2013. pH sensing and regulation in cancer. Front Physiol 4:370. doi: 10.3389/fphys.2013.00370. [DOI] [PMC free article] [PubMed] [Google Scholar]
- 9.Proud CG. 2007. Signalling to translation: how signal transduction pathways control the protein synthetic machinery. Biochem J 403:217–234. doi: 10.1042/BJ20070024. [DOI] [PubMed] [Google Scholar]
- 10.Garami A, Zwartkruis FJ, Nobukuni T, Joaquin M, Roccio M, Stocker H, Kozma SC, Hafen E, Bos JL, Thomas G. 2003. Insulin activation of Rheb, a mediator of mTOR/S6K/4E-BP signaling, is inhibited by TSC1 and 2. Mol Cell 11:1457–1466. doi: 10.1016/S1097-2765(03)00220-X. [DOI] [PubMed] [Google Scholar]
- 11.Kuo CJ, Chung J, Fiorentino DF, Flanagan WM, Blenis J, Crabtree GR. 1992. Rapamycin selectively inhibits interleukin-2 activation of p70 S6 kinase. Nature 358:70–73. doi: 10.1038/358070a0. [DOI] [PubMed] [Google Scholar]
- 12.Brunn GJ, Hudson CC, Sekulic A, Williams JM, Hosoi H, Houghton PJ, Lawrence JC Jr, Abraham RT. 1997. Phosphorylation of the translational repressor PHAS-I by the mammalian target of rapamycin. Science 277:99–101. doi: 10.1126/science.277.5322.99. [DOI] [PubMed] [Google Scholar]
- 13.Knebel A, Morrice N, Cohen P. 2001. A novel method to identify protein kinase substrates: eEF2 kinase is phosphorylated and inhibited by SAPK4/p38delta. EMBO J 20:4360–4369. doi: 10.1093/emboj/20.16.4360. [DOI] [PMC free article] [PubMed] [Google Scholar]
- 14.Wang X, Li W, Williams M, Terada N, Alessi DR, Proud CG. 2001. Regulation of elongation factor 2 kinase by p90(RSK1) and p70 S6 kinase. EMBO J 20:4370–4379. doi: 10.1093/emboj/20.16.4370. [DOI] [PMC free article] [PubMed] [Google Scholar]
- 15.Browne GJ, Proud CG. 2004. A novel mTOR-regulated phosphorylation site in elongation factor 2 kinase modulates the activity of the kinase and its binding to calmodulin. Mol Cell Biol 24:2986–2997. doi: 10.1128/MCB.24.7.2986-2997.2004. [DOI] [PMC free article] [PubMed] [Google Scholar]
- 16.Wang X, Regufe da Mota S, Liu R, Moore CE, Xie J, Lanucara F, Agarwala U, Pyr Dit Ruys S, Vertommen D, Rider MH, Eyers C, Proud CG. 2014. Eukaryotic elongation factor 2 kinase activity is controlled by multiple regulatory inputs from oncogenic and anabolic pathways. Mol Cell Biol 34:4088–4103. doi: 10.1128/MCB.01035-14. [DOI] [PMC free article] [PubMed] [Google Scholar]
- 17.Ryazanov AG, Shestakova EA, Natapov PG. 1988. Phosphorylation of elongation factor 2 by EF-2 kinase affects rate of translation. Nature 334:170–173. doi: 10.1038/334170a0. [DOI] [PubMed] [Google Scholar]
- 18.Carlberg U, Nilsson A, Nygard O. 1990. Functional properties of phosphorylated elongation factor 2. Eur J Biochem 191:639–645. doi: 10.1111/j.1432-1033.1990.tb19169.x. [DOI] [PubMed] [Google Scholar]
- 19.Dorovkov MV, Pavur KS, Petrov AN, Ryazanov AG. 2002. Regulation of elongation factor-2 kinase by pH. Biochemistry 41:13444–13450. doi: 10.1021/bi026494p. [DOI] [PubMed] [Google Scholar]
- 20.Moore CEJ, Mikolajek H, Regufe da Mota S, Wang X, Kenney JW, Werner JM, Proud CG. 2015. Elongation factor 2 kinase is regulated by proline hydroxylation and protects cells during hypoxia. Mol Cell Biol 35:1788–1804. doi: 10.1128/MCB.01457-14. [DOI] [PMC free article] [PubMed] [Google Scholar]
- 21.Diering GH, Mills F, Bamji SX, Numata M. 2011. Regulation of dendritic spine growth through activity-dependent recruitment of the brain-enriched Na(+)/H(+) exchanger NHE5. Mol Biol Cell 22:2246–2257. doi: 10.1091/mbc.E11-01-0066. [DOI] [PMC free article] [PubMed] [Google Scholar]
- 22.Pyr Dit Ruys S, Wang X, Smith EM, Herinckx G, Hussain N, Rider MH, Vertommen D, Proud CG. 2012. Identification of autophosphorylation sites in eukaryotic elongation factor-2 kinase. Biochem J 442:681–692. doi: 10.1042/BJ20111530. [DOI] [PMC free article] [PubMed] [Google Scholar]
- 23.Hall-Jackson CA, Cross DA, Morrice N, Smythe C. 1999. ATR is a caffeine-sensitive, DNA-activated protein kinase with a substrate specificity distinct from DNA-PK. Oncogene 18:6707–6713. doi: 10.1038/sj.onc.1203077. [DOI] [PubMed] [Google Scholar]
- 24.Huo Y, Iadevaia V, Yao Z, Kelly I, Cosulich S, Guichard S, Foster LJ, Proud CG. 2012. Stable isotope-labelling analysis of the impact of inhibition of the mammalian target of rapamycin on protein synthesis. Biochem J 444:141–151. doi: 10.1042/BJ20112107. [DOI] [PubMed] [Google Scholar]
- 25.Kim DH, Sarbassov DD, Ali SM, King JE, Latek RR, Erdjument-Bromage H, Tempst P, Sabatini DM. 2002. mTOR interacts with raptor to form a nutrient-sensitive complex that signals to the cell growth machinery. Cell 110:163–175. doi: 10.1016/S0092-8674(02)00808-5. [DOI] [PubMed] [Google Scholar]
- 26.Pigott CR, Mikolajek H, Moore CE, Finn SJ, Phippen CW, Werner JM, Proud CG. 2012. Insights into the regulation of eukaryotic elongation factor 2 kinase and the interplay between its domains. Biochem J 442:105–118. doi: 10.1042/BJ20111536. [DOI] [PMC free article] [PubMed] [Google Scholar]
- 27.Markley JL. 1973. Nuclear magnetic resonance studies of trypsin inhibitors. Histidines of virgin and modified soybean trypsin inhibitor (Kunitz). Biochemistry 12:2245–2250. [DOI] [PubMed] [Google Scholar]
- 28.Krezel A, Bal W. 2004. A formula for correlating pKa values determined in D2O and H2O. J Inorg Biochem 98:161–166. doi: 10.1016/j.jinorgbio.2003.10.001. [DOI] [PubMed] [Google Scholar]
- 29.Fonseca BD, Diering GH, Bidinosti MA, Dalal K, Alain T, Balgi AD, Forestieri R, Nodwell M, Rajadurai CV, Gunaratnam C, Tee AR, Duong F, Andersen RJ, Orlowski J, Numata M, Sonenberg N, Roberge M. 2012. Structure-activity analysis of niclosamide reveals potential role for cytoplasmic pH in control of mammalian target of rapamycin complex 1 (mTORC1) signaling. J Biol Chem 287:17530–17545. doi: 10.1074/jbc.M112.359638. [DOI] [PMC free article] [PubMed] [Google Scholar]
- 30.Sarbassov DD, Guertin DA, Ali SM, Sabatini DM. 2005. Phosphorylation and regulation of Akt/PKB by the rictor-mTOR complex. Science 307:1098–1101. doi: 10.1126/science.1106148. [DOI] [PubMed] [Google Scholar]
- 31.Alessi DR, James SR, Downes CP, Holmes AB, Gaffney PR, Reese CB, Cohen P. 1997. Characterization of a 3-phosphoinositide-dependent protein kinase which phosphorylates and activates protein kinase Balpha. Curr Biol 7:261–269. doi: 10.1016/S0960-9822(06)00122-9. [DOI] [PubMed] [Google Scholar]
- 32.Zheng M, Hou R, Xiao RP. 2004. Acidosis-induced p38 MAPK activation and its implication in regulation of cardiac contractility. Acta Pharmacol Sin 25:1299–1305. [PubMed] [Google Scholar]
- 33.Chresta CM, Davies BR, Hickson I, Harding T, Cosulich S, Critchlow SE, Vincent JP, Ellston R, Jones D, Sini P, James D, Howard Z, Dudley P, Hughes G, Smith L, Maguire S, Hummersone M, Malagu K, Menear K, Jenkins R, Jacobsen M, Smith GC, Guichard S, Pass M. 2010. AZD8055 is a potent, selective, and orally bioavailable ATP-competitive mammalian target of rapamycin kinase inhibitor with in vitro and in vivo antitumor activity. Cancer Res 70:288–298. doi: 10.1158/0008-5472.CAN-09-1751. [DOI] [PubMed] [Google Scholar]
- 34.Xie J, Proud CG. 2014. Signaling crosstalk between the mTOR complexes. Translation 2:e28174. doi: 10.4161/trla.28174. [DOI] [PMC free article] [PubMed] [Google Scholar]
- 35.Pavur KS, Petrov AN, Ryazanov AG. 2000. Mapping the functional domains of elongation factor-2 kinase. Biochemistry 39:12216–12224. doi: 10.1021/bi0007270. [DOI] [PubMed] [Google Scholar]
- 36.Zhang X, Lin Y, Gillies RJ. 2010. Tumor pH and its measurement. J Nucl Med 51:1167–1170. doi: 10.2967/jnumed.109.068981. [DOI] [PMC free article] [PubMed] [Google Scholar]
- 37.Becelli R, Renzi G, Morello R, Altieri F. 2007. Intracellular and extracellular tumor pH measurement in a series of patients with oral cancer. J Craniofac Surg 18:1051–1054. doi: 10.1097/scs.0b013e3180de63eb. [DOI] [PubMed] [Google Scholar]
- 38.Leprivier G, Remke M, Rotblat B, Dubuc A, Mateo AR, Kool M, Agnihotri S, El-Naggar A, Yu B, Somasekharan SP, Faubert B, Bridon G, Tognon CE, Mathers J, Thomas R, Li A, Barokas A, Kwok B, Bowden M, Smith S, Wu X, Korshunov A, Hielscher T, Northcott PA, Galpin JD, Ahern CA, Wang Y, McCabe MG, Collins VP, Jones RG, Pollak M, Delattre O, Gleave ME, Jan E, Pfister SM, Proud CG, Derry WB, Taylor MD, Sorensen PH. 2013. The eEF2 kinase confers resistance to nutrient deprivation by blocking translation elongation. Cell 153:1064–1079. doi: 10.1016/j.cell.2013.04.055. [DOI] [PMC free article] [PubMed] [Google Scholar]
- 39.Chen Z, Gopalakrishnan SM, Bui MH, Soni NB, Warrior U, Johnson EF, Donnelly JB, Glaser KB. 2011. 1-Benzyl-3-cetyl-2-methylimidazolium iodide (NH125) induces phosphorylation of eukaryotic elongation factor-2 (eEF2): a cautionary note on the anticancer mechanism of an eEF2 kinase inhibitor. J Biol Chem 286:43951–43958. doi: 10.1074/jbc.M111.301291. [DOI] [PMC free article] [PubMed] [Google Scholar]
- 40.Thiry P, Vandermeers A, Vandermeers-Piret MC, Rathe J, Christophe J. 1980. The activation of brain adenylate cyclase and brain cyclic-nucleotide phosphodiesterase by seven calmodulin derivatives. Eur J Biochem 103:409–414. doi: 10.1111/j.1432-1033.1980.tb04327.x. [DOI] [PubMed] [Google Scholar]
- 41.Kruiswijk F, Yuniati L, Magliozzi R, Low TY, Lim R, Bolder R, Mohammed S, Proud CG, Heck AJ, Pagano M, Guardavaccaro D. 2012. Coupled activation and degradation of eEF2K regulates protein synthesis in response to genotoxic stress. Sci Signal 5:ra40. doi: 10.1126/scisignal.2002718. [DOI] [PMC free article] [PubMed] [Google Scholar]
- 42.Gatenby RA, Gillies RJ. 2004. Why do cancers have high aerobic glycolysis? Nat Rev Cancer 4:891–899. doi: 10.1038/nrc1478. [DOI] [PubMed] [Google Scholar]
- 43.McCarty MF, Whitaker J. 2010. Manipulating tumor acidification as a cancer treatment strategy. Altern Med Rev 15:264–272. [PubMed] [Google Scholar]
- 44.Teleman AA, Chen YW, Cohen SM. 2005. 4E-BP functions as a metabolic brake used under stress conditions but not during normal growth. Genes Dev 19:1844–1848. doi: 10.1101/gad.341505. [DOI] [PMC free article] [PubMed] [Google Scholar]
- 45.Scheetz AJ, Nairn AC, Constantine-Paton M. 1997. N-methyl-D-aspartate receptor activation and visual activity induce elongation factor-2 phosphorylation in amphibian tecta: a role for N-methyl-D-aspartate receptors in controlling protein synthesis. Proc Natl Acad Sci U S A 94:14770–14775. doi: 10.1073/pnas.94.26.14770. [DOI] [PMC free article] [PubMed] [Google Scholar]
- 46.Searle J, Lawson TA, Abbott PJ, Harmon B, Kerr JF. 1975. An electron-microscope study of the mode of cell death induced by cancer-chemotherapeutic agents in populations of proliferating normal and neoplastic cells. J Pathol 116:129–138. doi: 10.1002/path.1711160302. [DOI] [PubMed] [Google Scholar]
- 47.Ishizaki Y, Cheng L, Mudge AW, Raff MC. 1995. Programmed cell death by default in embryonic cells, fibroblasts, and cancer cells. Mol Biol Cell 6:1443–1458. doi: 10.1091/mbc.6.11.1443. [DOI] [PMC free article] [PubMed] [Google Scholar]
- 48.Xu J, Yeh CH, Chen S, He L, Sensi SL, Canzoniero LM, Choi DW, Hsu CY. 1998. Involvement of de novo ceramide biosynthesis in tumor necrosis factor-alpha/cycloheximide-induced cerebral endothelial cell death. J Biol Chem 273:16521–16526. doi: 10.1074/jbc.273.26.16521. [DOI] [PubMed] [Google Scholar]
- 49.Tang D, Lahti JM, Grenet J, Kidd VJ. 1999. Cycloheximide-induced T-cell death is mediated by a Fas-associated death domain-dependent mechanism. J Biol Chem 274:7245–7252. doi: 10.1074/jbc.274.11.7245. [DOI] [PubMed] [Google Scholar]
- 50.Mekhail K, Khacho M, Gunaratnam L, Lee S. 2004. Oxygen sensing by H+: implications for HIF and hypoxic cell memory. Cell Cycle 3:1027–1029. doi: 10.4161/cc.3.8.1075. [DOI] [PubMed] [Google Scholar]
- 51.Connolly E, Braunstein S, Formenti S, Schneider RJ. 2006. Hypoxia inhibits protein synthesis through a 4E-BP1 and elongation factor 2 kinase pathway controlled by mTOR and uncoupled in breast cancer cells. Mol Cell Biol 26:3955–3965. doi: 10.1128/MCB.26.10.3955-3965.2006. [DOI] [PMC free article] [PubMed] [Google Scholar]


