Abstract
Several studies have shown that optical coherence tomography (OCT) can be used to measure the remaining enamel thickness and detect the location of subsurface lesions hidden under the sound enamel. The purpose of this study was to develop algorithms to enhance the visibility of subsurface structures such as hidden occlusal lesions and the dentinal-enamel junction. Extracted teeth with natural occlusal lesions were imaged with OCT with and without added high index fluids. A Rotating Kernel Transformation (RKT) nonlinear image processing filter was applied to PS-OCT images to enhance the visibility of the subsurface lesions under the sound enamel. The filter significantly increased (P<0.05) the visibility of the subsurface lesions.
Keywords: optical coherence tomography, tooth demineralization, occlusal caries lesions
1. Introduction
Occlusal caries lesions are routinely detected in the United States using visual/tactile (explorer) methods coupled with radiography. Radiographic methods have poor sensitivity for occlusal lesions, and by the time the lesions are radiolucent they have typically progressed deep into the dentin [1]. Many occlusal caries lesions have spread into the underlying dentin while the enamel surface has remained intact and these lesion are not obvious under visual examination. Some of these “hidden” lesions may show up in radiographs but many do not [2, 3]. Such lesions are more common today with the wide spread use of fluoride and new methods are needed to detect them. The Diagnodent which employs fluorescence from bacteria porphyrin molecules was developed for detecting hidden lesions, however it suffers from many false positives and it does not measure either the depth or exact position of the lesions [4, 5].
Optical coherence tomography (OCT) is a noninvasive technique for creating cross-sectional images of internal biological structure [6]. Several groups have used OCT and PS-OCT to image dental caries on both smooth surfaces and occlusal surfaces [7-10]. We have demonstrated that polarization-sensitivity is invaluable for providing depth-resolved measurements of the severity of demineralization both in vitro and in vivo [10-12]. Quantitative depth resolved measurements are useful for clinical studies and for monitoring the state of early lesions and our studies indicate that polarization sensitivity provides considerable advantages for the measurement of early demineralization near tooth surfaces [10-12]. However, many clinicians are only interested in knowing how deep the occlusal lesions have actually penetrated into the tooth so that they can decide whether a restoration is necessary.
In previous studies we demonstrated that OCT can be used to determine if occlusal lesions have penetrated to the underlying dentin by detecting lateral spread across the DEJ [13, 14]. If extensive demineralization is present from the enamel surface all the way down to the DEJ the results are quite mixed, i.e., sometimes the entire lesion is visible from the enamel surface to the DEJ, while more typically only the outer surface of the lesion is visible or the area where the lesion has reached the DEJ (lower part) can be seen. Most lesions extend laterally along the DEJ upon reaching the underlying dentin, therefore we are able to determine whether most lesions have reached the DEJ. In our previous clinical study, 12 out of 14 of the lesions examined in vivo using OCT exhibited increased reflectivity below the DEJ which suggested that the lesions had spread to the dentin. Since none of the lesions showed up on a radiograph, this is a remarkable improvement in sensitivity over existing technology [13, 14]. We previously demonstrated that index matching agents can be used to enhance the contrast of demineralization and that better images could be acquired in occlusal surfaces by use of index matching agents applied to the fissure areas [11]. Higher index agents appeared to increase the optical penetration depth of OCT. The viscosity is also important because penetration of the agent into the lesion pores can decrease the lesion contrast. Even though such penetration is anticipated to lower the contrast of the lesion near the tooth surface it is also expected to increase the optical penetration to deeper layers in the lesion. Last year we demonstrated that higher refractive index (RI) liquids can be used to increase the visibility of subsurface hidden occlusal lesions [24]. Ten teeth were investigated and there was a significant increase in the subsurface lesion visibility with the added high RI fluids. This was defined as the ratio of the magnitude of the initial surface peak over the second 2nd (DEJ) peak.
Various imaging analysis methods have been developed for enhancing structures and edges, speckle reduction and denoising OCT images [15-17]. The Rotating Kernel Transformation (RKT) is one approach that has been successful for edge detection in OCT images [18-21]. The purpose of this study was to determine if the RKT algorithm can significantly enhance the detectability of hidden subsurface lesions in PS-OCT images.
2. Materials and Methods
2.1 Sample Preparation
Teeth extracted from patients in the San Francisco Bay area were collected, cleaned and sterilized with Gamma radiation. Molars and premolars were visually inspected for caries lesions. On extracted molars these lesions are easily identified as white or brown/black (pigmented) spots on the tooth surface and specimens are readily available. Those samples with suspected lesions were further screened using a near-IR transillumination imaging system operating at 1300-nm. In the visible range it is difficult to differentiate between stains and actual decay. Many of the teeth selected by visual inspection were only stained without decay. The organic molecules that cause pigmentation apparently do not strongly absorb near-IR light and staining does not interfere in the near-IR [22, 23]. Ten samples were selected with suspected deep natural existing occlusal decay using this screening technique.
The roots were cut off and the teeth were mounted on 1.2×1.2×3 cm3 rectangular blocks of black orthodontic composite resin with the occlusal surface containing the lesion facing out from the square surface of the block. Each rectangular block fit precisely in an optomechanical assembly that could be positioned with micron accuracy.
Four fluids were used in the study; water, glycerol, BABB (33% Benzyl Alcohol + 67% Benzyl Benzoate) and a Cargille Liquid (Cedar Grove, NJ) (hydrogenated terphenyl 1-bromo-naphthalene) with a refractive index of 1.61. The fluids were added to tooth occlusal surfaces prior to OCT imaging in sufficient quantity to fill the pits and fissues.
2.2 Digital Microscopy
Images of the tooth occlusal surfaces were examined using a digital microscopy/3D surface profilometry system, the VHX-1000 from Keyence (Elmwood, NJ) with the VH-Z25 lens with a magnification from 25 to 175×. Depth composition digital microscopy images (DCDM) were acquired by scanning the image plane of the microscope and reconstructing a depth composition image with all points at optimum focus displayed in a 2D image.
2.3 Near-IR Transillumination Imaging
A 150-W fiber-optic illuminator FOI-1 E Licht Company (Denver, CO) with a low profile fiber optic with dual line lights, Model P39-987 (Edmund Scientific, Barrington, NJ) was used with each light line directed at the cementoenamel junction (CEJ) beneath the crown on the buccal and lingual sides of each tooth. Light leaving the occlusal surface was directed by a right angle prism to an InGaAs camera equipped with a Navitar (Rochester, NY) SWIR-35 lens, a 75-mm plano-convex lens LA1608-C Thorlabs (Newton, NJ) and a 90-nm wide bandpass filter centered at 1300-nm, BP1300-90 Spectrogon, (Parsippany, NJ). A 320 × 240 element InGaAs area camera SU320-KTSX (Wakefield, MA) from Sensors Unlimited (Princeton, NJ) was used with a 25-μm pixel pitch.
2.4 PS-OCT System
An all-fiber-based optical coherence domain reflectometry (OCDR) system with polarization maintaining (PM) optical fiber, high-speed piezoelectric fiber-stretchers and two balanced InGaAs receivers that was designed and fabricated by Optiphase, Inc., Van Nuys, CA. This two-channel system was integrated with a broadband superluminescent diode (SLD) Denselight (Jessup, MD) and a high-speed XY-scanning system (ESP 300 controller and 850G-HS stages, National Instruments, Austin, TX) for in vitro optical coherence tomography. The spectral output of the 15-mW SLD was centered at 1317 nm with a spectral bandwidth full-width at half-maximum (FWHM) of 84 nm. This configuration provided a lateral resolution of approximately 20 μm and an axial resolution of 10 μm in air. The system is described in greater detail in reference [10].
2.5 Polarized Light Microscopy
After sample imaging was completed, approximately 200 μm thick serial sections were cut using an Isomet 5000 saw (Buehler, IL), for polarized light microscopy (PLM). PLM was carried out using a Meiji Techno RZT microscope (Meiji Techno Co., LTD, Saitama, Japan) with an integrated digital camera, Canon EOS Digital Rebel XT (Canon Inc., Tokyo, Japan). The sample sections were imbibed in water and examined in the brightfield mode with crossed polarizers and a red I plate with 500-nm retardation.
2.6 Image Analysis and Statistics
Image processing was carried out using Igor Pro™, data analysis software (Wavemetrics Inc, Lake Oswego, OR). PS-OCT scans acquired from PM fiber based PS-OCT systems typically contain artifacts (additional peaks) due to cross-talk and the limited extinction ratio of the fiber that may confound analysis. Automated removal of such artifacts can be carried out successfully with a few extra data alteration steps after data collection. A reference A-scan was acquired from a mirror prior to scanning the samples. The reference A-scan contains several weak artifact signals along with the primary reflection. The reference array was normalized to the intensity of the point of interest and subtracted to selectively remove the artifacts and reduce noise. Background subtraction was carried out by subtracting the mean reflectivity of 5000 data points measured in air from the top 100 pixels of the 50 unprocessed A-scans outside the sample area. Tomographic images of the sample were reconstructed from the parallel B-scans. The images were convolved with a 5×5×5 anisotropic diffusion Gaussian smoothing filter with σ (= 4-μm) based on the μm/pixel ratio of sound enamel in each axis in order to reduce speckle noise. A 4×4 rotating kernel transformation (RKT) technique was applied in x-z and y-z spaces to emphasize thin edges while further suppressing speckle noise [18].
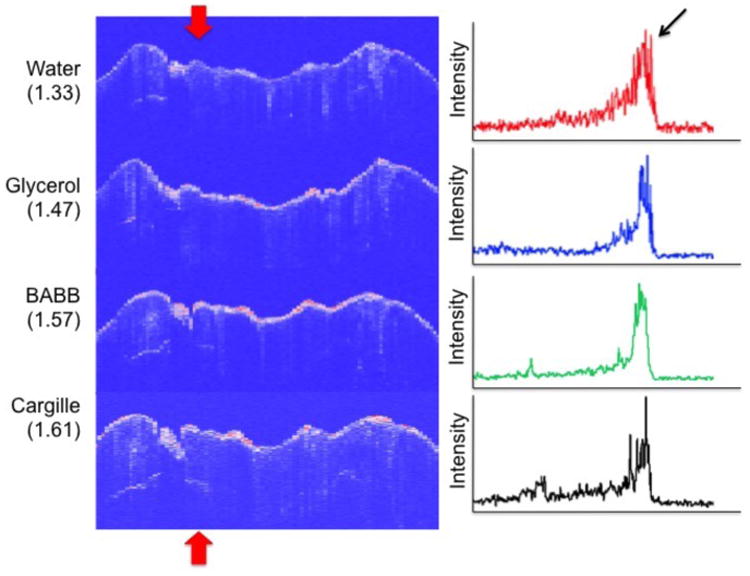
PS-OCT images were acquired of the tooth occlusal surfaces with each high index fluids applied to the tooth surfaces. Selected A-scans were chosen which contained subsurface reflections adjacent to occlusal lesions characteristic of increased reflectivity at the DEJ. The reflectance at the lesion surface in the center of the fissure is very strong and the OCT signal is quickly attenuated. However, lesions that penetrate to the DEJ typically spread laterally in the less acid resistant dentin so adjacent areas of the lesion are located under sound enamel and show up in OCT images as strong reflections well below the tooth surface usually at the position of the DEJ. These B-scans typically have two areas of increased reflectivity corresponding to the tooth surface (position 1) and the DEJ (position 2). These positions can be seen in the B-scan and A-scan images of Fig. 2. The ratio of the magnitude of the initial surface peak over the second 2nd (DEJ) peak was calculated and used as a measure of the visibility of these hidden lesions, i.e, dentinal lesions that have spread under the surrounding sound enamel.
Fig. 2.

(Left) CP-OCT B-scans taken at the position of the dotted line in Fig. 1 for the four liquids of varying refractive index (RI), water, glycerol, BABB and Cargille liquid. CP-OCT A-scans extracted at the position of the upper and lower red arrows are shown on the left. The position of the two peaks analyzed are shown by the arow for both the B-scan and A-scan images.
A paired t-test (two tailed) was used to compare the ratio of the magnitude of the peaks before and after application of the RKT filter for the ten samples with the matched RI index Cargille liquid. A significance level of 0.05 was used. Analysis was carried out using Graphpad Prism (La Jolla, CA).
3. Results and Discussion
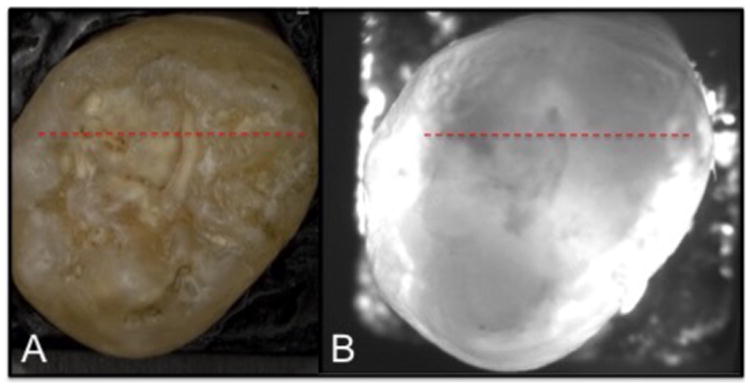
A tooth with an occlusal lesion is shown in Fig. 1. A DCDM image (visible light) acquired with the digital microscope is shown along with an image acquired using near-IR transillumination at 1300-nm. Stains are not visible in the near-IR and the dark areas visible in Fig. 1B suggest deep areas of demineralization in the fissure areas. CP-OCT B-scans are shown for each of the high index fluids (RI is shown in parenthesis) in Fig. 2 taken at the position of the red dotted line shown in Fig. 1. The A-scans were extracted at the position shown by the upper and lower red arrows and they are shown on the right side of the figure. Each A-scan shows an initial peak at position 1 (black arrow). The scans with the higher index fluids show a second peak corresponding to the subsurface position of the underlying lesion (see thick red arrows). The second subsurface peak (lesion) left of the fissure is only visible in this tooth at the position of the red arrow with the aid of the higher index fluids. The more intense subsurface area to the left of the fissure is visible in all the images.
Fig. 1.

(A) Visible depth composition image and (B) near-IR transillumination image of tooth.
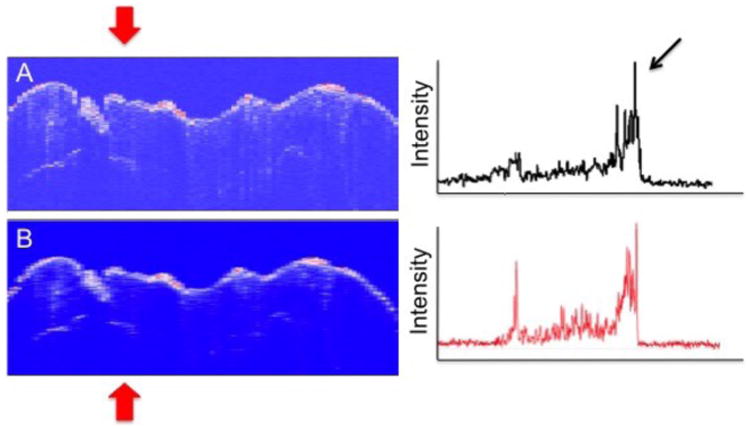
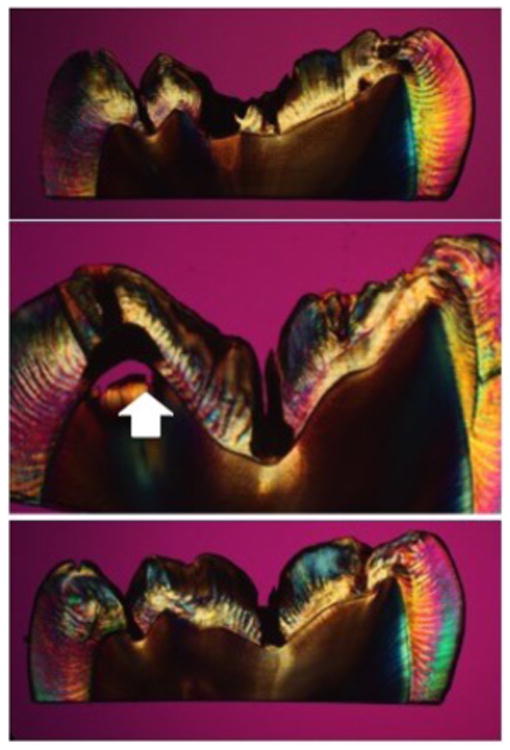
Figure 3 shows a comparison of CP-OCT scans from the same sample shown in Figs. 1 & 2 with and without use of the RKT filter. Note the enhancement of contrast for the second peak. The tooth was sectioned and polarized light microscopy images (PLM) of three of those sections are shown in Fig. 4. A subsurface lesion (black area - white arrow) matches the position of high subsurface reflectivity in the OCT images.
Fig. 3.

(Left) CP-OCT B-scans taken at the position of the dotted line in Fig. 1 for Cargille liquid before (1) and after (B) application of the RKT filter. CP-OCT A-scans extracted at the position of the upper and lower red arrows are shown on the left.
Fig. 4.

PLM sections taken from tooth in Figs. 1-3. Note spread of subsurface lesion at the position of the white arrow matching the OCT scans.
The mean intensity ratios ± standard deviation were calculated for all ten samples and they are listed in Table I of our manuscript published last year (Reference [24]) along with the refractive index and viscosity for each liquid. They are also plotted in Fig. 5 of that manuscript.
The mean intensity ratios ± standard deviation for all ten samples before and after application of the RKT filter for the samples with the Cargille liquid (1.61) were 0.82 ± 0.39 and 0.99 ± 0.45, respectively. A paired t-test (two-tailed) indicated that the mean intensity ratio increased significantly (P < 0.05) after application of the filter. The combination of the index matching fluid and RKT filter resulted in a 3-4 fold increase in the mean intensity ratio compared with water (0.29 ± 0.17).
This pilot study demonstrates the great potential of post image processing for increasing the diagnostic performance of optical coherence tomography for the detection of hidden lesions under the enamel.
Acknowledgments
This work was supported by NIH/NIDCR Grant R01-DE17869. The authors would like to thank Zihan Zhu, Kenneth Chan, Jacob Simon, Robert Lee and Michal Staninec for their help with this study.
References
- 1.Fejerskov O, Kidd E. Dental Caries: The Disease and its Clinical Management. Blackwell; Oxford: 2003. [Google Scholar]
- 2.Boston DW. Incipient and hidden caries. Dental clinics of North America. 2005;49(4):xi–xii. doi: 10.1016/j.cden.2005.05.001. [DOI] [PubMed] [Google Scholar]
- 3.Ricketts D, Kidd E, Weerheijm K, de Soet H. Hidden caries: what is it? Does it exist? Does it matter? Int Dental J. 1997;47(5):259–65. doi: 10.1002/j.1875-595x.1997.tb00786.x. [DOI] [PubMed] [Google Scholar]
- 4.Lussi A, Imwinkelried S, Pitts N, Longbottom C, Reich E. Performance and reproducibility of a laser fluorescence system for detection of occlusal caries in vitro. Caries Res. 1999;33(4):261–6. doi: 10.1159/000016527. [DOI] [PubMed] [Google Scholar]
- 5.Shi XQ, Welander U, Angmar-Mansson B. Occlusal caries detection with Kavo DIAGNOdent and Radiography:An in vitro comparison. Caries Res. 2000;34:151–158. doi: 10.1159/000016583. [DOI] [PubMed] [Google Scholar]
- 6.Bouma BE, Tearney GJ. Handbook of Optical Coherence Tomography. Marcel Dekker; New York, NY: 2002. [Google Scholar]
- 7.Colston B, Everett M, Da Silva L, Otis L, Stroeve P, Nathel H. Imaging of hard and soft tissue structure in the oral cavity by optical coherence tomography. Applied Opt. 1998;37(19):3582–3585. doi: 10.1364/ao.37.003582. [DOI] [PubMed] [Google Scholar]
- 8.Feldchtein FI, Gelikonov GV, Gelikonov VM, Iksanov RR, Kuranov RV, Sergeev AM, Gladkova ND, Ourutina MN, Warren JA, Reitze DH. In vivo OCT imaging of hard and soft tissue of the oral cavity. Opt Express. 1998;3(3):239–251. doi: 10.1364/oe.3.000239. [DOI] [PubMed] [Google Scholar]
- 9.Baumgartner A, Dicht S, Hitzenberger CK, Sattmann H, Robi B, Moritz A, Sperr W, Fercher AF. Polarization-sensitive optical optical coherence tomography of dental structures. Caries Res. 2000;34:59–69. doi: 10.1159/000016571. [DOI] [PubMed] [Google Scholar]
- 10.Fried D, Xie J, Shafi S, Featherstone JD, Breunig TM, Le C. Imaging caries lesions and lesion progression with polarization sensitive optical coherence tomography. J Biomed Opt. 2002;7(4):618–27. doi: 10.1117/1.1509752. [DOI] [PubMed] [Google Scholar]
- 11.Jones RS, Fried D. The Effect of High Index Liquids on PS-OCT Imaging of Dental Caries. Lasers in Dentistry XI, Proc of SPIE. 2005;5687:34–41. [Google Scholar]
- 12.Ngaotheppitak P, Darling CL, Fried D. Polarization Optical Coherence Tomography for the Measuring the Severity of Caries Lesions. Lasers Surg Med. 2005;37(1):78–88. doi: 10.1002/lsm.20169. [DOI] [PubMed] [Google Scholar]
- 13.Douglas SM, Fried D, Darling CL. Imaging natural occlusal caries lesions with optical coherence tomograph. Lasers in Dentistry XVI, Proc of SPIE. 2010;7549:N1–7. doi: 10.1117/12.849344. [DOI] [PMC free article] [PubMed] [Google Scholar]
- 14.Staninec M, Douglas SM, Darling CL, Chan K, Kang H, Lee RC, Fried D. Nondestructive Clinical Assessment of Occlusal Caries Lesions using Near-IR Imaging Methods. Lasers Surg Med. 2011;43(10):951–959. doi: 10.1002/lsm.21139. [DOI] [PMC free article] [PubMed] [Google Scholar]
- 15.Schmitt JM, Xiang SH, Yung KM. Speckle Reduction Techniques. Marcel Dekker; New York, NY: 2002. [Google Scholar]
- 16.Marks DL, Ralston TS, Boppart SA. Data Analysis and Signal Postprocessing for Optical Coherence Tomography Technology. Springer; New York, NY: 2008. [Google Scholar]
- 17.Rogowska J. Digital Image Processing Techniques for Speckle Reduction, Enhancement, and Segmentation of Optical Coherence Tomography (OCT) Images. Elsevier; London: 2006. [Google Scholar]
- 18.Lee YK, Rhodes WT. Nonlinear image processing by a rotating kernel transformation. Opt Lett. 1990;15(23):1383–1385. doi: 10.1364/ol.15.001383. [DOI] [PubMed] [Google Scholar]
- 19.Rogowska J, Brezinski ME. Evaluation of the adaptive speckle suppression filter for coronary optical coherence tomography imaging. IEEE Trans Med Imaging. 2000;19(12):1261–6. doi: 10.1109/42.897820. [DOI] [PubMed] [Google Scholar]
- 20.Rogowska J, Brezinski ME. Image processing techniques for noise removal, enhancement and segmentation of cartilage OCT images. Phys Med Biol. 2002;47(4):641–55. doi: 10.1088/0031-9155/47/4/307. [DOI] [PubMed] [Google Scholar]
- 21.Lee RC, Kang H, Darling CL, Fried D. Automated assessment of the remineralization of artificial enamel lesions with polarization-sensitive optical coherence tomography. Biomed Opt Express. 2014;5(9):2950–62. doi: 10.1364/BOE.5.002950. [DOI] [PMC free article] [PubMed] [Google Scholar]
- 22.Lee D, Fried D, Darling C. Near-IR multi-modal imaging of natural occlusal lesions. Lasers in Dentistry XV, Proc of SPIE. 2009;7162:X:1–7. doi: 10.1117/12.816866. [DOI] [PMC free article] [PubMed] [Google Scholar]
- 23.Bühler CM, Ngaotheppitak P, Fried D. Imaging of occlusal dental caries (decay) with near-IR light at 1310-nm. Opt Express. 2005;13(2):573–582. doi: 10.1364/opex.13.000573. [DOI] [PubMed] [Google Scholar]
- 24.Kang H, Darling CL, Fried D. Enhancing the detection of hidden occlusal caries lesions with OCT using high index liquids. Lasers in Dentistry XX, Proc of SPIE. 2014;8929:O:1–7. doi: 10.1117/12.2045681. [DOI] [PMC free article] [PubMed] [Google Scholar]


