Abstract
In this paper, we present a new approach to calculate 2D strain through the registration of the pre- and post-compression (deformation) B-mode image sequences based on an intensity-based non-rigid registration algorithm (INRA). Compared with the most commonly used cross-correlation (CC) method, our approach is not constrained to any particular set of directions, and can overcome displacement estimation errors introduced by incoherent motion and variations in the signal under high compression. This INRA method was tested using phantom and in vivo data. The robustness of our approach was demonstrated in the axial direction as well as the lateral direction where the standard CC method frequently fails. In addition, our approach copes well under large compression (over 6%). In the phantom study, we computed the strain image under various compressions and calculated the signal-to-noise (SNR) and contrast-to-noise (CNS) ratios. The SNR and CNS values of the INRA method were much higher than those calculated from the CC-based method. Furthermore, the clinical feasibility of our approach was demonstrated with the in vivo data from patients with arm lymphedema.
Keywords: Ultrasound, elastography, strains imaging, image registration
1. INTRODUCTION
Ultrasound elasticity imaging describes the compressibility of biological tissues [1]. Changes in tissue stiffness often correlate with pathological phenomena, and can be indicators of diseases, such as cancer or cardiovascular illness [2]. In elasticity (strain) imaging, the displacement or deformation of tissue is estimated using pre- and post-compression image data. The resulting strain measurement could provide insight into the elastic properties of tissues [3].
Most elastography techniques estimate tissue displacements based on an amplitude correlation [4, 5] or a phase correlation of the radio-frequency (RF) echoes [6, 7]. Such cross-correlation (CC) provides an accurate and effective estimator of the similarities between the echo fields, and is capable of tracking small displacements even when very low strains (less than 2%) are involved. However, elastography is often degraded by decorrelation noise, especially when incoherent motion [4, 7-9], and non-rigid tissue deformation [10, 11] between the pre- and post-compression (deformation) are present. In fact, incoherent motion and variations in the signal from scatterers at high compression lead to displacement estimation errors [12] and ambiguities in the determination of the motion vectors [13].
Attempts have been made to adapt the correlation algorithm to provide sub-sample accuracy and multi-level estimation stability [14-18]. These approaches proved to be valuable, however, the motion is estimated in sub-windows where it is supposed to be linear [19] or constant [20], and the continuity of the motion field in the whole domain. When the continuity assumption is violated, a tracking algorithm might not only fail to find the correct displacement at any particular point, but also propagate this incorrect estimate into other parts of the image, producing so-called drop-outs. To avoid this problem, incorrect displacement estimates can be detected and replaced by values interpolated from nearby points before they get a chance to propagate [18, 21]. While most previously mentioned methods use tissue motion continuity to confine the search range for the neighboring windows, the displacement of each window is calculated independently, and hence is sensitive to signal decorrelation.
In this paper, we developed a new approach to measure 2D strain at high compression by registration of pre-stress and post-stress B-mode image sequences, which combines the advantages of intensity-based similarity measures with a non-rigid transformation model.
2. METHODS
To be able to calculate the strain of the biological tissue, the displacement (deformation) of the tissue from pre-stress to post-stress has to be determined. This is equivalent to finding the corresponding point before and after compression for each point of the tissue. Elasticity image reconstructions are considered as a non-rigid image registration problem. We use a hierarchical transformation model which captures the global and local transformation for the displacement estimation of tissue under compression. The global displacement of the tissue is modeled by an affine transformation, while the local transformation is described by a non-rigid deformation based on B-splines [22]. Since the intensity and contrast between the pre-compression and post-compression may change, we will use voxel-based similarity measures based on normalized mutual information.
2.1 Transform Model
The overall displacement of the tissue is described using the global displacement model. Compared with a rigid transformation, which is parameterized by 6 degrees of freedom, describing the rotations and translations of the tissue, an affine transformation is a more general class of transformations, and it has six additional degrees of freedom, describing scaling and shearing. It is defined as:
| (1) |
where the coefficients parameterize the 6 degrees of freedom of the transformation.
Because of the difference in tissue elasticity characteristics, the regional deformation in the tissue can vary significantly under loaded external pressure. Therefore, it is difficult to describe the regional deformation via parameterized transformations [23]. Instead, a multi-level B-splines deformation model [24-26] has been applied to displacement analysis in this paper. The resulting deformation controls the shape of the object and produces a smooth and continuous transformation. A hierarchical multi-resolution approach [22] has been applied, in which the resolution of the control mesh is increased, along with the image resolution, in a coarse to fine style. At each level of resolution the spacings between the control points in the and directions are denoted by and, respectively. By moving the control points independently of each other, the space between them is deformed non-rigidly. At any position (x,y) of each level the deformation is computed from the positions of the surrounding 4 × 4 neighborhood of control points. The regional transformation at level c of resolution is defined by each control mesh Φc, and the corresponding spline-based transformation, and their sum of the regional transformation FFFD is defined as
| (2) |
Here, l and m denote the index of the control point cell containing (x,y), and s and t are the relative positions of x and y, respectively, inside that cell in the two dimensions, . The function βi represents the ith basis function of the B-spline
| (3) |
Here the regional transformation is represented as a combination of B-spline deformation s at increasing resolutions of the control point mesh. The control point mesh at level is refined by inserting new control points to create the control point mesh at level c+1, and the values of the new control points Φc+1 can be calculated directly from those of Φc [27]. The control points Φc are parameters of the B-spline deformation, and the degree of non-rigid displacement that can be modeled depends essentially on the resolution of the mesh of control points Φc. The large lattice spacing δ permits the representation of non-rigid displacements of the whole image, whereas the fine lattice allows for modeling highly regional non-rigid displacements.
The goal of the displacement estimation in ultrasound elastography is to obtain a 2D map of the tissue’s mec anical properties, that is, to find the optimal transformation F which maps any point in the post-deformation image into its corresponding point in the pre-deformation reference image. Finally a combined transformation F consisting of a global and regional transformation has been applied
| (4) |
2.2 Smoothness Constraint
To constrain the smoothness of the spline-based transformation, a penalty term is introduced, which is based on the bending energy of a thin plate of metal that is subjected to bending deformations [28]. It is composed of second-order derivatives of the deformation
| (5) |
where Ω denotes the volume of the image domain. This regularization term penalizes only non-affine transformations. The second-order derivatives of the B-spline transformation are computed by substituting the appropriate derivatives for the corresponding polynomials. Mixed second-order derivatives with respect to the two different variables are computed by substituting two B-spline polynomials with their respective first-order derivatives.
2.3 Similarity Measure
Central to mutual information (MI) is the Shannon entropy [29], H, which relates to the average information supplied by a given set of parameters, ν, whose probabilities are given by P(v). The expression for the Shannon entropy with respect to a discrete parameter probability is
| (6) |
In order to relate a post-deformation image to the pre-deformation reference image, a similarity criterion which measures the degree of alignment between both images, must be defined. Because the image intensity and contrast (the amplitude of RF signals) might change after a large compression, a direct comparison (i.e. cross correlation) of image intensities cannot be used as a similarity measure. By characterizing two images using the probability distribution function (PDF) based on the joint histogram and minimizing the joint entropy correlates with better image-to-image alignment. An alternative voxel-based similarity measure is MI [30, 31], and it is based on the concept of information theory and expresses the amount of information that a pre-deformation image IPre contains about a post-deformation image IPost. The MI will be maximized when both images are aligned. MI relies on the overlap between the two images [32]; to avoid any dependency on the amount of image overlap, NMI as a measure of image alignment is proposed and it is written as
| (7) |
where H(IPre) and H(IPost) denotes the marginal entropies of IPre and IPre and H(IPre) and H(IPost) denotes their joint entropy, which is calculated from the joint histogram of IPre and IPre.
2.4 Optimization
In order to find the optimal transformation, we minimize a cost function associated with the global and regional transformation parameters. In addition to the NMI similarity measure ENMI, our registration method incorporates an additional penalty term ESmooth to constrain the deformation of the coordinate space. The cost function comprises two competing goals. A user-defined weighting factor τ(0 ≤ τ 1) controls the relative influence of ENMI and ESmooth, combining both into the overall cost function ETotal as follows:
| (8) |
Here, τ is the weighting parameter which defines the tradeoff between the alignment of the two images and the smoothness of the transformation. Finding the parameters of the nonrigid transformation that optimize the joint cost function requires an efficient and robust optimization algorithm. The optimization proceeds include two stages. During the first stage, the affine transformation parameters are optimized. Since the smoothness term of the cost function is zero (τ = 0) for any affine transformation, this step is equivalent to maximizing the image similarity. During the second stage, the non-rigid transformation parameters Φ are optimized as a function in the cost function. In each stage the gradient of the cost function is computed, and a line search is performed for the optimum parameters along the gradient direction [22].This procedure is repeated until the cost function cannot be improved any further.
3. EXPERIMENTS AND RESULTS
In order to validate our non-rigid registration based elastography method, we conducted a phantom and in vivo ultrasound studies using a clinical scanner (SonixTouch, Ultrasonix, British Columbia, Canada). The elastography phantom (Model 059, CIRS) and in-vivo human hand were scanned using the L14-5/38 linear probe (128 elements) at 10 MHz center frequency. The in-vivo arm data were acquired using the BPL9-5/55 probe (256 elements) at 6.5 MHz center frequency. For the CC-based method, 4 levels from coarse to fine were used. We used τ = 0.01for the cost function and 3×3 grid spaces for our registration-based method.
This phantom includes several dense masses (lesions). The elasticity (stiffness) of the each dense mass is at least two times greater than the elasticity of the background, which has an elastic modulus of 20 kPa ± 5kPa. For phantom results we calculate the signal-to-noise ratio (SNR) and contrast to noise ratio (CNR) to assess the performance of our method according to
| (9) |
where mt and mt are the spatial strain average of the target and background, are the spatial strain variance of the target and background, and and are the spatial average and variance of a window in the strain image, respectively.
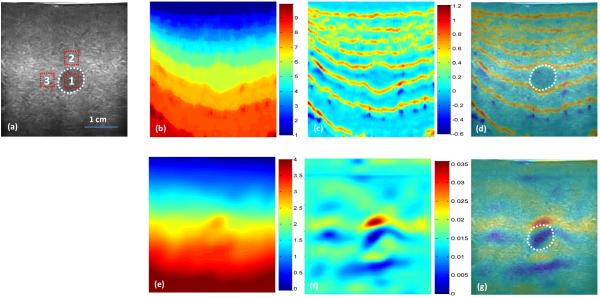
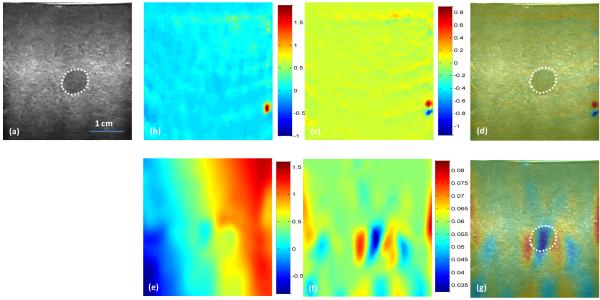
Figures 1 shows the comparison of the elastography results of the INRA and CC-based methods along the axial direction of the elastography phantom. The breast lesion is clearly visualized on the strain and B-mode fusion image of the INRA method, yet is not clear on the fusion image of the CC-based method. Figure 2 shows the comparison of the elastography results of the INRA and CC-based method along the lateral direction of the elastography phantom. The breast lesion is still clear on the B-mode and strain fusion image of the INRA method, and is not visible on the fusion image of the CC-based method. Compared with the INRA method, the CC-based block match has more artifacts in the axial strain image and the breast lesion in phantom almost cannot be seen in lateral strain images. However, the INRA method can detect the lesion in both the axial and lateral strain images.
Fig. 1. Phantom experiment results – axial direction.
(a) B-mode image of the breast phantom with a lesion (white dotted line); CC-based elastography results (top row): (b) Displacement, (c) Strain, and (d) Strain and B-mode fused image; INRA-based elastography results (bottom row): (e) Displacement, (f) Strain, and (g) Strain and B-mode fused image.
Fig. 2. Phantom experiment results – lateral direction.
(a) B-mode image of the breast phantom with a lesion; CC-based elastography results (top row): (b) Displacement, (c) Strain, and (d) Strain and B-mode fused image; INRA-based elastography results (bottom row): (e) Displacement, (f) Strain, and (g) Strain and B-mode fused image.
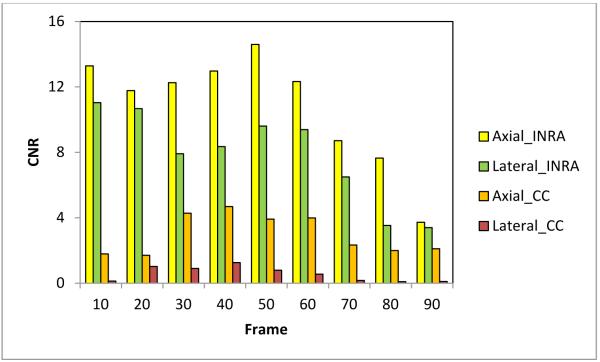
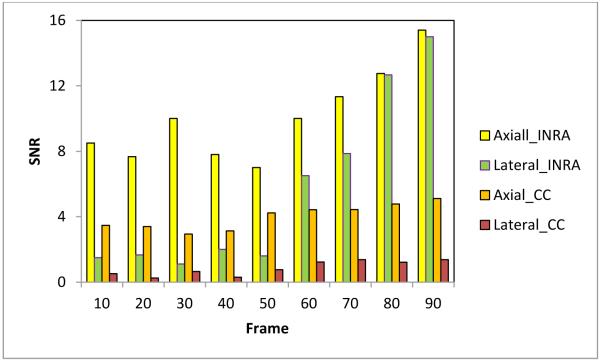
In order to quantitatively compare the INRA method with the traditional CC-based method, we used Eq. (9) to calculate the CNR and SNR in the axial and lateral strain images. We captured 90 frames of B-mode images and RF data while the pressure was evenly loaded by the probe. We used the first frame as the reference frame, and selected every 10th frame (10th, 20th 30th, 40th, and etc.) as the floating frames to compare the CNR and SNR under various pressure deformations. The region of interest (ROI) 1 shown in Fig. 2 was used as the target. ROIs 2 and 3 were used as the background. ROIs 1 and 2 were used to calculate the CNR in the axial strain images, and ROIs 1 and 3 were used to calculate the CNR in the lateral strain images. Figures 3 and 4 illustrate the comparison of CNR and SNR between the two methods in the axial and lateral strains at different pressures (frames).
Fig. 3.
Comparison of the axial and lateral CNR.
Fig. 4.
Comparison of the axial and lateral SNR.
For the both methods, the CNR and SNR in the axial strain were higher than the lateral strain. The CNR and SNR at corresponding directions of our INRA method were significantly higher than the CC-based method. The CNRs for both methods at two directional strains finally decreased along the pressure (deformation) increase, while the SNRs increased along the pressure increase. The INRA method was better than the CC-based method in the CNR and SNR. In particular, the proposed INRA method can work well under high pressure and large deformation.
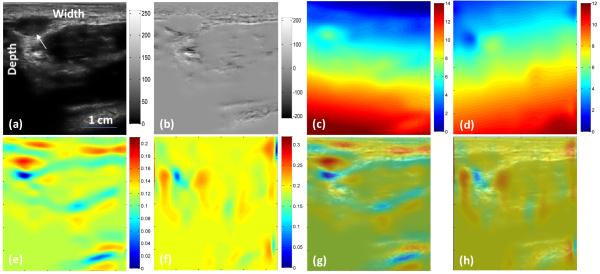
In the in-vivo study, the CC-based method failed due to the large pressure and motion (over 6% strain). Figure 5 shows the INRA-based results from the in vivo palm data and Fig. 6 shows the results from in vivo arm data. Our method detected the soft tissue (white arrows) as shown red regions in Fig. 4(e) and 5(e). From these two experiments we proved when we gave a large pressure to a probe, the intensity in the B-mode or the amplitude in RF will have a big deference. But we apply the NMI to calculate the similarity, so the intensity or amplitude changes will not affect our method and make our method robust.
Fig. 5. In vivo results of the palm.
(a) Pre-compression B-mode image of the palm, (b) B-mode intensity difference between pre- and post-compression, (c) Axial displacement, (d) Lateral displacement, (e) Axial strain image from the INRA method, (f) Lateral strain image from the INRA method, (g) Axial fusion image of the B-mode and strain images, and (h) Lateral fusion image of the B-mode and strain images.
Fig. 6. In vivo results of the arm.

(a) Pre-compression B-mode image of the arm, (b) B-mode intensity difference between pre- and post-compression, (c) Axial displacement, (d) Lateral displacement, (e) Axial strain image from INRA method, (f) Lateral strain image from INRA method, (g) Axial fusion image of the B-mode and strain images, and (h) Lateral fusion image of the B-mode and strain images.
4. CONCLUSIONS
We have described a novel 2D strain estimation technology using intensity-based non-rigid registration for ultrasonic elasticity imaging. This method is an alternative approach towards 2D or 3D displacement estimation, which combines the advantages of voxel-based similarity measures with a non-rigid transformation model of tissue. The INRA-based strain estimation is not constrained to any particular set of directions, is insensitive to nonlinear and incoherent motion as well as large signal variations under high pressure (big compression). The preliminary investigation suggests the robustness of this INRA method in phantom and in vivo data sets; this method could become useful in many clinical applications, such as arm lymphedema.
ACKNOWLEDGEMENTS
This research is supported in part by DOD PCRP Award W81XWH-13-1-0269, and National Cancer Institute (NCI) Grant CA114313.
REFERENCES
- [1].Parker KJ, Doyley MM, Rubens DJ. Imaging the elastic properties of tissue: the 20 year perspective. Phys Med Biol. 2011;56(1):R1–R29. doi: 10.1088/0031-9155/56/1/R01. [DOI] [PubMed] [Google Scholar]
- [2].Wells PNT, Liang HD. Medical ultrasound: imaging of soft tissue strain and elasticity. Journal of the Royal Society Interface. 2011;8(64):1521–1549. doi: 10.1098/rsif.2011.0054. [DOI] [PMC free article] [PubMed] [Google Scholar]
- [3].Ophir J, Alam SK, Garra B, et al. Elastograp y: ultrasonic estimation and imaging of the elastic properties of tissues. Proceedings of the Institution of Mec anical Engineers Part H-Journal of Engineering in Medicine. 1999;213(H3):203–233. doi: 10.1243/0954411991534933. [DOI] [PubMed] [Google Scholar]
- [4].Viola F, Walker WF. A comparison of the performance of time-delay estimators in medical ultrasound. IEEE Trans Ultrason Ferroelectr Freq Control. 2003;50(4):392–401. doi: 10.1109/tuffc.2003.1197962. [DOI] [PubMed] [Google Scholar]
- [5].Greenleaf JF, Fatemi M, Insana M. Selected met ods for imaging elastic properties of biological tissues. Annual Review of Biomedical Engineering. 2003;5:57–78. doi: 10.1146/annurev.bioeng.5.040202.121623. [DOI] [PubMed] [Google Scholar]
- [6].Pesavento A, Perrey C, Krueger M, et al. A time-efficient and accurate strain estimation concept for ultrasonic elastograp y using iterative p ase zero estimation. Ieee Transactions on Ultrasonics Ferroelectrics and Frequency Control. 1999;46(5):1057–1067. doi: 10.1109/58.796111. [DOI] [PubMed] [Google Scholar]
- [7].Lindop JE, Treece GM, Gee AH, et al. P ase-based ultrasonic deformation estimation. Ieee Transactions on Ultrasonics Ferroelectrics and Frequency Control. 2008;55(1):94–111. doi: 10.1109/TUFFC.2008.620. [DOI] [PubMed] [Google Scholar]
- [8].Hall TJ, Z u YN, Spalding CS. In vivo real-time free and palpation imaging. Ultrasound in Medicine and Biology. 2003;29(3):427–435. doi: 10.1016/s0301-5629(02)00733-0. [DOI] [PubMed] [Google Scholar]
- [9].Treece G, Lindop J, Chen LJ, et al. Real-time quasi-static ultrasound elastography. Interface Focus. 2011;1(4):540–552. doi: 10.1098/rsfs.2011.0011. [DOI] [PMC free article] [PubMed] [Google Scholar]
- [10].Rivaz H, Boctor EM, Choti MA, et al. Real-Time Regularized Ultrasound Elastograp y. Ieee Transactions on Medical Imaging. 2011;30(4):928–945. doi: 10.1109/TMI.2010.2091966. [DOI] [PubMed] [Google Scholar]
- [11].Yeung F, Levinson SF, Parker KJ. Multilevel and motion model-based ultrasonic speckle tracking algorit ms. Ultrasound in Medicine and Biology. 1998;24(3):427–441. doi: 10.1016/s0301-5629(97)00281-0. [DOI] [PubMed] [Google Scholar]
- [12].Insana MF, Cook LT, aturvedi PC. Analytical study of bioelasticity ultrasound systems. Information Processing in Medical Imaging, Proceedings. 1999;1613:1–14. [Google Scholar]
- [13].aturvedi PC, Insana MF, Hall TJ. Testing the limitations of 2-D companding for strain imaging using p antoms. Ultrasonics, Ferroelectrics and Frequency Control, IEEE Transactions on. 1998;45(4):1022–1031. doi: 10.1109/58.710585. [DOI] [PubMed] [Google Scholar]
- [14].Bai J, Ding CX, Fan Y. A multi-scale algorithm for ultrasonic strain reconstruction under moderate compression. Ultrasonics. 1999;37(7):511–519. [Google Scholar]
- [15].Varghese T, Bilgen M, Ophir J. Multiresolution imaging in elastograp y. Ieee Transactions on Ultrasonics Ferroelectrics and Frequency Control. 1998;45(1):65–75. doi: 10.1109/58.646912. [DOI] [PubMed] [Google Scholar]
- [16].Dey J, Mai JJ, Insana MF. Multi-resolution approac to strain imaging. 2000 Ieee Ultrasonics Symposium Proceedings. 2000;1 and 2:1853–1856. [Google Scholar]
- [17].Shi HR, Varghese T. Two-dimensional multi-level strain estimation for discontinuous tissue. Physics in Medicine and Biology. 2007;52(2):389–401. doi: 10.1088/0031-9155/52/2/006. [DOI] [PubMed] [Google Scholar]
- [18].Zhu YN, Hall TJ. A modified block matching method for real-time freehand strain imaging. Ultrasonic Imaging. 2002;24(3):161–176. doi: 10.1177/016173460202400303. [DOI] [PubMed] [Google Scholar]
- [19].Maurice RL, Bertrand M. Lagrangian speckle model and tissue-motion estimation--theory. IEEE Trans Med Imaging. 1999;18(7):593–603. doi: 10.1109/42.790459. [DOI] [PubMed] [Google Scholar]
- [20].Pellot-Barakat C, Frouin F, Insana MF, et al. Ultrasound elastograp y based on multiscale estimations of regularized displacement fields. Medical Imaging, IEEE Transactions on. 2004;23(2):153–163. doi: 10.1109/TMI.2003.822825. [DOI] [PMC free article] [PubMed] [Google Scholar]
- [21].Jiang J, J. Hall T. A parallelizable real-time motion tracking algorithm with applications to ultrasonic strain imaging. Physics in Medicine and Biology. 2007;52(13):3773–3790. doi: 10.1088/0031-9155/52/13/008. [DOI] [PubMed] [Google Scholar]
- [22].Rueckert D, Sonoda LI, Hayes C, et al. Nonrigid registration using free-form deformations: Application to breast MR images. Ieee Transactions on Medical Imaging. 1999;18(8):712–721. doi: 10.1109/42.796284. [DOI] [PubMed] [Google Scholar]
- [23].Yang XF, Akbari H, Halig L, et al. 3D Non-rigid Registration Using Surface and Local Salient Features for Transrectal Ultrasound Image-guided Prostate Biopsy. Medical Imaging 2011: Visualization, Image-Guided Procedures, and Modeling. 2011:7964. doi: 10.1117/12.878153. [DOI] [PMC free article] [PubMed] [Google Scholar]
- [24].Lee S, Wolberg G, Shin SY. Scattered data interpolation wit multilevel B-splines. Ieee Transactions on Visualization and Computer Graphics. 1997;3(3):228–244. [Google Scholar]
- [25].Rohlfing T, Maurer CR, Jr., Bluemke DA, et al. Volume-preserving nonrigid registration of MR breast images using free-form deformation wit an incompressibility constraint. Medical Imaging, IEEE Transactions on. 2003;22(6):730–741. doi: 10.1109/TMI.2003.814791. [DOI] [PubMed] [Google Scholar]
- [26].Bardinet E, Cohen LD, Ayache N. Tracking and motion analysis of the left ventricle wit deformable superquadrics. Med Image Anal. 1996;1(2):129–49. doi: 10.1016/S1361-8415(96)80009-0. [DOI] [PubMed] [Google Scholar]
- [27].Forsey DR, Bartels RH. Hierarc ical B-spline refinement. SIGGRAPH Comput. Graph. 1988;22(4):205–212. [Google Scholar]
- [28].Bookstein FL. Principal Warps - Thin-Plate Splines and the Decomposition of Deformations. IEEE Transactions on Pattern Analysis and Machine Intelligence. 1989;11(6):567–585. [Google Scholar]
- [29].Shannon CE. A Mathematical T eory of Communication. Bell System Technical Journal. 1948;27(4):623–656. [Google Scholar]
- [30].Collignon A, Maes F, Delaere D, et al. Automated multi-modality image registration based on information theory. Information Processing in Medical Imaging. 1995;3:263–274. [Google Scholar]
- [31].Viola P, Wells WM. Alignment by maximization of mutual information. Fift International Conference on Computer Vision, Proceedings. 1995:16–23. [Google Scholar]
- [32].Studholme C, Hill DLG, Hawkes DJ. An overlap invarianthentropy measure of 3D medical image alignment. Pattern Recognition. 1999;32(1):71–86. [Google Scholar]


