Abstract
Medical imaging plays a key role in guiding treatment of traumatic brain injury (TBI) and for diagnosing intracranial hemorrhage; most commonly rapid computed tomography (CT) imaging is performed. Outcomes for patients with TBI are variable and difficult to predict upon hospital admission. Quantitative outcome scales (e.g., the Marshall classification) have been proposed to grade TBI severity on CT, but such measures have had relatively low value in staging patients by prognosis. Herein, we examine a cohort of 1,003 subjects admitted for TBI and imaged clinically to identify potential prognostic metrics using a “big data” paradigm. For all patients, a brain scan was segmented with multi-atlas labeling, and intensity/volume/texture features were computed in a localized manner. In a 10-fold cross-validation approach, the explanatory value of the image-derived features is assessed for length of hospital stay (days), discharge disposition (five point scale from death to return home), and the Rancho Los Amigos functional outcome score (Rancho Score). Image-derived features increased the predictive R2 to 0.38 (from 0.18) for length of stay, to 0.51 (from 0.4) for discharge disposition, and to 0.31 (from 0.16) for Rancho Score (over models consisting only of non-imaging admission metrics, but including positive/negative radiological CT findings). This study demonstrates that high volume retrospective analysis of clinical imaging data can reveal imaging signatures with prognostic value. These targets are suited for follow-up validation and represent targets for future feature selection efforts. Moreover, the increase in prognostic value would improve staging for intervention assessment and provide more reliable guidance for patients.
Keywords: Traumatic Brain Injury, Multi-Atlas Segmentation, Computed Tomography, Machine Learning, Clinical Imaging
1. INTRODUCTION
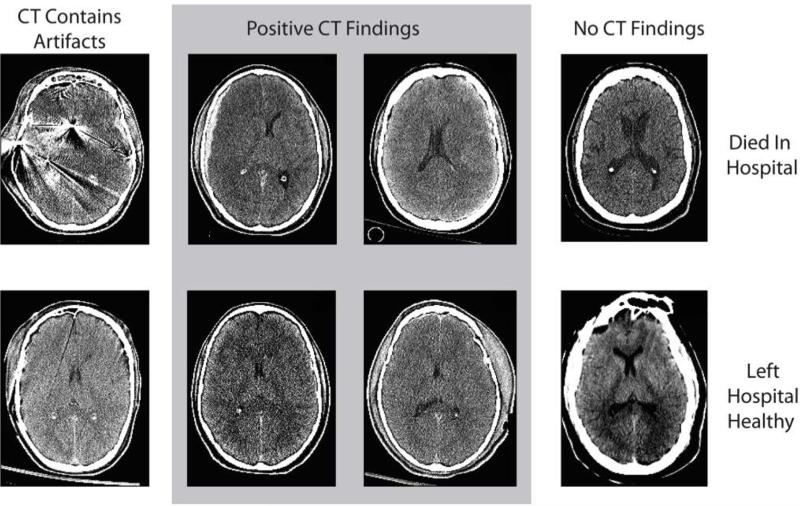
Traumatic brain injury (TBI) afflicts 1.7 million each year, resulting in 1.4 million emergency department visits[1]. Upon presentation to the emergency department, patients are typically administered a computed tomography (CT) scan to assess for bleeds and large-scale structural changes such as midline shifts. A radiologist typically interprets scans and may assign a score based on the Modified Marshall Scale according to the findings of the scan[2]. Analysis of clinically acquired CT scans provides significant challenge given low signal-to-noise ratio (SNR) and inconsistent scan protocols (Figure 1).
Figure 1.
Examples of varying levels of visual evidence of traumatic brain injury patients. Patients in the top row died while in the hospital and patients in the bottom row left the hospital to live at home. Patients in the first column had artifacts in their CT, patients in the middle two columns had positive CT findings, and patients in the right column had negative CT findings.
Several studies have clinical and imaging biomarkers in evaluating outcomes of TBI. These studies have primarily focused on the assessment of biomarkers for long-term outcomes such as mortality at six months. The predictive models built in these studies focus on clinical admission features and demographic characteristics, radiologist defined findings, and laboratory values. These models account for over 70% of the variance in long-term outcomes, but they overlook the potential prognostic value of image-derived features beyond the qualitative imaging findings which are identified by radiologist interpretation[1, 3-6].
Multi-atlas segmentation provides a flexible tool for region of interest (ROI) localization. In the general case, multi-atlas segmentation utilizes expertly labeled volumes registered to a target volume and incorporates spatial and intensity information to identify ROIs in a scan of interest[7, 8]. In previous studies, multi-atlas segmentation has been used to track changes in subject ROIs over time, classify diseased and health subjects, and quantify changes under various perturbations[9, 10].
In this study, we use multi-atlas segmentation with intensity, spatial, and texture features to analyze clinically acquired CT scans from patients admitted for a possible TBI. Over 33,000 features are calculated based on the images and are combined with demographic and clinical features to build predictive models of short-term outcomes of the patient's TBI.
2. METHODS
In this section, we present the techniques used to perform the multi-atlas segmentation, calculate features about each subject, and to build predictive models of the length of stay of the patient, the patient's discharge disposition, and the patient's Rancho Score[11]. Length of stay is coded as the number of days a subject spent in the hospital following presentation to the emergency department. Discharge disposition is represented by an ordinal scale from 1-5 which is presumed to approximate the subject's health at the time of discharge. A discharge disposition of 1 corresponds to a subject dying in the hospital and a discharge disposition of 5 corresponds to the subject leaving the hospital in perfect health. A disposition between 1 and 5 corresponds to the level of extra care needed upon discharge. The Rancho Score ranges from 1 to 8 and represents the patient's level of cognitive functioning at discharge. Rancho Scores were extracted from medical archives, but were only assessed clinically for a subset of 384 patients within the cohort[11]. A secondary cohort of patient scans was acquired after the initial cohort of 1,003 subjects. These 1,216 were kept as an extra cross- validation cohort to independently validate the learned models on a subset of subjects held out not only from the training of the models, but also from the processing of the original data. These two data sets are defined as the primary data set and the external data set and show no major differences in clinical or outcome variables(Table 1&2).
Table 1.
Counts of Discrete Clinical Features from Primary and External Datasets
| Feature | Count Primary | Count External | Feature | Count Primary | Count External |
|---|---|---|---|---|---|
| Non-Caucasian | 155 | 168 | Male | 686 | 851 |
| Caucasian | 828 | 1048 | Female | 317 | 365 |
| Arrive non-Hospital | 639 | 715 | Head CT Findings | 593 | 682 |
| Arrive From Hospital | 364 | 501 | Penetrating Injury | 41 | 84 |
Table 2.
Mean and Standard Deviation of Continuous Featrues from Primary and External Datasets
| Feature | Mean Primary | Std Primary | Mean External | Std External |
|---|---|---|---|---|
| Arrival Condition | 1.26 | 1.45 | 1.46 | 1.11 |
| Age | 40.29 | 19.34 | 42.48 | 19.98 |
| Injury Severity Score | 22.92 | 11.26 | 26.90 | 11.61 |
| Blood Pressure | 132.4 | 27.98 | 132.40 | 29.36 |
| Respiration Rate | 12.46 | 10.16 | 12.90 | 9.80 |
| Pulse | 95.36 | 22.54 | 93.41 | 22.46 |
| Temperature | 99.82 | 5.65 | 97.20 | 6.12 |
| GCS Motor | 3.96 | 2.38 | 3.36 | 2.32 |
| GCS Verbal | 3.19 | 1.89 | 4.20 | 1.85 |
| GCS Eye | 2.74 | 1.45 | 2.85 | 1.42 |
| Discharge Disposition | 3.68 | 1.57 | 3.69 | 1.58 |
| Length of Stay | 7.33 | 10.00 | 6.65 | 8.86 |
| Rancho Score | 5.95 | 1.53 | 6.33 | 1.42 |
2.1 Multi-Atlas Segmentation
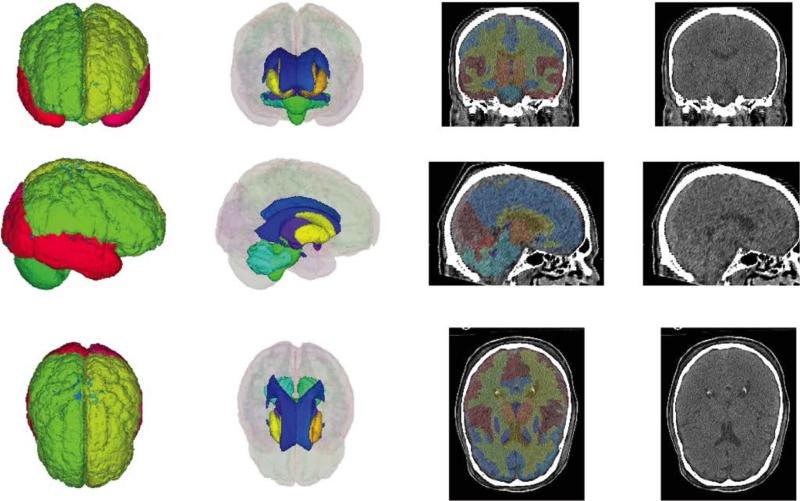
Labeled atlas images are required for multi-atlas segmentation, but CT atlases are not as common as MRI atlases because of the decrease in contrast between MRI and CT. To generate CT atlases, 20 subjects with paired MRI and CT scans were acquired and multi-atlas segmentation was performed on the MRIs using the BrainCOLOR protocol and 35 atlases. The CT scans were then co-registered to the MRI and the labels were then transferred to the CT. Since the CT has less contrast, many regions of interest were not visible from the original 133 labels, so the labels were merged to a consensus 22 labels. The 20 labeled CT images were co-registered to the target volume and locally weighted vote was used to segment the images. Empirical results of the segmentation can be seen in Figure 2.
Figure 2.
Empirical results of multi atlas segmentation. 3D renderings of the cortical labels and the deep brain structures are shown in the coronal, sagittal, and axial planes. Labels are also shown overlaid onto mid- coronal, sagittal, and axial slices.
2.2 Feature Calculation
Three types of features were calculated about the images, representing the types of information generally incorporated in the Marshall Criterion. All calculations are with the segmented ROIs, and, thus represent localized changes within the brain. The first set of features is comprised of intensity characteristics, which correspond to a local change in the density of brain matter or pathologic intracranial abnormalities. The mean and standard deviation of each ROI is calculated. The second set of features is spatial features, which correspond to global shifts in spatial information such as a midline shifts or cerebral edema. A mean segmentation was generated by calculating the spatial features by majority voting the subjects’ segmented images. The number of voxels overlapping each ROI in the mean segmentation and the subject's segmentation were computed to assess global changes in structures. The final set of features was texture features. Haralick texture features were calculated within each ROI at distances of 1, 2, 4, and 8 mm to correspond to different levels of texture [12].
2.3 Predictive Analysis
Outcome, discharge disposition and length of stay, were modeled as continuous values. A general linear model of the form
| (3) |
where represents a continuous valued outcome, β represents a matrix of weights, X represents the feature vectors for each subject, and ε is the error. Since length of stay cannot be negative, the regression is formulated as
| (4) |
and since discharge disposition is limited from 1-5, the regression is formulated as
| (5) |
and lastly since Rancho Score is limited to 1-8, the regression is formulated as
| (6) |
Each clinical variable was used to build a univariate least squares regression model to predict the three outcomes. All regressions were run with 10-fold cross validation and features with a median p-value greater than 0.05 were considered significant and maintained in the final model.
Since the quantity of imaging features calculated exceeded the number of subjects in the study, a model build on all of the features would be over-determined. To assess which features hold predictive value in this context, each imaging feature was used with the significant clinical features in 10-fold cross validation to assess if the image feature had any significance. Features were then sorted by their increase in explained variance for each outcome and iteratively added to the final model until the percent variance explained in a 10-fold cross validation experiment with a subset of subjects left out from the feature selection process.
2.4 Cross-Validation
To properly cross-validate the model, the process of feature selection and model building was run in 10-fold cross validation. At each pass, 10% of the data was held out from the total model building process as a validation set and during the feature selection process an additional 10% of the data was held out to evaluate the added features. The additional held-out set was never used in the training of the model which evaluated it.
In addition to the primary cross-validations, a secondary cross-validation was run on a subset of 1216 subjects that were acquired after the initial models were built. A set of regressors were built for predicting each of the three previously described outcomes.
3. RESULTS
In the analysis using only clinical and demographic features, 11 features were identified as significant for predicting discharge disposition and 14 features were identified as significant for predicting length of stay. The composite Glascow Coma Scale was removed from final models since it is a linear combination of the other features and all three features were found to be significant in each model[2]. The baseline model using all of the significant features accounted for 41.30% of the variance in predicting discharge disposition, 12.40% of the variance in predicting length of stay and 16.4% of the variance in predicting Rancho Score (Table 3). In the first cross-validation experiment, he final models for predicting length of stay accounted for 38.4% of the variance in outcomes, corresponding to an increase of 214.7% compared to the clinical variables, the final models for discharge disposition accounted for 51.1% of the variance corresponding to an increase of 26.2% compared to the clinical variables, and the final models for Rancho Score accounted for 30.7% of the variance corresponding to an increase of 86.6% compared to the clinical variables.
Table 3.
Cross-validated predictive R2 for each outcome and model
| Feature Set | Discharge Disposition | Length of Stay | Rancho Score | |||
|---|---|---|---|---|---|---|
| R2 | % Increase | R2 | % Increase | R2 | % Increase | |
| Clinical | 0.413 | - | 0.124 | - | 0.164 | - |
| Clinical + Imaging (Primary Cross-Validation) | .511 | 26.2% | 0.384 | 214.7% | 0.307 | 86.6% |
| Clinical + Imaging (Secondary Cross-Validation) | .502 | 21.5% | .401 | 223.4% | .216 | 31.7% |
In total 33,902 imaging features were evaluated for univariate significance for predicting length of stay and discharge disposition. In the second cross-validation model, a total of 952 features were significant for predicting length of stay, 2,682 for predicting discharge disposition, and 1,498 for predicting Rancho Score. Of the 952 features for length of stay 7 were intensity features, 584 were spatial features, and 361 were texture features. Of the 2,682 features significant for discharge disposition, 9 were intensity features, 437 were spatial features, and 2,236 were texture features. Of the 1,498 features for Rancho, 6 were intensity, 582 were spatial, and 910 were texture. The secondary cross-validation explained 50.2% of the variance in discharge disposition, 40.1% of the variance in length of stay, and 21.6% of the variance in Rancho Score. These results are similar to the results of the initial cross-validation in the discharge disposition and length of stay, but are slightly lower than the results seen in Rancho Score.
4. DISCUSSION
Predicting short-term outcomes of traumatic brain injuries based on CT image interpretation represents a significant challenge due to limitations in available imaging data and uncertainty / course measures of outcomes. Here, we present an approach for predicting patient length of stay and disposition upon discharge for patients suffering from TBIs. Our model incorporates baseline clinical information and features derived from brain CT scans acquired upon the subject's admission to the hospital. Features incorporate both attributes similar to radiologist indicators of brain injury and features indicative of s changes within the brain tissue. Regions of interest were established through multi-atlas segmentation to localize structures within the brain. Regression models were built initially with the clinical features acquired upon patient admission and imaging features were iteratively added based on the amount of variance accounted for in 10-fold cross validation experiments.
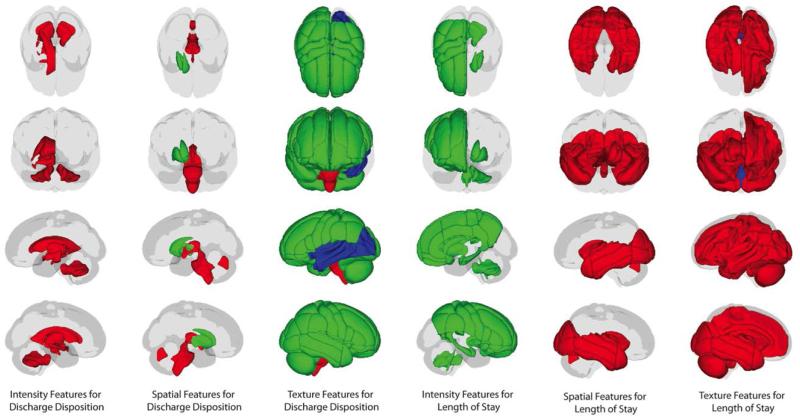
Features showed a high level of localization within known regions of interest within the brain (Figure 3&4). This localization shows that the particular region of an injury or change significantly corresponds to a change in likelihood of the discharge disposition and length of stay. The imaging features provided a larger increase in percent variance accounted for length of stay than discharge disposition. This may account for patients with mild to medium findings in patients who stay for a long period of time in the hospital but do not die soon after admission.
Figure 3.
Spatial Locations of features significantly predicting outcome variables in a 10-fold cross validation experiment containing significant demographic features and univariate image derived features. Red regions contain features showing a positive correlation with the outcome variable, green regions contain features showing a negative correlation with the outcome, and blue regions contain features, which predict both a negative and positive outcome.
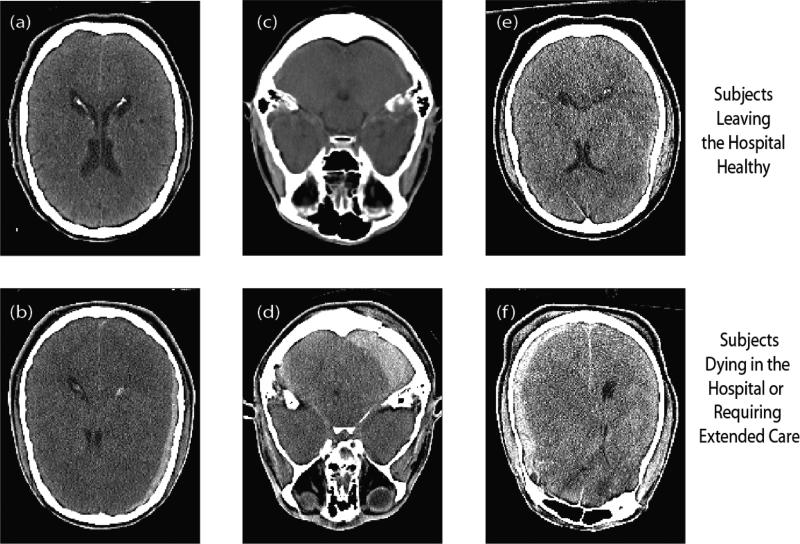
Figure 4.
Example images illustrating changes in features due to identifiable traumas. (a) and (b) are examples of different texture feature measurements in the lateral ventricles, due to the mid-line shift in (b). (c) and (d) differed substantively in the mean intensity of the cerebellum, due to a large bleed in (d). (e) and (f) had very different entropy in the left cortical labels, due to a severe bleed in (f).s
In a preliminary study, a medical analyst under supervision of a neuroradiologist manually calculated the Marshall Score for a subset of 100 subjects from the cohort. The Marshall Score was then added to the clinical features to assess the effects of Marshall Score compared to the image features. In a 10-fold cross validation experiment, the Marshall Score accounted for 2.1% of the variance with the clinical features in predicting length of stay and no variance in predicting discharge disposition. Adding the Marshall Score with the imaging features did not account for any additional information, but did not reduce the variance accounted for within the predictive models incorporating clinical and imaging features.
Further research into multi-atlas segmentation based approaches is necessary to improve the applicability of the techniques for clinical relevance. There are several avenues for improving the results of this study. First, CT atlases can be acquired to improve the localization to structures detectable within a CT. Second, non-linear regression techniques should be considered since there is no guarantee that the outcomes are linearly correlated with the features and the feature space is high-dimensional. Third, pure machine learning frameworks should be considered to incorporate features directly learned from the scans instead of ones extracted through previously defined heuristics and techniques.
Acknowledgments
This work was supported in part by the Robert J. Kleberg, Jr. and Helen c. Kleberg Foundation. This work was conducted in part using the resources of the Advanced Computing Center for Research and Education at Vanderbilt University, Nashville, TN. The project described was supported by the National Center for Research Resources, Grant UL1 RR024975-01, and is now at the National Center for Advancing Translation Sciences, Grant 2 UL1 TR000445-06. The content is solely the responsibility of the authors and does not necessarily represent the official views of the NIH,
REFERENCES
- 1.Saatman KE, Duhaime AC, Bullock R, et al. Classification of traumatic brain injury for targeted therapies. J Neurotrauma. 2008;25(7):719–38. doi: 10.1089/neu.2008.0586. [DOI] [PMC free article] [PubMed] [Google Scholar]
- 2.Corrigan JD, Kreider S, Cuthbert J, et al. Components of Traumatic Brain Injury Severity Indices. J Neurotrauma. 2014 doi: 10.1089/neu.2013.3145. [DOI] [PMC free article] [PubMed] [Google Scholar]
- 3.Bigler ED, Maxwell WL. Neuropathology of mild traumatic brain injury: relationship to neuroimaging findings. Brain Imaging Behav. 2012;6(2):108–36. doi: 10.1007/s11682-011-9145-0. [DOI] [PubMed] [Google Scholar]
- 4.Yuh EL, Cooper SR, Ferguson AR, et al. Quantitative CT improves outcome prediction in acute traumatic brain injury. J Neurotrauma. 2012;29(5):735–46. doi: 10.1089/neu.2011.2008. [DOI] [PMC free article] [PubMed] [Google Scholar]
- 5.Maas AI, Murray GD, Roozenbeek B, et al. Advancing care for traumatic brain injury: findings from the IMPACT studies and perspectives on future research. Lancet neurology. 2013;12(12):1200–10. doi: 10.1016/S1474-4422(13)70234-5. [DOI] [PMC free article] [PubMed] [Google Scholar]
- 6.Perel P, Arango M, Clayton T, et al. Predicting outcome after traumatic brain injury: practical prognostic models based on large cohort of international patients. BMJ. 2008;336(7641):425–9. doi: 10.1136/bmj.39461.643438.25. [DOI] [PMC free article] [PubMed] [Google Scholar]
- 7.Asman AJ, Landman BA. Formulating spatially varying performance in the statistical fusion framework. IEEE Trans Med Imaging. 2012;31(6):1326–36. doi: 10.1109/TMI.2012.2190992. [DOI] [PMC free article] [PubMed] [Google Scholar]
- 8.Asman AJ, Landman BA. Non-local statistical label fusion for multi-atlas segmentation. Med Image Anal. 2013;17(2):194–208. doi: 10.1016/j.media.2012.10.002. [DOI] [PMC free article] [PubMed] [Google Scholar]
- 9.Aljabar P, Heckemann RA, Hammers A, et al. Multi-atlas based segmentation of brain images: atlas selection and its effect on accuracy. Neuroimage. 2009;46(3):726–38. doi: 10.1016/j.neuroimage.2009.02.018. [DOI] [PubMed] [Google Scholar]
- 10.Carmichael OT, Aizenstein HA, Davis SW, et al. Atlas-based hippocampus segmentation in Alzheimer's disease and mild cognitive impairment. Neuroimage. 2005;27(4):979–90. doi: 10.1016/j.neuroimage.2005.05.005. [DOI] [PMC free article] [PubMed] [Google Scholar]
- 11.Gouvier WD, Blanton PD, LaPorte KK, et al. Reliability and validity of the Disability Rating Scale and the Levels of Cognitive Functioning Scale in monitoring recovery from severe head injury. Arch Phys Med Rehabil. 1987;68(2):94–7. [PubMed] [Google Scholar]
- 12.Haralick R. Textural features for image classification. IEEE Transactions on Systems, Man and Cybernetics. 1973 [Google Scholar]


