

Abstract
Previous models of O2 transport and utilization in health considered diffusive exchange of O2 in lung and muscle, but, reasonably, neglected functional heterogeneities in these tissues. However, in disease, disregarding such heterogeneities would not be justified. Here, pulmonary ventilation–perfusion and skeletal muscle metabolism–perfusion mismatching were added to a prior model of only diffusive exchange. Previously ignored O2 exchange in non-exercising tissues was also included. We simulated maximal exercise in (a) healthy subjects at sea level and altitude, and (b) COPD patients at sea level, to assess the separate and combined effects of pulmonary and peripheral functional heterogeneities on overall muscle O2 uptake ( and on mitochondrial
  (
( ). In healthy subjects at maximal exercise, the combined effects of pulmonary and peripheral heterogeneities reduced arterial
  (
( ) at sea level by 32 mmHg, but muscle
  by only 122 ml min−1 (–3.5%). At the altitude of Mt Everest, lung and tissue heterogeneity together reduced
  by less than 1 mmHg and
  by 32 ml min−1 (–2.4%). Skeletal muscle heterogeneity led to a wide range of potential
  among muscle regions, a range that becomes narrower as
 increases, and in regions with a low ratio of metabolic capacity to blood flow,
  can exceed that of mixed muscle venous blood. For patients with severe COPD, peak
  was insensitive to substantial changes in the mitochondrial characteristics for O2 consumption or the extent of muscle heterogeneity. This integrative computational model of O2 transport and utilization offers the potential for estimating profiles of
  both in health and in diseases such as COPD if the extent for both lung ventilation–perfusion and tissue metabolism–perfusion heterogeneity is known.
Key points
We expanded a prior model of whole-body O2 transport and utilization based on diffusive O2 exchange in the lungs and tissues to additionally allow for both lung ventilation–perfusion and tissue metabolism–perfusion heterogeneities, in order to estimate
 and mitochondrial
  (
( ) during maximal exercise.
Simulations were performed using data from (a) healthy fit subjects exercising at sea level and at altitudes up to the equivalent of Mount Everest and (b) patients with mild and severe chronic obstructive pulmonary disease (COPD) exercising at sea level.
Heterogeneity in skeletal muscle may affect maximal O2 availability more than heterogeneity in lung, especially if mitochondrial metabolic capacity (
 ) is only slightly higher than the potential to deliver O2, but when
  is substantially higher than O2 delivery, the effect of muscle heterogeneity is comparable to that of lung heterogeneity.
Skeletal muscle heterogeneity may result in a wide range of potential mitochondrial PO2 values, a range that becomes narrower as
 increases; in regions with a low ratio of metabolic capacity to blood flow,
  can exceed that of mixed muscle venous blood.
The combined effects of lung and peripheral heterogeneities on the resistance to O2 flow in health decreases with altitude.
Introduction
Current modelling of the O2 pathway (Wagner, 1993, 1996; Cano et al. 2013) is based on the concept that it is the functional integration amongst all individual components of the oxygen transport and utilization system (i.e. lungs and chest wall, heart, blood and circulation, and tissue mitochondria) which determines maximal overall O2 uptake ( . In these models, important simplifying assumptions were made. In particular, O2 exchange within the lungs was simplified by ignoring ventilation–perfusion (
 inequality, and exchange focused only on alveolar–capillary diffusion. This was felt to be reasonable as the minimal
  inequality found in health (Wagner et al. 1974) is normally of minor importance to O2 exchange, while allowing for such inequality greatly increased model complexity. However, this would be an unacceptable simplification in cardiopulmonary diseases where
  inequality can be substantial. Similarly, within the muscles, potential heterogeneity of local metabolic capacity and demand (
 ) in relation to blood flow distribution (
 was not considered, and while diffusive movement of O2 from the muscle microcirculation to the mitochondria was modelled, the muscles were considered to be functionally homogeneous, i.e. with blood flow perfectly matched to O2 demand throughout. Much less information exists about normal
  heterogeneity in muscle (Richardson et al. 2001), but using near infrared spectroscopy (NIRS), preliminary data in normal subjects (Vogiatzis et al. 2015) suggest that
  matching is much tighter than is
  matching. Thus,
  dispersion in muscle appears to be only about ¼ of
  dispersion in normal lung (Wagner et al. 1987a,b1987b).
Another simplifying assumption was that all of the cardiac output flowed to the exercising muscles, which is clearly untrue. This is not of great quantitative importance to muscle O2 transport in health because of the ability to increase cardiac output to over 20 l min−1, rendering the fraction of cardiac output perfusing non-exercising tissue small. However, such an assumption would pose a substantial limitation if the models were applied to patients with chronic cardiorespiratory disease where peak exercise may elicit less than a doubling of the resting cardiac output and resting  .
.
The purpose of the study reported in the current paper was therefore to first expand the prior O2 transport pathway model (Wagner, 1993, 1996; Cano et al. 2013) by allowing for (a)  heterogeneity in the lung, (b)
  heterogeneity in the muscle, and (c) perfusion and metabolism in non-exercising tissues, and then to analyse the impact of possible heterogeneity in lungs and in peripheral exercising tissues, separately and combined, on overall O2 transport and utilization at maximum exercise, both in health and in disease. In health, we simulated exercise not just at sea level but at altitudes up to the summit of Mt Everest using as input data variables obtained in Operation Everest II (Sutton et al. 1988). In disease, we chose COPD as the example of pulmonary gas exchange heterogeneity because of availability of O2 transport data (Blanco et al. 2010), and because of general interest in muscle function in this disease.
We then posed four questions: (a) in health, what are the potential effects of lung and muscle heterogeneity (each modelled over a wide range) on oxygen flux and partial pressures at all steps in the O2 pathway at sea level; (b) what is the impact of typical normal levels of heterogeneity on these variables when O2 availability is reduced by exposure to high altitude; (c) how substantial variations of the three least well established determinants of O2 flux and partial pressures in the transport–utilization pathway ( and P50 of the mitochondrial respiration curve and the extent of muscle heterogeneity) would affect both
  and mitochondrial
  estimates; and (d) what is the effect of (measured) lung and possible muscle heterogeneity on overall oxygen uptake and mitochondrial
  in mild and severe COPD, where O2 transport is less than normal.
Methods
The prior O2 transport and utilization model
In the absence of heterogeneity in lungs or tissues, and ignoring metabolism and blood flow to non-exercising tissues, the system describing maximal O2 transport and utilization (Wagner, 1993, 1996; Cano et al. 2013) was composed of five mass conservation equations as shown in Fig.1, which is reproduced from Cano et al. (2013) for the convenience of the reader. These equations represent: (1) O2 transport by ventilation from the atmosphere to alveolar gas (eqn (1) in Fig.1); (2) O2 diffusion from the alveolar gas to the lung capillaries (eqn (2) in Fig.1); (3) O2 transport through the systemic circulation (eqn (3) in Fig.1); (4) O2 diffusion from systemic capillary blood to the muscle mitochondria (eqn (4) in Fig.1); and (5) mitochondrial O2 utilization (eqn (5) in Fig.1).
Figure 1. Schematic representation of the oxygen transport and utilization system.
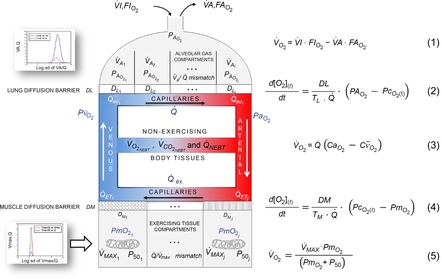
The schematic representation is shown with the five associated mass conservation equations governing O2 transport (eqns (1)–(4)) and utilization (eqn (5)). Reproduced from Cano et al. (2013) with permission.
The inputs to these equations are, at maximal exercise: inspired O2 fraction ( ), ventilation (
 , inspired;
  , expired), lung diffusing capacity (DL), cardiac output (
 ), acid–base status, haemoglobin concentration ([Hb]), tissue (muscle) diffusing capacity (DM) and the characteristics of mitochondrial respiration (modelled as a hyperbolic curve with its two parameters,
  and P50, as defined below and illustrated in Fig.2). The five outputs, or unknowns, in these equations are the maximal rate of O2 uptake (
 ) and alveolar, systemic arterial, venous and mitochondrial
  values.
Figure 2. Graphical depiction of the hyperbolic equation for oxidative phosphorylation.
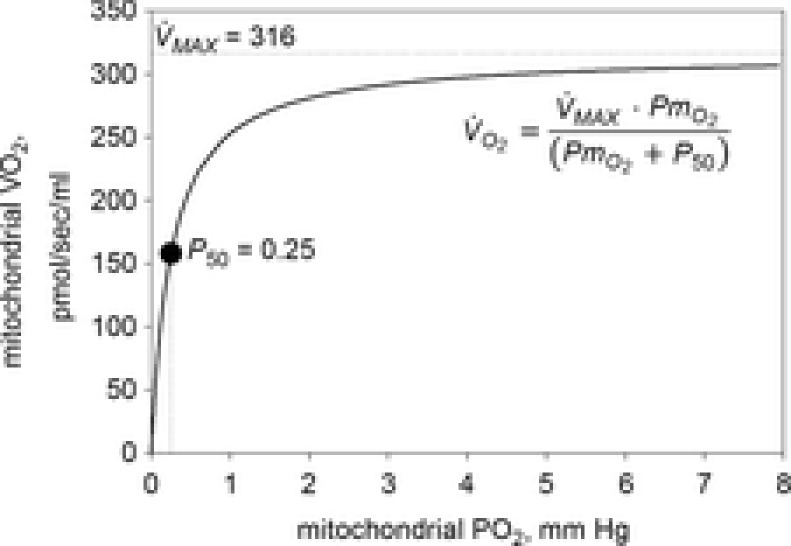
The graphical depiction of the equation for oxidative phosphorylation (eqn (1) in Fig.1) is fitted to data of Scandurra & Gnaiger (2010; p. 16, Fig 3B).
While the focus is clearly on O2 transport, CO2 cannot be ignored in such a model because of the effects of CO2 retention, for example on the O2Hb dissociation curve and on alveolar  . Thus, the same processes and equations are used for CO2, (West, 1971), treating CO2 at every step side by side with O2 using the published CO2 dissociation curves and acid–base relationships based on Kelman's subroutines (Kelman, 1966) such that O2–CO2 interactions are accounted for both in the lungs and muscle. Furthermore, the effect of alveolar ventilation on arterial
  is also innately included as one of the input variables needed is total ventilation. An exception is made for mitochondrial respiration, where, because the mitochondrial respiration curve for O2 consumption does not apply to CO2, CO2 production is related to
  through a stipulated value of the respiratory quotient, and the solutions for both gases sought simultaneously.
Modelling lung ventilation–perfusion inequality
To expand the model and allow for ventilation–perfusion ( inequality, ventilation and perfusion within the lung were distributed amongst a set of virtual lung compartments, each defined by its own ratio of ventilation (
 to blood flow (
 , with the compartments conne-cted in parallel. This is exactly the same approach as first advanced by West in 1969 (West, 1969). Then, the computation for diffusive alveolar–capillary exchange, previously applied to just a single lung compartment representing the homogeneous lung, is now applied to all compartments in turn. The entering mixed venous blood is the same for all compartments, and the task is to compute the
  and
and  values expected at the end of the capillary in each compartment of different
  ratio. This is done with a forward numerical integration procedure (Wagner et al. 1974), also used in Cano et al. (2013), and the outcome for each compartment depends on the compartmental
  and
and  ratios, the inspired gas and mixed venous blood O2 and CO2 composition, and the shape and position of the respective binding curves in blood. This approach is in fact the same as developed by Hammond & Hempleman (1987), and which is also contained within the multiple inert gas elimination technique (Wagner, 2008). Once all compartments have been subjected to this numerical integration, O2 and CO2 concentrations in their effluent blood are averaged in a perfusion-weighted manner to compute the O2 and CO2 profile of the systemic arterial blood that will reach both the exercising muscles and non-exercising tissues and organs.
In the present application, two means of data entry are possible for specifying the features of the  distribution, allowing flexibility. Individual compart-mental values for ventilation and blood flow can be used, or the compartments can be calculated based on a
  distribution containing one or more modes, using for each mode its first three moments (mean, dispersion and skewness) as originally programmed by West (1969). Both types of inputs end up providing a multi-compartmental
  distribution (indicated in Fig.1). For simplicity, when computing the lung compartments based on a
  distribution, the lung diffusing capacity (DL) was always distributed in proportion to compartmental blood flow, so that compartmental
  remains constant throughout the lung. This decision does not eliminate the opportunity to introduce actual data on
  distribution when available.
In summary, to allow for  heterogeneity, the single homogeneous lung ‘compartment’ in the prior model has been replaced by a multi-compartment model built from the algorithms of West (1969) as modified by Hammond & Hempleman (1987) and which allows for both
  inequality and diffusive exchange. Just as in the prior model, necessary inputs remain the composition of inspired gas and mixed venous blood, and the output remains the composition of systemic arterial blood destined for the muscles and other tissues.
Modelling peripheral heterogeneity
Similarly to lung ventilation–perfusion mismatch, tissue heterogeneities are considered as (regional) variability in a functional ratio. However, instead of  being that ratio as in the lung, it is the ratio of mitochondrial metabolic capacity (
 ) to blood flow (
 ) that is considered in the muscles. Here,
  is the local mitochondrial maximal metabolic capacity to use O2, and is the very same parameter as
  in eqn (5), Fig.1. The ratio
  in essence expresses the balance between O2 supply (
 ) and O2 demand (
 ). In the prior model, the muscle was considered homogeneous in terms of
  ratios, but now the muscle is considered as a parallel collection of muscle ‘units’ each with its own ratio of
  . Exactly as with the lung, the
  distribution can be specified either as a set of individual compartmental values for
  , DM,
, DM,  and P50, or computed from the moments of a (multimodal)
  distribution. While it would be possible to assign every
  compartment a unique mitochondrial P50 (see eqn (5) in Fig.1), this has not been modelled to date, and P50 has been taken to be constant throughout any single muscle. Also as in the lung, diffusion is considered in every
  unit, with the diffusing capacity DM distributed in proportion to
  , just as for the lung. However, the algorithm can accommodate different values across compartments for both P50 and DM if desired. The same forward integration procedure is used as in the prior model (Cano et al. 2013), when it was applied to the entire muscle considered as one homogeneous unit to compute each muscle compartment's effluent venous O2 and CO2 levels for the given inflowing arterial blood composition, and the
  and
and  ratios of the unit. Again as in the lung, the effluent venous blood from all muscle units is combined, or mixed, in terms of both O2 and CO2 concentrations, and a resulting mixed muscle venous
  and
and  is then calculated. Finally, this blood is mixed with that from the non-exercising tissues (see below). This mixed venous blood returns to the lungs for re-oxygenation.
In summary, to allow for  heterogeneity, the single homogeneous muscle ‘compartment’ in the prior model has been replaced by a multi-compartment model which allows for both
  inequality and diffusion impairment. Similarly to the prior model, necessary additional inputs remain the composition of arterial blood, and the blood binding characteristics of O2 and CO2. The output remains the composition of mixed muscle venous blood destined for return to the lungs for re-oxygenation.
In this section, the expression of peripheral heterogeneity using the oxygen flow ( instead of blood flow (
 was considered, but since at any given arterial
  , the arterial blood entering any muscle region has the same oxygenation, the distribution of
  will not differ in dispersion from that of
  delivery. Moreover, O2 concentration is an outcome variable. Hence, we cannot in practice adopt O2 delivery as the denominator.
Modelling metabolism and blood flow to non-exercising tissues
Non-exercising tissue blood flow and metabolism are incorporated simply by assigning values for total non-exercising tissue  and
and  , and using the Fick principle to compute the tissue venous O2 concentration. Then, a mixing equation combines venous blood from this non-exercising tissue with that from the mixed muscle venous blood (see above) in proportion to the blood flow rates assigned to the non-exercising tissues and muscles respectively, to form what will be pulmonary arterial blood reaching the lungs for re-oxygenation.
Achieving a solution for the model
In the prior model it was explained (Cano et al. 2013) how the model was run and a solution achieved. The same process is used with the above-described expansions in the current paper. In brief, a starting estimate is made for the composition of mixed venous blood entering the lungs, and for that estimate, the lung component is executed over the many  compartments and the end-capillary O2 and CO2 concentrations averaged over all compartments (weighted by compartmental blood flow) to yield an estimate of systemic arterial
  and
and  . These are then used as input data for the muscle part of the system, and that component is run once for each
  compartment. The effluent compartmental venous O2 and CO2 levels are then averaged (again blood flow-weighted), and mixed with the blood draining the non-exercising tissues (see previous section). It is the
  and
and  of this mixed blood that is the new estimate at mixed venous
  and
and  for the next iteration (or cycle) of pulmonary gas exchange: To this point, all that has changed between the first and second cycles is the composition of mixed venous blood. After pulmonary gas exchange calculations using this new venous blood composition are complete, new values of arterial blood
  and
and  are calculated, and now muscle O2 exchange is recomputed, from which new values of mixed venous
  and
and  are calculated. This cycling back and forth between the lungs and the tissues is continued until the five
  estimates – one computed from each of the five equations in Fig.1 – are identical (to within ± 0.1 ml min−1). At this point, stability of all
  values (alveolar, arterial, muscle venous and mitochondrial) in the face of further cycling between the lungs and tissues is also achieved. When this is observed, the governing requirement for conservation of mass has been achieved, and this signals the end of the run.
Analysis and input data for simulations
As mentioned above, four questions were posed, and these are discussed below.
First, in health, we assessed the effects of a wide range of lung and tissue functional heterogeneities on oxygen tensions and utilization at all steps of the O2 pathway. This extensive exploration was carried out for conditions of maximal exercise breathing room air at sea level. To this end, input data defining O2 transport conductances (i.e. ventilation, cardiac output, lung and muscle diffusional conductances) from normal subjects exercising maximally at sea level in Operation Everest II (Sutton et al. 1988) were used just as for the previous models (Wagner, 1993, 1996). Lung heterogeneity was analysed from complete homogeneity ( , second moment of the blood flow (
 distribution on a logarithmic
  scale equals zero), to very high inhomogeneity (
 ) as might be seen in the critically ill. We also explored the effects of skeletal muscle heterogeneity on overall O2 uptake (
 using a similar wide range of
  (second moment of the muscle metabolism (
 distribution on a logarithmic
  scale equals zero) from 0 to 2. The effects of lung and skeletal muscle heterogeneity on oxygen transport and utilization are displayed in Figs3 and 4. In Fig.3, and the first section in Results, the impact of skeletal muscle heterogeneity on
  is assessed at two different levels of
  corresponding to 120% and 250%
  .
.
Figure 3. Effects of potential lung and muscle heterogeneities on maximal O2 transport and utilization.
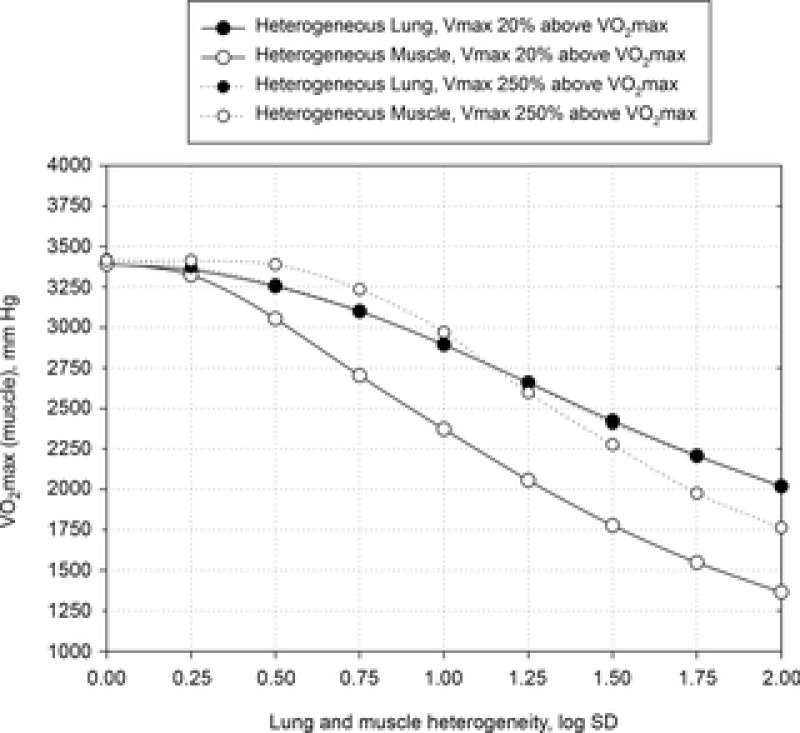
Independent effects of lung  heterogeneity (filled circles) and muscle
  heterogeneity (open circles) on maximal muscle oxygen uptake (
 ), using input data defining O2 transport conductances from normal subjects exercising maximally at sea level in Operation Everest II (Sutton et al. 1988). Results shown for
  20% higher than measured
 (continuous line) and
  2.5-fold higher than measured
  (dotted line). Healthy subjects show pulmonary
  between 0.3 and 0.6 (Wagner et al. 1974), whereas skeletal muscle heterogeneity (
 ) presents an average value of 0.10 (Vogiatzis et al. 2015). In patients with moderate to severe COPD,
  can present values close to 1.0, but no published data on
  are available. Finally, critically ill patients admitted in the Intensive Care Unit (ICU) may show lung heterogeneity values close to 2.0. Again, no information on
  is available.
Figure 4. Combined and separate effects of lung and muscle heterogeneities on the O2 transport and utilization system.
Combined and separated effects of varying degrees of lung ventilation–perfusion heterogeneity (SDQ) and varying degrees of exercising muscle mitochondrial metabolic capacity–blood flow heterogeneities ( ) on the O2 transport pathway:
  on arterial blood (upper left panel), venous blood (upper right panel) and mitochondria (two central panels), maximal muscle oxygen uptake (lower left panel), and, maximum degree of oxygen unbalance between mitochondrial (
 ) of muscle compartments and mean effluent venous (
 ) oxygen levels (lower-right panel). See text for details.
The rationale behind a value for  of 4.6 l min−1, which is 20% higher than the measured
  (3.8 l min−1) at sea level in Operation Everest II (Sutton et al. 1988), is that it is a conservative estimate. This is so, because it is known that measured
  is less than mitochondrial capacity to use O2 (i.e.
  in healthy fit subjects and exercise capacity is known to be increased within this range when breathing 100% O2 (Welch, 1982; Knight et al. 1992).
However, we acknowledge that reports on subjects exercising a limited amount of muscle mass, (i.e. knee extensor of one limb); Andersen & Saltin, 1985) indicate the potential for markedly higher  values up to 250% of
  (which would scale to 9.5 l min−1 for
  measured in subjects from Operation Everest II). In the study by Andersen & Saltin, a rate of 350 ml kg−1 was measured, which extrapolated to a conservative estimate of 27 kg of exercising muscle mass corresponds to a
  value of 9.5 l min−1. Consequently, these two
  values (4.6 and 9.5 l min−1) were used for the simulations displayed in Fig.3.
For the mitochondrialP50, we used a value of 0.3 mmHg, similar to what has been found experimentally in vitro (Wilson et al. 1977; Gnaiger et al. 1998; Scandurra & Gnaiger, 2010).
For non-exercising body tissues we used typical resting total values of  (300 ml min−1),
  (240 ml min−1) and blood flow (20% of total blood flow at peak exercise).
The second question examined the effects of heterogeneity in healthy lungs and muscle on O2 transport and utilization at altitude. For the lung we used  as a value commonly seen during exercise (Wagner et al. 1987a,b1987b). This value is near the upper end of the normal range, which is 0.3–0.6 (Wagner et al. 1987a,b1987b). In muscle, we used preliminary unpublished estimates of
  . Again for P50, we used a value of 0.3 mmHg and for
  we used a conservative value 20% higher than the measured
 . The input data defining the O2 transport conductances again came from normal subjects exercising maximally at sea level and altitude in Operation Everest II (Sutton et al. 1988) as used above and again typical resting total values of
  (300 ml min−1),
  (240 ml min−1) and blood flow (20% of total blood flow at peak exercise) were considered for non-exercising body tissues. However, to study the consequences at more altitudes than were examined in Operation Everest II (which were sea level, 4600 m, 6100 m, 7600 m and 8848 m), O2 transport conductance parameters were linearly interpolated (Table1) at 305 m (1000 ft) elevation increments from the data obtained at each of the five altitudes studied in Operation Everest II (Sutton et al. 1988).
Table 1.
Input parameters for the modelling of the oxygen transport system in health at sea level and altitude
| Altitude (ft) | Barometric pressure (PB; mmHg) | Body temperature (T; °C) | Haemoglobin concentration ([Hb]; g dl–1) | Alveolar ventilation ( (BTPS); l min–1) (BTPS); l min–1) |
Blood flow ( ; l min–1) ; l min–1) |
Total lung O2 diffusing capacity (DL; ml min–1 mmHg–1) | Total muscle O2 diffusing capacity (DM; ml min–1 mmHg–1) |
|---|---|---|---|---|---|---|---|
| 0 | 760 | 38 | 14.2 | 128.3 | 25.0 | 50.9 | 104.6 |
| 5000 | 639 | 38 | 14.9 | 137.1 | 23.5 | 60.9 | 97.1 |
| 10,000 | 534 | 38 | 15.5 | 145.9 | 22.0 | 70.9 | 89.6 |
| 15,000 | 442 | 38 | 16.2 | 154.6 | 20.5 | 80.9 | 82.1 |
| 16,000 | 426 | 37.9 | 16.3 | 156.4 | 20.2 | 82.9 | 80.6 |
| 17,000 | 410 | 37.8 | 16.5 | 158.1 | 19.9 | 84.9 | 79.1 |
| 18,000 | 394 | 37.7 | 16.6 | 159.9 | 19.6 | 86.9 | 77.6 |
| 19,000 | 380 | 37.6 | 16.7 | 161.6 | 19.3 | 88.9 | 76.1 |
| 20,000 | 365 | 37.5 | 16.9 | 163.4 | 19.0 | 90.9 | 74.6 |
| 21,000 | 351 | 37.4 | 17.0 | 165.2 | 18.7 | 92.9 | 73.1 |
| 22,000 | 337 | 37.3 | 17.1 | 166.9 | 18.4 | 94.9 | 71.6 |
| 23,000 | 324 | 37.2 | 17.2 | 168.7 | 18.1 | 96.9 | 70.1 |
| 24,000 | 311 | 37.1 | 17.4 | 170.4 | 17.8 | 98.9 | 68.6 |
| 25,000 | 299 | 37 | 17.5 | 172.2 | 17.5 | 100.9 | 67.1 |
| 26,000 | 286 | 37 | 17.6 | 173.9 | 17.2 | 102.9 | 65.6 |
| 27,000 | 275 | 37 | 17.8 | 175.7 | 16.9 | 104.9 | 64.1 |
| 28,000 | 264 | 37 | 17.9 | 177.4 | 16.6 | 106.9 | 62.6 |
| 29,000 | 253 | 37 | 18.0 | 179.2 | 16.3 | 108.9 | 61.1 |
| 30,000 | 243 | 37 | 18.2 | 181.0 | 16.0 | 110.9 | 59.6 |
For the third and forth questions we assessed how substantial variations of the three least well established determinants of O2 flux and partial pressures in the transport–utilization pathway ( and P50 of the mitochondrial respiration curve and
 ) would affect both
  and mitochondrial
  estimates, in health (third question) and in COPD (fourth question). Input data defining O2 transport conductances and lung heterogeneity (i.e.
 ) from normal subjects exercising maximally at sea level in Operation Everest II (Sutton et al. 1988) were used in health. In disease, measured O2 conductances and lung heterogeneity data came from two previously studied COPD patients (Blanco et al. 2010) exercising maximally (Table2), one with mild (FEV1 = 66% predicted post-bronchodilator) and one with severe (FEV1 = 23% predicted post-bronchodilator) COPD. However, even if reasonable, the values of
  and P50 assumed to answer the previous question are uncertain, let alone whether there is significant
  heterogeneity. Because of this, we carried out simulations over a wide range of possible values of these variables, as indicated in Fig.6. In the case of
  , we used a values of 4.2, 4.6 and 4.9 l min−1 (10, 20% and 30% higher than actual
  , respectively). Moreover, a
  value of 9.5 l min−1 (250%
  ) was also considered in health because of the rationale described above.
Table 2.
Input parameters for the modelling of the oxygen transport system in disease (moderate and severe COPD)
| Moderately limited | Severely limited | |
|---|---|---|
| Parameter | transport | transport |
| Forced expired volume in the 1st second (FEV1; % predicted post-bronchodilator) | 66 | 23 |
| Forced vital capacity (FVC; % predicted post-bronchodilator) | 84 | 33 |
| FEV1/FVC | 0.58 | 0.54 |
Log SD 
|
0.67 | 0.86 |
| Barometric pressure (PB; mmHg) | 758 | 765 |
Fractional inspired oxygen ( ) ) |
0.2093 | 0.2093 |
| Haemoglobin concentration ([Hb]; g dl–1) | 14.4 | 12.5 |
| O2 dissociation curve (P50; mmHg) | 26.8 | 26.8 |
| Body temperature (T; °C) | 37.0 | 36.8 |
| Weight (kg) | 60 | 36 |
| Body mass index (BMI; kg m–2) | 19.8 | 15.2 |
Resting ventilation ( (BTPS); l min–1) (BTPS); l min–1) |
7.11 | 7.44 |
Resting cardiac output ( ; l min–1) ; l min–1) |
3.68 | 3.20 |
Resting  (ml min–1) (ml min–1) |
235 | 159 |
Resting  (ml min–1) (ml min–1) |
174 | 103 |
Resting arterial  ( ( ; mmHg) ; mmHg) |
80 | 59 |
Resting arterial  ( ( ; mmHg) ; mmHg) |
35 | 46 |
| Resting lactate (mmol l–1) | 1.47 | 0.81 |
Exercise ventilation ( (BTPS); l min–1) (BTPS); l min–1) |
35.3 | 8.2 |
Exercise cardiac output ( ; l min–1) ; l min–1) |
7.87 | 3.98 |
Exercise ( ; ml·min–1) ; ml·min–1) |
914 | 355 |
Exercise arterial  ( ( ; mmHg) ; mmHg) |
90 | 59 |
Exercise arterial  ( ( ; mmHg) ; mmHg) |
31 | 49 |
| Exercise lung O2 diffusing capacity (DL; ml min–1 mmHg–1) | 100 | 11 |
| Exercise muscle O2 diffusing capacity (DM; ml min–1·mmHg–1) | 26 | 9 |
| Exercise lactate (mmol l–1) | 3.55 | 2.03 |
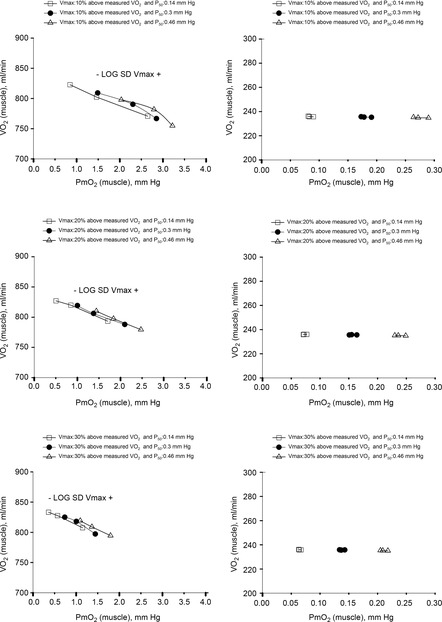
Figure 6. Sensitivity analysis of mitochondrial respiration and muscle heterogeneity estimates in health.
Effects of muscle bioenergetics (mitochondrial respiration  and P50 parameters) and muscle peripheral heterogeneities on muscle
  and mitochondrial
  (
( ) in health at sea level.
  is taken as 10% (upper left panel), 20% (upper right panel), 30% (lower left panel) and 250% (lower right panel) greater than measured
  . For each
  , three mitochondrial P50 values (0.14, 0.3 and 0.46 mmHg) and three degrees (0.1, 0.2 and 0.3) of muscle perfusion–metabolism inhomogeneity (
 ) were evaluated. See text for details.
For mitochondrial P50, we used values lower (0.14 mmHg) and higher (0.46 mmHg) than 0.3 mmHg, the value found experimentally in vitro (Wilson et al. 1977; Gnaiger et al. 1998; Scandurra & Gnaiger, 2010). Finally, to assess how sensitive the outcomes are to the degree of heterogeneity, we also carried out calculations with  values of 0.1 (healthy subject estimates), 0.2 and 0.3. With respect to non-exercising body tissues, we used typical resting total values of
  (300 ml min−1),
  (240 ml min−1) and blood flow (20% of total blood flow at peak exercise) for normal subjects.
For the two previously studied COPD patients (Blanco et al. 2010) exercising maximally we used measured resting values of whole body  (
( and
and  (Table2), along with a blood flow estimate (
 ) from the following formula, which expresses the concept that blood flow is proportional to metabolic rate:
  .
.
Results
Effects of potential lung and muscle heterogeneities on O2 transport and utilization in healthy subjects exercising maximally at sea level
Figure 3 shows the independent effects of lung  heterogeneity (filled circles) and muscle
  heterogeneity (open circles) on maximal muscle oxygen uptake (
 ), in normal subjects exercising maximally at sea level. In this figure, both
  and
and  heterogeneity has been varied over a wide range of log SD, from 0 to 2.0. Healthy subjects show pulmonary
  between 0.30 and 0.60 (Wagner et al. 1987a), whereas skeletal muscle heterogeneity (
 ) presents an average value of 0.10 (Vogiatzis et al. 2015). In patients with moderate to severe COPD,
  can present values close to 1.0, but no published data on
  are available. Finally, critically ill patients admitted in the Intensive Care Unit (ICU) may show lung heterogeneity values close to 2.0, but no information on
  is available. The main result from Fig.3 is that heterogeneity in muscle affects O2 availability more than does heterogeneity in the lungs if
  is only 20% higher than
  . However, using the higher
  (i.e. 9.5 l min−1), the effects of lung and muscle heterogeneity are similar. On the other hand, the impact of lung heterogeneity on
  is insensitive to the
  values used. In addition, because muscle heterogeneity appears to be much less than that in the lung, both in health and COPD, based on a combination of published and unpublished data as mentioned, actual muscle heterogeneity has less of an impact on O2 transport than observed lung heterogeneity.
The six panels in Fig.4 display the estimated (combined and separate) effects of lung and muscle heterogeneities on the O2 transport and utilization system. The upper-left panel indicates arterial  (
( over a range of exercising muscle
  mismatching (0 to 0.5), expressed as
  . For each
  value, the panel displays
  values for different levels of lung
  heterogeneity, from the homogeneous lung
  to a highly heterogeneous lung (
 . Each line represents the outcome at a given level of lung heterogeneity over a range of muscle heterogeneity. This panel shows that muscle heterogeneity has only a small effect on
  at all levels of lung functional heterogeneities. However, as is well known,
  inequality has a major impact on arterial oxygenation as shown. Likewise, the upper-right panel shows the effects of muscle heterogeneity on effluent muscle venous
  (
( . The impact is moderate, and is greater than the effect on
  . However, it is quantitatively important only at high levels of tissue heterogeneity, especially in combination with lungs containing little heterogeneity.
The two middle panels of Fig.4 show the relationships between mitochondrial  (
( among muscle regions (compartments) and skeletal muscle
  functional heterogeneity. The left hand panel shows the lowest compartmental values of
  (i.e. when
  is high) and the right hand panel shows the highest compartmental values of
  (i.e. when
  is low). Note that the ordinate scales are very different in these two panels. These panels show that heterogeneity of
  ratios markedly expands the range of
  levels among exercising skeletal muscle compartments. As in the top panels, each line in the two middle panels correspond to different levels of lung heterogeneity from a homogeneous lung (
 to a highly heterogeneous lung (
 .
.
The left middle panel shows that, as expected, the greater the peripheral heterogeneity, the lower the minimum  values. Moreover, we observe a moderate impact of lung heterogeneity on minimum
  , but such impact decreases as skeletal muscle heterogeneity increases. Likewise, the right middle panel shows that skeletal muscle compartments with lowest
  ratios may generate exceedingly high
  estimates that increase with tissue heterogeneity. Homogeneous lungs show the highest
  values for a given level of peripheral tissue functional heterogeneity.
The lower left panel indicates that muscle heterogeneities have small effects on total muscle  , especially compared with lung heterogeneities that show a significant impact on muscle
  . Finally, the lower right panel displays the maximum estimates for
  among muscle regions (as seen in the middle right panel of the same figure) plotted against the corresponding mean effluent muscle
  (from the top right panel). The individual lines indicate different levels of muscle heterogeneities, from a homogeneous tissue (
 at the bottom to heterogeneous muscle (
 at the top. In the panel, the dashed straight line corresponds to the identity line. The point of presenting this relationship is to show that when the dispersion of muscle
  is 0.2 or greater, some regions of muscle will have mitochondrial
  values that exceed
  of the effluent muscle venous blood.
The role of functional heterogeneities, lung and muscle, on O2 transport and utilization in healthy subjects at altitude
The four panels in Fig.5 display the effects of altitude on four key outcome variables at maximal exercise – arterial, muscle venous, and mitochondrial  and
and  itself. Two relationships are shown in each panel – that computed in the absence of either lung or muscle heterogeneity, and that computed allowing for reasonable normal estimates of heterogeneity in each location as listed above in the Methods section (
 heterogeneity in the lung quantified by a dispersion value (
 of 0.5,
  heterogeneity in muscle quantified using an estimate of dispersion (
 ) of 0.1, non-exercising body tissues using typical resting total values of
  (300 ml min−1),
  (240 ml min−1) and 20% of total blood flow at peak exercise, and a conservative
  value 20% higher than the measured
  ). Except for arterial
  at sea level and altitudes up to about 10,000 ft, the effects of typical levels of heterogeneity are seen to be small, and diminish progressively with increasing altitude.
Figure 5. Role of functional heterogeneities, lung and muscle, on the O2 transport and utilization system in healthy subjects at altitude.
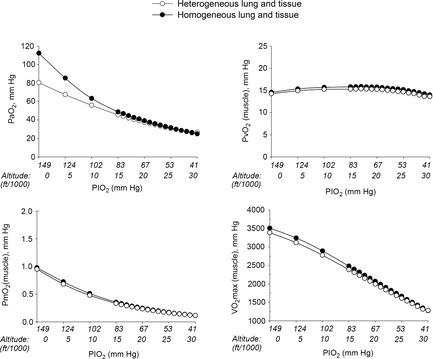
Effects of functional inhomogeneity on arterial  (upper left panel), venous
  (upper right panel), mitochondrial
  (lower left panel) and
  (lower right panel) at sea level and altitude. Functional inhomogeneity is expressed as the combined effects of lung ventilation–perfusion inequalities and skeletal muscle perfusion–metabolism mismatching. Mitochondrial respiration parameters were fixed to a conservative
  of 4584 ml min−1 and a P50 of 0.3 mmHg. Filled circles correspond to simulations outputs when considering both homogeneous lung and tissues. Open circles represent simulation outputs when using reasonable estimates for lung ventilation–perfusion (
 of 0.5), tissue perfusion–metabolism (
 of 0.1), and the metabolic rate of non-exercising tissues (with an assigned
  of 300 ml min−1 and a
  of 240 ml min−1) and assuming that 20% of total blood flow goes to non-exercising tissues. See text for details.
Sensitivity of outcomes to mitochondrial respiration and muscle heterogeneity estimates in health
Recall that the three least well established determinants of O2 flux and partial pressures in the transport–utilization pathway are the  and P50 of the mitochondrial respiration curve (that links
  to mitochondrial
  and the extent of muscle heterogeneity. Because of this, we carried out calculations of how variation in their assumed values would affect both
  and mitochondrial
  estimates. In this section, we now use (Fig.6) the four
  values stated in the Methods section that are 4.2, 4.6, 4.9 and 9.5 l min−1.
For mitochondrial P50 (assumed normal value 0.3 mmHg; Wilson et al. 1977; Gnaiger et al. 1998; Scandurra & Gnaiger, 2010), we also used values of 0.14 and 0.46 mmHg. With heterogeneity of  estimated at 0.1 (
 ), we also used values of 0.2 (moderate heterogeneity) and 0.3 (severe heterogeneity). This yielded 4 × 3 × 3 or 36 combinations of these variables. It should also be noted that the values chosen reflect substantial relative differences for each variable.
Figure 6 shows the results of this analysis in a format where predicted  is plotted against the corresponding predicted average muscle mitochondrial
  so that the effects can be seen for both of these outcome variables. The top panel shows results when
  + 10%; the middle panel for
  + 20% and the lower panel for
  + 30%. In each panel, open squares represent P50 = 0.14 mmHg, filled circles a P50 = 0.3 mmHg and open triangles a P50 = 0.46 mmHg. For any one such P50, the three connected points in each case reflect, from left to right,
  = 0.1 (normal), 0.2 (moderate), and 0.3 (severe heterogeneity).
In terms of predicted  , the consequences of these uncertainties are small. The highest
  in all three panels is 3415 ml min−1, and the lowest is 3192 ml min−1. However, in terms of mean mitochondrial
  , the effects are greater.
  is systematically higher for the lowest
  (range of
  : 0.8 to 3.7 mmHg, top panel) to lower panel (highest
  , range of
  : 0.3 to 1.9 mmHg).
In summary, the sensitivity analysis displayed in Fig.6 points out that at any  , increase in mitochondrial P50 results in systematically higher
  values with almost no effect on the relationship between
  and
and  . On the other hand, increasing
  raises average
  for any set of
  and P50 values. Moreover, the figure clearly indicates that the higher the
  , the narrower is the range of potential mitochondrial
  values for a given range of
  .
.
Simulated impact of lung and muscle heterogeneity on  and muscle
  in two patients with COPD of different severity: Question 4
As Table2 shows, lung heterogeneities had been measured in each patient using the multiple inert gas elimination technique (Blanco et al. 2010). The first patient displays features that would be regarded as reflecting moderate COPD, while the second patient represents end-stage COPD and extremely limited exercise capacity.
Figure 7 displays the impact of functional lung and muscle heterogeneities on the O2 pathway in the two COPD patients (moderate severity, left panels and end-stage severity, right panels). The format indicates the values of both predicted  and
and  over a range of values of the same three least certain variables (
 and P50 of the mitochondrial respiration curve and degree of muscle
  heterogeneity, none of which are known for these patients).
Figure 7. Sensitivity analysis of mitochondrial respiration and muscle heterogeneity estimates in COPD.
Effects of muscle bioenergetics (mitochondrial respiration  and P50 parameters) and muscle peripheral heterogeneities on muscle
  and mitochondrial
  (
( ) for given representatives of mild (left-side panels) and severe (right-side panels) limitation of O2 transport conditions in chronic obstructive pulmonary disease (COPD).
  is conservatively taken as 10% (upper panels), 20% (middle panels) and 30% (lower panels) greater than measured
  in the two COPD patients exercising maximally, selected as representatives of both mild and severe O2 transport conditions. For each
  , three mitochondrial P50 values (0.14, 0.3 and 0.46 mmHg) and three degrees (0.1, 0.2 and 0.3) of muscle perfusion–metabolism inhomogeneity (
 ) were evaluated. See text for details.
The less affected patient (left three panels) behaves in a fashion very similar to that shown in Fig.6 for normal subjects (other than for absolute values of peak  under all conditions). In particular, mitochondrial
  values are in the same range as for normal subjects. Variation in
  across muscle regions is considerable (not shown) with a SD of 10 mmHg.
For the severely affected patient (right three panels), peak  is insensitive to substantial changes in mitochondrial
  , P50 or the extent of heterogeneity. Only mitochondrial P50 changes will have some effect on mitochondrial
  , but it is important to note that the scale of mitochondrial
  is very different than normal, and is far lower under all conditions, with little variation throughout the muscle (SD of 1 mmHg).
Discussion
Summary of major findings
This study has generated the first integrated model of the O2 pathway that takes into account all the individual components of O2 transport and utilization considering both exercising and non-exercising tissues at  in health and in disease (i.e. COPD), thus allowing for heterogeneity in both lungs and muscle. A graphical user interface to parameterize and simulate the integrative model is freely available at http://sourceforge.net/projects/o2pathway/.
The research addresses the separate and combined contributions of functional heterogeneities at pulmonary and at skeletal muscle levels to each of the components of the O2 pathway. Emphasis is placed on estimating the impact of lung and skeletal muscle  ratio inequalities on overall muscle
  and on mitochondrial
  at maximal exercise. This was done simulating normal subjects at sea level and altitude, and patients with COPD.
The main result from now allowing for lung and muscle heterogeneities is that heterogeneity in muscle affects O2 availability more than does heterogeneity in the lungs if  is only slightly higher than
  . However, if
  is greatly in excess of the potential to deliver O2, as small muscle mass studies suggest (Andersen & Saltin, 1985), the effects of lung and muscle heterogeneity are similar. On the other hand, the impact of lung heterogeneity on
  is insensitive to the
  values used. In addition, because muscle heterogeneity appears to be less than that in the lung, muscle heterogeneity is predicted to have less of an impact on overall O2 transport and utilization than observed lung heterogeneity.
These findings stress the need for further measurements of skeletal muscle metabolism–perfusion heterogeneity in health and disease, and also of assessing parameters of the mitochondrial respiration curve ( and p50).
Implications of functional heterogeneities: lung and skeletal muscle
Whether arterial oxygenation falls as a result of altitude in normal subjects or as a result of heterogeneity in the lungs in patients with lung disease (at sea level), it is clear that O2 availability to the muscles must fall. This has been appreciated for many years, as has the consequence of such reduced O2 availability for maximal exercise capacity. The other potentially important consequence of reduced O2 availability is reduced mitochondrial  . This may have more than one effect on cellular function.
While heterogeneity in the lungs must cause mitochondrial  to fall throughout the muscle (all other factors unchanged), heterogeneity in the muscles will additionally cause mitochondrial
  to vary between muscle regions. In those areas with higher than average
  in relation to blood flow, mitochondrial
  is lower than average, but in regions where
  is low in relation to blood flow, mitochondrial
  must rise to levels greater than would be seen in the absence of heterogeneity. The consequences of subnormal mitochondrial
  are discussed below. There may be corresponding functional consequences of a high mitochondrial
  as well.
A high  may oppose vasodilatation and restrict local perfusion, thus increasing the
  back towards normal and offering an intrinsic mechanism to automatically limit mitochondrial
  heterogeneity. A high mitochondrial
  will also reduce the capillary-to-mitochondrial
  diffusion gradient, reducing diffusive O2 transport and again working towards restoring the balance between O2 supply and demand. Furthermore, the high
  may exert genomic effects that may be opposite to those expected when
  is below normal (see above). The potential therefore exists for regional regulation of gene expression (and thus for adaptive programs) according to local
  . Finally, when mitochondrial
  is elevated, the potential exists for increased ROS generation, just as when
  is below normal. If so, muscle regions with both very low and very high
  ratios may be at risk of oxidative stress.
Biological and clinical implications
The multilevel impact of disturbances of cellular oxygenation on cell function is well recognized (Semenza, 2011). Hypoxia- (or hyperoxia-) induced biological alterations may play a significant role on underlying mechanisms in different acute and chronic conditions (Resar et al. 2005). A major conclusion of the present study is that mitochondrial  will vary considerably among muscle regions of different
  ratio. When
  is low,
  is high, and vice versa. This potential variation in
  , which can occur during exercise in healthy individuals, but can also occur on submaximal exercise or even at rest in severe disease states, may have significant biological implications.
First, since a low  facilitates local vasodilatation in muscle (Rowell, 1986), those areas with high
  in relation to
  , thus having a low
  , may preferentially vasodilate, which means that
  may increase locally and that the
  ratio is thus, in part, normalized. In this way,
  heterogeneity may be to some extent self-limited. This corresponds to hypoxic pulmonary vasoconstriction in the lungs, where it has been known for many years that a region with a low
  ratio will vasoconstrict, limiting blood flow and tending to push the
  ratio back towards normal.
Second, the lower the mitochondrial  , the higher will be the
  difference between the muscle microvasculature and the mitochondria, other factors being equal. This facilitates the diffusion process, and provides an additional, automatic compensatory mechanism to work in the direction of restoring
  when blood flow is low. Whether these self-correcting effects are seen in disease remains to be determined.
Potential for estimating  in health and in disease
It may be possible to measure mitochondrial  (
( in the future (Mik, 2013) but this promising approach is not yet generally available. If this, or another, method can be developed into a feasible approach for intact humans, it offers the potential for estimating, at least approximately, the parameters of the in vivo mitochondrial O2 respiration curve. By varying inspired O2 concentration over as wide a range as safely possible, paired values of
  and
and  could be measured, and if they were to bracket both the O2-dependent and O2-independent regions of the mitochondrial respiration curve, there may be enough information to estimate
  and P50.
Limitations of the analysis
Firstly, as in previous work (Wagner, 1993, 1996; Cano et al. 2013), the entire analysis applies to steady-state conditions (meaning, that O2 partial pressures are constant in time, as is  itself). Therefore, the analyses should not be extrapolated to transient changes in metabolic rate at the beginning or end of exercise. Additional limitations are that for this modelling approach to apply with accuracy, parameters defining the in vivo mitochondrial respiration curve (
 and P50), and muscle diffusing capacity (DM), are required. Indeed, as already stated in Methods, section headed ‘Analysis and input data for simulations’, data from experimental human exercise studies do not exist for
  and P50. In addition, our vision was to explore heterogeneities between relatively large skeletal muscle regions (on a scale of cm3) that can be explored in humans by methods such as PET (Nuutila & Kalliokoski, 2000) or NIRS (Vogiatzis et al. 2015). At
  , tissue
  has wide spatial variations within the region surrounding each individual capillary, due both to axial gradients in intravascular oxygen levels and to radial gradients of tissue oxygen levels (Weibel, 1984; McGuire & Secomb, 2001). Consequently, large variations in mitochondrial
  (from values below 1 mmHg up to double-digit
  values (McGuire & Secomb, 2001)) exist within any region of a size that can be resolved with techniques that are feasible in humans. Hence,
  in Fig.1 (eqn (5)) can be regarded as an effective or average value over such a region of observation. More detailed consideration of the spatial structure of the microcirculation would be needed to overcome this limitation of the model (Duling & Damon, 1987; Delashaw & Duling, 1988).
In addition, while the degree of  heterogeneity in the lungs of individual subjects or patients has been measurable for many years, that in the muscle is not easily accessible. Thus, for the present paper, the estimates used are uncertain, and the quantitative outcomes should not be generalized – they are specific to the particular input variables we used. That is why we elected to run simulations over a range of the most uncertain variables. That said, given that the principal objective of our study was to present the development of an O2 transport model that encompasses heterogeneity in both lungs and muscle, it seems reasonable to illustrate its prediction capabilities, even if estimates of some input variables are uncertain (i.e. DM,
  , P50). With the algorithm now developed, running the simulations with accurate data when available will easily be possible. The quantitative results presented thus show the impact of heterogeneity only for the specific cases simulated.
Conclusions
The current research incorporates functional heterog-eneities in lung and muscle, as well as the O2 consumed by non-exercising tissues, into a previously established integrative O2 pathway mathematical model that had considered both the lungs and muscles as functionally homogeneous, and which also ignored O2 consumed by non-exercising tissues. These modifications allow application of the modelling approach to patients with impaired exercise capacity and cardio-pulmonary diseases such as COPD. Skeletal muscle  ratio inequality is predicted to lead to impaired muscle performance and low mitochondrial
  in high
  ratio muscle compartments, and excess oxygen availability and high mitochondrial
  in low
  ratio compartments. Such changes in mitochondrial
  might in turn affect regional vasomotor control, reactive O2 species generation, and possibly gene expression.
Glossary
- COPD
chronic obstructive pulmonary disease
- DL
lung diffusing capacity
- DM
tissue (muscle) diffusing capacity
- [Hb]
haemoglobin concentration
- FEV
forced expired volume

inspired O2 fraction

arterial


mitochondrial


blood flow distribution

expired ventilation

ventilation–perfusion inequality

inspired ventilation

maximum oxygen delivery–uptake

muscle metabolism

mitochondrial maximal capacity for O2 consumption
Additional information
Competing interests
No competing interests.
Author contributions
I.C., J.R. and P.D.W. made substantial contributions to conception and design, and/or acquisition of data, and/or analysis and interpretation of data; I.C. and P.D.W. constructed, tested and run the algorithms used in the model; I.C., J.R. and P.D.W. participated in drafting the article and revising it critically for important intellectual content and gave final approval of the version to be submitted and any revised version.
Funding
This research has been carried out under the Synergy-COPD research grant, funded by the Seventh Framework Program of the European Commission as a Collaborative Project with contract no.: 270086 (2011–2014), and NIH P01 HL091830.
References
- Andersen P. Saltin B. Maximal perfusion of skeletal muscle in man. J Physiol. 1985;366:233–249. doi: 10.1113/jphysiol.1985.sp015794. [DOI] [PMC free article] [PubMed] [Google Scholar]
- Blanco I, Gimeno E, Munoz PA, Pizarro S, Gistau C, Rodriguez-Roisin R, Roca J. Barberà JA. Hemodynamic and gas exchange effects of sildenafil in patients with chronic obstructive pulmonary disease and pulmonary hypertension. Am J Respir Crit Care Med. 2010;181:270–278. doi: 10.1164/rccm.200907-0988OC. [DOI] [PubMed] [Google Scholar]
- Cano I, Mickael M, Gomez-Cabrero D, Tegnér J, Roca J. Wagner PD. Importance of mitochondrial in maximal O2 transport and utilization: A theoretical analysis. Respir Physiol Neurobiol. 2013;189:477–483. doi: 10.1016/j.resp.2013.08.020. [DOI] [PMC free article] [PubMed] [Google Scholar]
- Delashaw JB. Duling BR. A study of the functional elements regulating capillary perfusion in striated muscle. Microvasc Res. 1988;36:162–171. doi: 10.1016/0026-2862(88)90016-7. [DOI] [PubMed] [Google Scholar]
- Duling BR. Damon DH. An examination of the measurement of flow heterogeneity in striated muscle. Circ Res. 1987;60:1–13. doi: 10.1161/01.res.60.1.1. [DOI] [PubMed] [Google Scholar]
- Gnaiger E, Lassnig B, Kuznetsov A, Rieger G. Margreiter R. Mitochondrial oxygen affinity, respiratory flux control and excess capacity of cytochrome c oxidase. J Exp Biol. 1998;201:1129–1139. doi: 10.1242/jeb.201.8.1129. [DOI] [PubMed] [Google Scholar]
- Hammond MD. Hempleman SC. Oxygen diffusing capacity estimates derived from measured VA/Q distributions in man. Respir Physiol. 1987;69:129–147. doi: 10.1016/0034-5687(87)90022-3. [DOI] [PubMed] [Google Scholar]
- Kelman GR. Digital computer subroutine for the conversion of oxygen tension into saturation. J Appl Physiol. 1966;21:1375–1376. doi: 10.1152/jappl.1966.21.4.1375. [DOI] [PubMed] [Google Scholar]
-
Knight DR, Poole DC, Schaffartzik W, Guy HJ, Prediletto R, Hogan MC. Wagner PD. Relationship between body and leg
 during maximal cycle ergometry. J Appl Physiol (1985) 1992;73:1114–1121. doi: 10.1152/jappl.1992.73.3.1114. [DOI] [PubMed] [Google Scholar]
 - McGuire BJ. Secomb TW. A theoretical model for oxygen transport in skeletal muscle under conditions of high oxygen demand. J Appl Physiol (1985) 2001;91:2255–2265. doi: 10.1152/jappl.2001.91.5.2255. [DOI] [PubMed] [Google Scholar]
- Mik EG. Measuring mitochondrial oxygen tension: from basic principles to application in humans. Anesth Analg. 2013;117:834–846. doi: 10.1213/ANE.0b013e31828f29da. [DOI] [PubMed] [Google Scholar]
- Nuutila P. Kalliokoski K. Use of positron emission tomography in the assessment of skeletal muscle and tendon metabolism and perfusion. Scand J Med Sci Sports. 2000;10:346–350. doi: 10.1034/j.1600-0838.2000.010006346.x. [DOI] [PubMed] [Google Scholar]
- Resar JR, Roguin A, Voner J, Nasir K, Hennebry TA, Miller JM, Ingersoll R, Kasch LM. Semenza GL. Hypoxia-inducible factor 1α polymorphism and coronary collaterals in patients with ischemic heart disease. Chest. 2005;128:787–791. doi: 10.1378/chest.128.2.787. [DOI] [PubMed] [Google Scholar]
- Richardson RS, Haseler LJ, Nygren AT, Bluml S. Frank LR. Local perfusion and metabolic demand during exercise: a noninvasive MRI method of assessment. J Appl Physiol (1985) 2001;91:1845–1853. doi: 10.1152/jappl.2001.91.4.1845. [DOI] [PubMed] [Google Scholar]
- Rowell LB. Human Circulation: Regulation during Physical Stress. Oxford University Press, New York; 1986. pp. 329–361. ). Cardiovascular adjustments to hypoxemia. [Google Scholar]
- Scandurra FM. Gnaiger E. Cell respiration under hypoxia: facts and artefacts in mitochondrial oxygen kinetics. Adv Exp Med Biol. 2010;662:7–25. doi: 10.1007/978-1-4419-1241-1_2. [DOI] [PubMed] [Google Scholar]
- Semenza GL. Oxygen sensing, homeostasis, and disease. N Engl J Med. 2011;365:537–547. doi: 10.1056/NEJMra1011165. [DOI] [PubMed] [Google Scholar]
- Sutton JR, Reeves JT, Wagner PD, Groves BM, Cymerman A, Malconian MK, Rock PB, Young PM, Walter SD. Houston CS. Operation Everest II: oxygen transport during exercise at extreme simulated altitude. J Appl Physiol. 1988;64:1309–1321. doi: 10.1152/jappl.1988.64.4.1309. [DOI] [PubMed] [Google Scholar]
- Vogiatzis I, Habazettl H, Louvaris Z, Andrianopoulos V, Wagner H, Zakynthinos S, Wagner PD. A method for assessing heterogeneity of blood flow and metabolism in exercising normal human muscle by near infrared spectroscopy. J Appl Physiol. 2015;118 doi: 10.1152/japplphysiol.00458.2014. (in press), doi: 10.1152/japplphysiol.00458.2014. [DOI] [PubMed] [Google Scholar]
-
Wagner PD. Algebraic analysis of the determinants of
 . Respir Physiol. 1993;93:221–237. doi: 10.1016/0034-5687(93)90007-w. [DOI] [PubMed] [Google Scholar]
 -
Wagner PD. A theoretical analysis of factors determining
 at sea level and altitude. Respir Physiol. 1996;106:329–343. doi: 10.1016/s0034-5687(96)00086-2. [DOI] [PubMed] [Google Scholar]
 - Wagner PD. The multiple inert gas elimination technique (MIGET) Intensive Care Med. 2008;34:994–1001. doi: 10.1007/s00134-008-1108-6. [DOI] [PubMed] [Google Scholar]
- Wagner PD, Hedenstierna G. Bylin G. Ventilation-perfusion inequality in chronic asthma. Am Rev Respir Dis. 1987a;136:605–612. doi: 10.1164/ajrccm/136.3.605. [DOI] [PubMed] [Google Scholar]
- Wagner PD, Laravuso RB, Uhl RR. West JB. Continuous distributions of ventilation-perfusion ratios in normal subjects breathing air and 100 per cent O2. J Clin Invest. 1974;54:54–68. doi: 10.1172/JCI107750. [DOI] [PMC free article] [PubMed] [Google Scholar]
- Wagner PD, Sutton JR, Reeves JT, Cymerman A, Groves BM. Malconian MK. Operation Everest II: pulmonary gas exchange during a simulated ascent of Mt Everest. J Appl Physiol (1985) 1987b;63:2348–2359. doi: 10.1152/jappl.1987.63.6.2348. [DOI] [PubMed] [Google Scholar]
- Weibel ER. The Pathway for Oxygen. Cambridge, MA, USA: Harvard University Press; 1984. [Google Scholar]
- Welch HG. Hyperoxia and human performance: a brief review. Med Sci Sports Exerc. 1982;14:253–262. doi: 10.1249/00005768-198204000-00001. [DOI] [PubMed] [Google Scholar]
- West JB. Ventilation–perfusion inequality and overall gas exchange in computer models of the lung. Respir Physiol. 1969;7:88–110. doi: 10.1016/0034-5687(69)90071-1. [DOI] [PubMed] [Google Scholar]
- West JB. Causes of carbon dioxide retention in lung disease. N Engl J Med. 1971;284:1232–1236. doi: 10.1056/NEJM197106032842202. [DOI] [PubMed] [Google Scholar]
- Wilson DF, Erecinska M, Drown C. Silver IA. Effect of oxygen tension on cellular energetics. Am J Physiol Cell Physiol. 1977;233:C135–C140. doi: 10.1152/ajpcell.1977.233.5.C135. [DOI] [PubMed] [Google Scholar]