

Abstract
Interstitial cells, known as platelet derived growth factor receptor α (PDGFRα+) cells, are closely associated with varicosities of enteric motor neurons and suggested to mediate purinergic hyperpolarization responses in smooth muscles of the gastrointestinal tract (GI), but this concept has not been demonstrated directly in intact muscles. We used confocal microscopy to monitor Ca2+ transients in neurons and post-junctional cells of the murine colon evoked by exogenous purines or electrical field stimulation (EFS) of enteric neurons. EFS (1–20 Hz) caused Ca2+ transients in enteric motor nerve processes and then in PDGFRα+ cells shortly after the onset of stimulation (latency from EFS was 280 ms at 10 Hz). Responses in smooth muscle cells (SMCs) were typically a small decrease in Ca2+ fluorescence just after the initiation of Ca2+ transients in PDGFRα+ cells. Upon cessation of EFS, several fast Ca2+ transients were noted in SMCs (rebound excitation). Strong correlation was noted in the temporal characteristics of Ca2+ transients evoked in PDGFRα+ cells by EFS and inhibitory junction potentials (IJPs) recorded with intracellular microelectrodes. Ca2+ transients and IJPs elicited by EFS were blocked by MRS-2500, a P2Y1 antagonist, and absent in P2ry1(−/−) mice. PDGFRα+ cells expressed gap junction genes, and gap junction uncouplers, 18β-glycyrrhetinic acid (18β-GA) and octanol blocked Ca2+ transients in SMCs but not in neurons or PDGFRα+ cells. IJPs recorded from SMCs were also blocked. These findings demonstrate direct innervation of PDGFRα+ cells by motor neurons. PDGFRα+ cells are primary targets for purinergic neurotransmitter(s) in enteric inhibitory neurotransmission. Hyperpolarization responses are conducted to SMCs via gap junctions.
Key points
Platelet derived growth factor receptor α (PDGFRα+) cells in colonic muscles are innervated by enteric inhibitory motor neurons.
PDGFRα+ cells generate Ca2+ transients in response to exogenous purines and these responses were blocked by MRS-2500.
Stimulation of enteric neurons, with cholinergic and nitrergic components blocked, evoked Ca2+ transients in PDGFRα+ and smooth muscle cells (SMCs).
Responses to nerve stimulation were abolished by MRS-2500 and not observed in muscles with genetic deactivation of P2Y1 receptors.
Ca2+ transients evoked by nerve stimulation in PDGFRα+ cells showed the same temporal characteristics as electrophysiological responses.
PDGFRα+ cells express gap junction genes, and drugs that inhibit gap junctions blocked neural responses in SMCs, but not in nerve processes or PDGFRα+ cells.
PDGFRα+ cells are directly innervated by inhibitory motor neurons and purinergic responses are conducted to SMCs via gap junctions.
Introduction
Gastrointestinal (GI) motility is regulated by the enteric nervous system, which includes excitatory and inhibitory motor neurons innervating the muscle layers (Burnstock et al. 1963; Bennett, 1966; Waterman & Costa, 1994; Spencer & Smith, 2001). Inhibitory neurotransmission reduces the excitability of smooth muscle cells (SMCs), reducing Ca2+ entry through voltage-dependent Ca2+ channels and relaxing muscles. Inhibitory motor neurons release nitric oxide (NO), purines, vasoactive intestinal polypeptide (VIP) and pituitary adenylate cyclase-activating polypeptide (PACAP) (Burnstock et al. 1970; Bitar et al. 1980; Bult et al. 1990; Crist et al. 1992; Grider et al. 1994; Mutafova-Yambolieva et al. 2007). The post-junctional electrical response to enteric inhibitory neurotransmission is an inhibitory junction potential (IJP) composed of a fast hyperpolarization (fIJP) followed by a slower component (sIJP). fIJPs are mediated by purines (Crist et al. 1992; Gallego et al. 2006; Hwang et al. 2012), and sIJPs are mediated largely by NO (Dalziel et al. 1991; Stark et al. 1991; Keef et al. 1993). Peptide responses can be resolved with higher frequency or stimulation durations of many seconds (Keef et al. 2013). Purine neurotransmitters bind to purinergic receptor subtype (P2Y1) receptors and activate small conductance Ca2+-activated K+ (SK) channels in post-junctional cells, based on studies using receptor antagonists (Gallego et al. 2006; Hwang et al. 2012), SK channel blockers (Banks et al. 1979; Spencer et al. 1998b) and P2ry1(−/−) mice (Gallego et al. 2012; Hwang et al. 2012).
SMCs have been considered the site of transduction of enteric inhibitory neurotransmission, but recent studies show that interstitial cells labelled by antibodies to platelet-derived growth factor receptor α (PDGFRα+ cells) are the post-junctional cells with dominant expression of P2Y1 receptors and SK channels and the cells that generate hyperpolarization in response to P2Y1 agonists (Kurahashi et al. 2011, 2012, 2014; Baker et al. 2013; Peri et al. 2013). PDGFRα+ cells lie in close proximity to varicose nerve terminals in GI smooth muscle tissues (Iino & Nojyo, 2009; Cobine et al. 2011; Kurahashi et al. 2011, 2012; Blair et al. 2012; Grover et al. 2012; Tamada & Hashitani, 2014). Functional data show that PDGFRα+ cells respond to purinergic agonists and generate outward currents, Ca2+ transients and hyperpolarization responses consistent with responses of whole muscles to purine neurotransmitters (Kurahashi et al. 2011; Baker et al. 2013; Lee et al. 2013). SMCs, stimulated directly with purine agonists, generate either no response or small inward currents and depolarization. Lastly, electron microscopy has demonstrated gap junctions between PDGFRα+ cells and SMCs in GI muscles (Komuro et al. 1999; Horiguchi and Komuro, 2000; Fujita et al. 2003), suggesting that fIJPs can be conducted through low resistance pathways from PDGFRα+ cells to SMCs. In spite of this evidence, direct innervation of PDGFRα+ cells and an appropriate sequence of activation (i.e. nerve, PDGFRα+ cells, SMC) have not been demonstrated in intact muscles. In this study we used Ca2+ indicators loaded into cells within intact muscles and confocal microscopy to investigate the sequence of activation of cells in response to purinergic neurotransmission.
Methods
Animals
PDGFRα tm11(EGFP)Sor/J, P2ry1(−/−), B6.129P2-P2ry1tm1Bhk/J, and SM-eGFP B6.Cg-TgMyh11-cre,-EGFP2Mik/J mice were purchased from the Jackson Laboratory (Bar Harbor, ME, USA). Animals between the ages of 5 and 8 weeks (aged-matched of either sex) were anaesthetized by inhalation of isoflurane (Baxter, Deerfield, IL, USA) and exsanguinated after cervical dislocation before removing the entire GI tracts. The use of animals and experiments performed were in accordance with the National Institutes of Health Guide for the Care and Use of Laboratory Animals. The Institutional Animal Use and Care Committee at the University of Nevada approved all procedures.
Tissue preparation
Isolated colons were bathed in Krebs-Ringer bicarbonate solution (KRB) and opened along the mesenteric border. Contents were washed away with KRB. Distal colons (1.5–2.0 cm), 1.5 cm rostral to the anus, were used for these experiments.
Drugs and solutions
Tissues were maintained by constant perfusion with KRB containing (mmol l–1): NaCl, 120.35; KCl, 5.9; NaHCO3, 15.5; NaH2PO4, 1.2; MgCl2, 1.2; CaCl2, 2.5; and glucose, 11.5. KRB was bubbled with a mixture of 97% O2 – 3% CO2 and warmed to 37 ± 0.2°C. 18-b-Glycyrrhetinic acid, atropine, Nω-nitro-l-arginine (l-NNA), ATP, ADP, β-NAD and octanol were purchased from Sigma-Aldrich (St Louis, MO, USA). N-Methanocarba-2MeSADP (MRS-2365) and 2-iodo-6- (methylamino)-9H-purin-9-yl] 2 (phosphonooxy) bicyclohexane 1 methanol dihydrogen phosphate ester tetraammonium salt (MRS-2500) were purchased from Tocris Bioscience (Ellisville, MO, USA). All drugs were dissolved in the solvents recommended by the manufacturer to make stock solutions and then dissolved in KRB to the final dilutions desired for experimental tests.
Immunohistochemistry
Whole mount sections of distal colon were studied with immunohistochemical techniques. Tissues were fixed in acetone or paraformaldehyde (4°C; 10 min) as previously described (Baker et al. 2013) Following fixation, preparations were washed for 30 min in PBS (0.1 m, pH 7.4). Non-specific antibody binding was reduced by incubation in 1% BSA for 1 h at room temperature. The tissues were incubated with primary antibodies for 48 h at 4°C and with secondary antibodies for 1 h at room temperature. The antibodies and dilutions were used as previously described (Kurahashi et al. 2011; Baker et al. 2013). Whole mounts were examined with a Zeiss LSM 510 Meta laser scanning confocal microscope. Confocal micrographs displayed are digital composites of Z-series scans of 0.5–1.0 μm optical sections through a depth of 5–40 μm. Final images were constructed using Zeiss LSM software.
Fluorescence activated cell sorting (FACS)
Distal colon muscles of PDGFRαtm11(EGFP)Sor/J mice and SM-eGFP B6.Cg-TgMyh11-cre,-EGFP2Mik/J mice were dissected as described above. Muscles were equilibrated in Ca2+-free Hanks solution for 30 min and then triturated to disperse cells, as previously described (Baker et al. 2013). PDGFRα+ cells (enhanced green fluorescent protein (eGFP) in nuclei) and SMC-eGFP cells were sorted by FACS with a Becton-Dickinson FACSAria II instrument using an excitation laser (488 nm) and emission filter (530/30 nm). Sorting was performed using a 130 μm nozzle at a sheath pressure of 12 p.s.i. (∼82.8 kPa) and sort rate of 1000–3000 events s−1. Live cells, gated on exclusion of Hoechst 33258 viability indicator (data not shown), were subsequently gated on eGFP fluorescence intensity.
RNA extraction and quantitative PCR (qPCR)
Total RNA was isolated from purified PDGFRα+ cells, SMCs and dispersed colonic cells before sorting (i.e. representing the total cell population from the tunica muscularis), using an illustra RNAspin Mini RNA Isolation Kit (GE Healthcare, Piscataway, NJ, USA), and first-strand cDNA was synthesized using SuperScript III (Life Technologies, Grand island, NY, USA), according to the manufacturer's instructions. The PCR primers used and their GenBank accession numbers are listed in Table1. Using GoTaq DNA Polymerase (Promega, Madison, WI, USA), PCR products were analysed on 2% agarose gels and visualized by ethidium bromide. qPCR was performed with the same primers as PCR using SYBR green chemistry on the 7500 HT Real-time PCR System (Applied Biosystems, Foster City, CA, USA) and analysed as previously described (Baker et al. 2013).
Table 1.
Summary of gap junction gene primer sequences
| Gene | Primer sequence | GenBank accession number |
|---|---|---|
| mGapdh-F | GCCGATGCCCCCATGTTTGTGA | NM_008084 |
| mGapdh-R | GGGTGGCAGTGATGGCATGGAC | |
| mGja1-F | ACCGAGGTGCCTTGGTCGGT | NM_008772 |
| mGja1-R | CCGGTCTTGGTCAGGGCACA | |
| mGja5-F | AGCACCATCAATGGCACCTGGGA | NM_008773 |
| mGja5-R | CACGACGTTCAGGCACAACCC | |
| mGja7-F | GGCCCTCAATGCCCCAACCC | NM_020621 |
| mGja7-R | GCCAGTGCCAAAGGGCCAGT | |
| mGjb1-F | ACCGCACTGTGTGCTACGAC | NM_183168 |
| mGjb1-R | CGGCGGGCCATGCGACAATA | |
| mGjb2-F | GGCTGACGTCACTGAACGCCTG | NM_027571 |
| mGjb2-R | TCTCTTCGCTTGGTTCGCCACC |
Calcium imaging
Distal colon muscles were pinned to the base of a Sylgard-coated dish. After an equilibration period of 1 h, the preparation was loaded with Oregon Green 488 BAPTA-2 AM (10 μg ml−1; Life Technologies) in a solution of 0.02% DMSO and 0.01% non-toxic detergent Cremophor EL for 30 min at 25°C. After incubation, the preparation was perfused with warmed Krebs solution (37°C for 40 min) to de-esterify the dye.
PDGFRα+ cells within circular muscle bundles were identified unequivocally by the eGFP reporter expressed in their nuclei. Ca2+ responses to stimulation of intrinsic neurons were measured with a spinning-disc confocal microscope (CSU-X1; spinning disk, Yokogawa Electric, Tokyo, Japan) mounted on an upright Nikon Eclipse FN1 microscope equipped with a 60× lens, Nikon CFI Fluor 60x 1.00 na−1 (Nikon Instruments, New York, USA). The indicator was excited at 488 nm using a laser coupled to a borealis system (ANDOR Technology, Belfast, UK) to increase laser intensity and uniformity. The fluorescence emission (>515 nm) was detected using a high-speed Andor iXon Ultra EMCCD Camera (ANDOR Technology). Image sequences were collected at 33 frames per second using NIS-Elements software (Nikon Instruments). Movies and image sequences of Ca2+ activity in PDGFRα+ cells were processed and analysed using custom software (Volumetry G8a, G.W.H.). Where necessary, tissue movement was stabilized to ensure accurate measurements of Ca2+ transients from identified cells. Background subtraction was applied to movies to better enhance dynamic contrast of Ca2+ transients in nerve bundles and PDGFRα+ cells.
Electrical field stimulation (EFS)
Two parallel platinum electrodes were placed on either side of the colonic muscle sheets described above. Intrinsic neurons were excited by square wave pulses of EFS (one pulse or 5–20 Hz, 0.5 ms pulse durations; 1 s trains) delivered by a Grass S48 stimulator (Quincy, MA, USA). Ca2+ and electrophysiological responses induced by EFS were abolished by pretreatment with TTX (1 μm, data not shown). Ca2+ imaging and electrophysiological recording were performed in separate experiments. Circular muscle cells were impaled with glass microelectrodes, and transmembrane potentials were measured with a high impedance electrometer (Axoclamp 2B; Axon Instruments/Molecular Devices, Sunnyvale, CA, USA). Membrane potential information was digitized using a Digidata 1322A (Axon Instruments) and recorded by a computer running Axoscope 9.2 software (Axon Instruments).
Statistical analysis
Figures displayed were made from digitized data using Adobe Photoshop 4.0.1 (Adobe, Mountain View, CA, USA), Clampfit software (Molecular Devices), Corel Draw 12 (Corel, Ontario, Canada), Excel and PowerPoint 2011 (Microsoft, Redmond, WA, USA). The bar graphs represent the means from each experiment and ‘n’ values refer to the number of animals used for each measurement. Data are expressed as means ± SEM. Statistical significance was calculated using either Student's t test or a one-way ANOVA followed by a post hoc Newman–Keuls test. P values of < 0.05 were considered to represent significant changes.
Several parameters were calculated from recordings of Ca2+ activity, including: (i) durations of responses in nerve fibres, PDGFRα+ cells and SMCs; (ii) latency from the initiation of EFS to the peaks of initial Ca2+ transients in PDGFRα+ cells; and (iii) the latency from the initiation of EFS to the peak of the initial Ca2+ transient in SMCs using NIS-Elements software (Nikon Instruments).
Several parameters of electrical activity were also analysed: (i) resting membrane potential; (ii) action potential number before and after EFS; (iii) amplitude of fIJPs; (iv) latency from start of EFS to fIJP peak; and (v) latency from the initiation of EFS to the first action potential peak. These parameters were calculated with pCLAMP software (Molecular Devices). The following abbreviations are used throughout the analysis and figures (c, cells; * =motion/focus/bleed-through artifact). P values are reported in figures as ***≤0.001, **≤0.01, *≤0.05 and not significant (NS ≥ 0.05).
Results
Ca2+ signalling in intramuscular PDGFRα+ cells
Ca2+ imaging was performed on flat-sheet colonic muscle preparations from PDGFRαtm11(EGFP)Sor/J mice to examine spontaneous Ca2+ transients and purinergic responses in PDGFRα+ cells. This allowed unequivocal identification of PDGFRα+ cells (by eGFP expression in nuclei) and did not obscure resolution of cytoplasmic Ca2+ transients. Intramuscular PDGFRα+ (PDGFRα+-IM) cells were found at an average density of 461 ± 16 cells mm–2 (n = 20; c = 360) and with an average minimum separation between cell bodies of 35.2 ± 2.7 μm (n = 20; c = 360).
Ca2+ transients were resolved under basal conditions in several PDGFRα+ cells within a given field (spontaneous Ca2+ transients occurred in 20.4 ± 3% of cells at an average of 10.2 ± 1.2 events min−1 (range 2–12 events min−1); n = 12). Spontaneous Ca2+ transients were not resolved in the remaining PDGFRα+ cells. TTX (1 μm) decreased, but did not abolish, spontaneous Ca2+ transients in PDGFRα+ cells (5.6 ± 0.7 events min−1 after TTX vs. 8.9 ± 0.8 events min−1 in these muscles before TTX; n = 5, P = 0.01; Fig.1L).
Figure 1. Ca2+ transients in PDGFRα+ cells in response to exogenous purines.
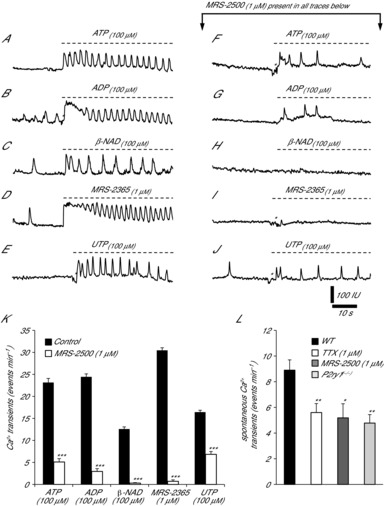
Ca2+ transients occurred spontaneously in PDGFRα+ cells but were enhanced by ATP (A, 100 μm), ADP (B, 100 μm) and β-NAD (C, 100 μm) (n = 10 for each purine, P = 0.001). D and E, Ca2+ transients were also stimulated by the P2Y1 agonist MRS-2365 (D, 1 μm) and UTP (E, 100 μm) (n = 10 and n = 8, respectively; P = 0.001). F–J, Ca2+ responses of PDGFRα+ cells to purines after pre-treatment with the P2Y1 receptor antagonist, MRS-2500 (1 μm). Responses to ATP (100 μm), ADP (100 μm) and UTP (100 μm) were reduced in the presence of MRS-2500, but not blocked (F, G and J, respectively; n = 6 each, P = 0.001). MRS-2500 abolished Ca2+ transient responses to β-NAD (H) and MRS-2365 (J). K, summary of changes in Ca2+ transients evoked by purines under control conditions and after addition of MRS-2500. l-NNA (100 μm) and atropine (1 μm) were present in all experiments. L, summary graph of the effects of TTX (P = 0.008) and MRS-2500 (P = 0.02) on the spontaneous Ca2+ transients in PDGFRα+ cells in wild-type (WT) muscles. Spontaneous Ca2+ transients were also reduced in PDGFRα+ cells of P2ry1(−/−) muscles (n = 5, P = 0.01; raw data traces not shown). Asterisks denote motion/focus artifacts in all panels.
Next we examined responses of PDGFRα+ cells to a variety of purine agonists and antagonists. All of these experiments were performed in the presence of l-NNA (100 μm) and atropine (1 μm) to reduce contamination from nitrergic and cholinergic responses. The average occurrence of spontaneous Ca2+ transients in PDGFRα+ cells before addition of purines was 9.3 ± 1.4 events min−1 (n = 20).
ATP (100 μm) increased the Ca2+ transients in PDGFRα+ cells (Fig.1A and K). These responses were typically characterized by an initial sustained rise in fluorescence that tapered off gradually and lasted 3.6 ± 0.42 s (n = 10; Fig.1A). The sustained rise was followed by oscillatory Ca2+ waves that lasted through the recording period (Fig.1A). ATP increased the Ca2+ transients to 23.2 ± 1.5 events min−1 (n = 10, P = 0.001; Fig.1A and K). ADP (100 μm) evoked Ca2+ responses consisting of a sustained Ca2+ transient that tapered off gradually and lasted 6.2 ± 0.75 s (n = 10; Fig.1B). The sustained phase was followed by Ca2+ oscillations at 24.4± 1.34 events min−1 (n = 10, P = 0.001; Fig.1B and K).
β-NAD, a candidate purine neurotransmitter in GI muscles (Mutafova-Yambolieva et al. 2007), also evoked Ca2+ responses in PDGFRα+ cells similar those evoked by ATP and ADP (Fig.1C). β-NAD (100 μm) increased the activity of Ca2+ transients and included an initial sustained rise in Ca2+ lasting 2 ± 0.2 s (n = 10; Fig.1C) and then Ca2+ oscillations averaging 12.6 ± 1 events min−1 (n = 10, P = 0.01; Fig.1C and K). The effects of UTP were also examined. UTP (100 μm) evoked Ca2+ responses in the PDGFRα+ cells consisting of a sustained Ca2+ transient lasting 3.7 ± 0.42 s (n = 8; Fig.1E). The sustained phase was followed by increased Ca2+ oscillations at 16.4 ± 0.84 events min−1 (n = 8, P = 0.001; Fig.1E and K). Both spontaneously active and quiescent cells responded to exogenous purines. These experiments showed that multiphasic Ca2+ responses are elicited in PDGFRα+ cells by a variety of naturally occurring purines.
Role of P2Y1 receptors in purinergic responses of PDGFRα+ cells
Molecular studies have shown robust expression of P2Y1 receptors in PDGFRα+ cells of colon, fundus and bladder muscles (Kurahashi et al. 2011; Baker et al. 2013; Lee et al. 2013). Previous studies have shown that purinergic stimulation activates outward currents in single isolated PDGFRα+ cells (Kurahashi et al. 2011). Therefore, we evaluated the role of P2Y1 receptors in mediating Ca2+ responses to purines in PDGFRα+ cells in situ.
Similar to responses to biological purines, a robust increase in Ca2+ transients was elicited in PDGFRα+ cells by the P2Y1 receptor agonist MRS-2365 (1 μm; Fig.1D). MRS-2365 increased Ca2+ transients to 30.5 ± 1.2 events min−1 (n = 10; P = 0.001; Fig.1D and K). These responses were also characterized by an initial sustained rise in Ca2+ that lasted 8.2 ± 0.58 s (n = 10; Fig.1D).
Pretreatment of muscles with MRS-2500 (1 μm), a highly selective antagonist of P2Y1 receptors, decreased, but did not abolish, spontaneous Ca2+ transients in PDGFRα+ cells (5.2 ± 1.1 events min−1; n = 5, P = 0.02; Fig. 1L). MRS-2500 abolished Ca2+ responses evoked by β-NAD and MRS-2365 (Fig.1H and I, respectively). Responses to ATP and ADP were attenuated by MRS-2500, and the sustained Ca2+ oscillations typical of ATP responses were reduced to 5.1 ± 1.52 events min−1 (n = 6, P = 0.001; Fig.1F and K). Responses to ADP after MRS-2500 pretreatment were reduced to 2.9 ± 1.3 events min−1 (n = 6, P = 0.001; Fig.1G and K). In contrast, MRS-2500 reduced the UTP response by only 58.4 ± 4% (to 6.8 ± 1.3 events min−1, n = 6, P = 0.001; Fig.1J and K).
PDGFRα+ cell responses to nerve stimulation
Ca2 responses to EFS (single pulse and 5–20 Hz; 1 s trains; 0.5 ms pulse duration) were characterized in PDGFRα+-IM cells identified by eGFP in nuclei (Fig.2A–E). In the presence of l-NNA (100 μm) and atropine (1 μm), EFS triggered rapid transient Ca2+ responses in nerve fibres that peaked 60 ± 3.4 ms after initiation of EFS and decayed within 1991 ± 100.69 ms (10 Hz EFS; n = 16; Fig.2D). Ca2+ transients were stimulated in both spontaneously active and quiescent PDGFRα+ cells after initiation of EFS, but these responses were delayed slightly relative to the responses in nerve fibres. Ca2+ transients were initiated in PDGFRα+ cells with a latency of 280 ± 17.4 ms and peaked at 356 ± 16.4 ms after the onset of EFS. Ca2+ responses in PDGFRα+ cells lasted 1615 ± 94.6 ms at 10 Hz EFS (n = 16; Fig.2F, G and Supporting Information, Movie S1).
Figure 2. Ca2+ responses of PDGFRα+ cells to nerve stimulation.
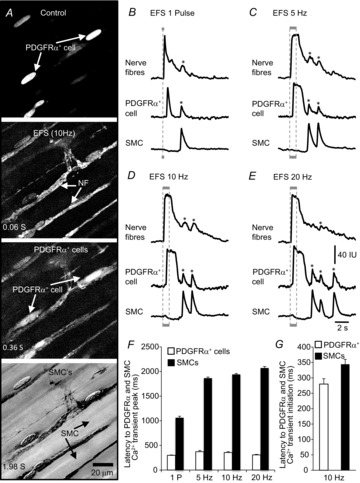
A, images showing Ca2+ responses at different time points during EFS. Arrows show locations of PDGFRα+ cells, nerve fibres (NF) and SMCs. Scale bar in final panel is 20 μm and pertains to all images. Representative traces of Ca2+ transients in nerve fibres (NF), PDGFRα+ cells and SMCs evoked by EFS at different frequencies: responses to single pulse (1 P) (B), 5 Hz (C), 10 Hz (D) and 20 Hz (E) are shown. Stimulus trains were delivered for 1 s (denoted by grey bars below each set of traces and by dotted lines through the traces). Asterisks denote bleedthrough artifacts that usually came from SMCs signals because these cells lay beneath all other cells. In A, Control shows PDGFRα+ cells clearly distinguishable by eGFP expression in nuclei, EFS (10 Hz) activated nerve bundles (NF) immediately after the onset of EFS (background prior to simulation was subtracted), Ca2+ responses in PDGFRα+-IM were activated soon after responses in neurons (i.e. 0.28 s after onset of EFS (D, G); background and activated nerve bundle images were subtracted). Ca2+ responses occurred in SMCs subsequent to PDGFRα+-IM (B–E). Typically a small decrease in Ca2+ fluorescence was noted during EFS (i.e. 0.34 s after onset of EFS; D, G) and then an increase in Ca2+ fluorescence was noted after cessation of EFS (B–F), or in this case about 2 s after initiation of EFS (background and activated nerve bundle images were subtracted). A summary of the latencies (ms) from the start of EFS to the peaks of Ca2+ transients in PDGFRα+ cells and SMCs is shown in F (n = 16). A comparison between latencies (ms) from the start of EFS to the initiation of Ca2+ transients in PDGFRα+ cells and SMCs at 10 Hz is shown in G (n = 16).
SMCs responded to EFS initially with a decrease in Ca2+ fluorescence that began after the activation of Ca2+ transients in PDGFRα+ cells. Initiation of this drop in fluorescence occurred close in time to the peak of the Ca2+ transient in PDGFRα+ cells (i.e. latency was 344 ± 15.8 ms at 10 Hz; n = 11; Fig.3D and G). A majority of SMCs (69%) displayed a decrease in Ca2+ fluorescence that lasted 1683 ± 84.3 ms and decreased 16.7 ± 2.3% below basal Ca2+ in response to 10 Hz EFS (n = 11, Figs2D and 3D). A decrease in basal Ca2+ could not be resolved in the remainder of the SMCs during EFS. In cells in which Ca2+ was reduced, the reduction was sustained during EFS, and then a post-stimulus (rebound) excitation developed and triggered positive Ca2+ transients in SMCs. The post-stimulus Ca2+ responses in SMCs occurred well after the Ca2+ transients in neuronal and PDGFRα+ cells had settled and after cessation of EFS. The latency from initiation of EFS to the peak of Ca2+ transients in SMCs was 1941 ± 18.2 ms at 10 Hz EFS (n = 16; Fig.2D and F). The post-stimulus Ca2+ transients in SMCs lasted for 804 ± 106.4 ms at 10 Hz EFS (n = 16; Fig.2D).
Figure 3. Ca2+ transients in PDGFRα+ cells are mediated predominantly by P2Y1 receptors.
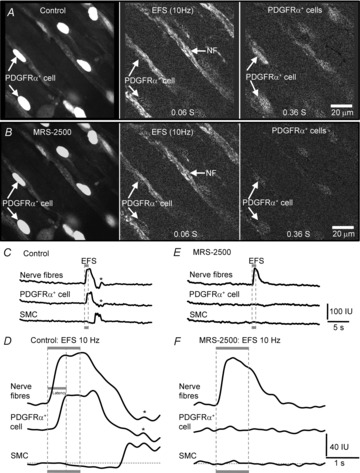
Ca2+ transients in PDGFRα+ cells evoked by EFS (10 Hz) were inhibited by MRS-2500 (1 μm). White arrows indicate PDGFRα+ cells or nerve fibres (NF), as indicated. Time sequence images emphasizing sequence of Ca2+ transients in nerve fibres and PDGFRα+ cells (identified by eGFP in nuclei) in response to EFS (10 Hz) before (A) and with MRS-2500 (1 μm; B). l-NNA (100 μm) and atropine (1 μm) were present during all recordings. EFS failed to evoke Ca2+ transients in PDGFRα+ cells in the presence of MRS-2500, but similar amplitude and duration responses were sustained in nerve fibres (n = 8). Scale bar in A and B is 20 μm and pertains to all panels. C and E, representative plots of Ca2+ transients in nerve fibres, PDGFRα+ cells and SMCs in response to EFS (10 Hz) before (C) and with MRS-2500 (1 μm; E), respectively. Magnified traces show the Ca2+ transients in nerve fibres, PDGFRα+ cells and SMCs without (D) and with MRS-2500 (1 μm; F), respectively. A small decrease in basal Ca2+ was often noted in the smooth muscle records during EFS (region below dotted line in D). Responses to EFS in PDGFRα+ cells and SMCs were blocked by MRS-2500 (F). In all experiments, EFS was delivered in 1 s trains (denoted by the grey box and the dotted lines through the traces).
These experiments demonstrate a temporal sequence in the responses to enteric motor nerve stimulation: nerve bundles were activated immediately after the onset of EFS, PDGFRα+ cells responded after a short latency, and this response was followed rapidly by a dip in Ca2+ in SMCs (see time sequence images in Fig.2A). Figure 2F and G summarizes the latencies after initiation of EFS to Ca2+ responses in PDGFRα+ cells and SMCs. The appearance of Ca2+ transients in PDGFRα+ cells prior to SMCs indicates the sequence of activation in response to the purinergic component of neurotransmission.
Ca2+ responses of PDGFRα+ cells are mediated via P2Y1 receptors
Electrophysiological experiments have shown that puri-nergic neurotransmission is mediated by post-junctional P2Y1 receptors in the murine colon (Gallego et al. 2012; Hwang et al. 2012). Therefore, we examined the effects of a selective P2Y1 antagonist on the Ca2+ transients elicited by EFS. Time sequence images of Ca2+ transients evoked by EFS show that the responses of PDGFRα+ cells and SMCs were inhibited by MRS-2500 (1 μm; Fig.3A and B). In the presence of MRS-2500, EFS (10 Hz) evoked Ca2+ responses in nerve fibres with an average duration of 1727 ± 43.9 ms in comparison to control (1921 ± 70.34 ms; P = 0.03, n = 8; Fig.3C–F), but Ca2+ transients were not resolved in PDGFRα+ cells or SMCs in the presence of MRS-2500 (Fig.3E and F). MRS-2500 also abolished the reduction in Ca2+ levels during EFS in SMCs. These results suggest that post-junctional Ca2+ transients in PDGFRα+ cells and SMCs evoked by EFS were mediated by P2Y1 receptors.
Lack of Ca2+ responses to EFS in PDGFRα+ cells and SMCs from P2ry1(–/–) mice
Purinergic IJPs were shown previously to be absent in P2ry1(−/−) mice (Gallego et al. 2012; Hwang et al. 2012). To further test the significance of P2Y1 receptors in mediating post-junctional Ca2+ responses to EFS in colonic muscles and to verify the specificity of the pharmacological block of P2Y1 receptors, experiments were performed on PDGFRα+ cells from mice deficient in P2Y1 receptors. We bred the reporter strain (PDGFRαtm11(EGFP)Sor/J mice) with P2ry1(−/−) mice so the PDGFRα+ cells could be identified clearly in these experiments. Expression of SK3 channel proteins and the presence of PDGFRα+ cells in these mice were verified by immunohistochemistry (Fig.4Aa and Ad). As shown in Fig.4A, normal distributions and densities of PDGFRα+ cells were present in mice lacking functional P2Y1 receptors (e.g. average density was 422 ± 23 cells mm–2; n = 5).
Figure 4. Ca2+ responses in PDGFRα+ cells and SMCs evoked by EFS were absent in P2ry1(−/−) mice.
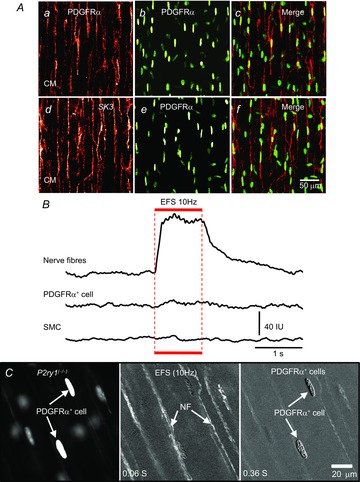
A, immunolabeling of whole mounts of colon from P2ry1(−/−) mice with PDGFRα (red, Aa) and SK3 (red, Ad) antibodies showed double labelling of PDGFRα+ cells (green eGFP nuclei, Ab, Ae: merged images are in Ac and Af). Scale bar in Af is 50 μm and pertains to all panels in A. Ca2+ transients evoked by EFS were absent in PDGFRα+ cells and SMCs in muscles of P2ry1(−/−) mice (B). The stimulus train (1 s) is denoted by the red bar and dotted line through the traces. Time sequence images demonstrate the absence of Ca2+ transients in PDGFRα+ cells and SMCs in muscles of P2ry1(−/−) mice (C). White arrowheads indicate PDGFRα+ cells or nerve fibres. Scale bar in C (right panel) is 20 μm and pertains to all panels in C.
PDGFRα+ cells of P2ry1(−/−) colonic muscles displayed fewer spontaneous Ca2+ transients than observed in cells of P2ry1(+/+) muscles (i.e. 16.2 ± 2.1% of spontaneous Ca2+ transients in P2ry1(−/−) cells occurred at an average of 4.8 ± 0.66 events min−1, P = 0.01; n = 6; Fig.1L).
EFS of muscles from P2ry1(−/−) mice elicited Ca2+ transients in nerve fibres with an average duration of 1766 ± 33.4 ms (n = 6; Fig.4B and Movie S2) but failed to evoke Ca2+ responses in PDGFRα+ cells or SMCs (Fig.4B and C). Time sequence images also demonstrated the lack of Ca2+ responses in PDGFRα+ cells and SMCs in P2ry1(−/−) colonic muscles (Fig.4C), thus confirming the importance of P2Y1 receptors in mediating post-junctional Ca2+ transients in PDGFRα+ cells and SMCs in purinergic neurotransmission.
Importance of P2Y1 receptors in IJPs
Intracellular microelectrode recordings were also performed in separate experiments to relate the temporal sequence of Ca2+ transients to the well-characterized electrophysiological response to purinergic neurotransmission. In the presence of l-NNA and atropine, EFS (one pulse and 5–20 Hz) evoked IJPs followed by post-stimulus depolarization responses, as previously described in several species (Fig.5A and C). IJPs averaged 29.5 ± 2 mV in amplitude (n = 6; Fig.5A and D) and 1832 ± 45.8 ms in duration in response to 10 Hz EFS (n = 6; Fig.6B). The latency from the initiation of EFS to the peak of the fIJP was 366 ± 14.3 ms at 10 Hz EFS (n = 6; Fig.6A). Pretreatment of muscles with MRS-2500 had no initial effect on membrane potential (i.e. −56 ± 1.7 mV in control vs. −57 ± 2.2 mV after addition of MRS-2500; n = 6; Fig.5A and B), but this compound blocked fIJPs at all frequencies below 20 Hz. A small component of hyperpolarization escaped block by MRS-2500 at 20 Hz (4.5 ± 1.3 mV, n = 6; Fig.5B and D).
Figure 5. Electrical responses (IJPs) to EFS.
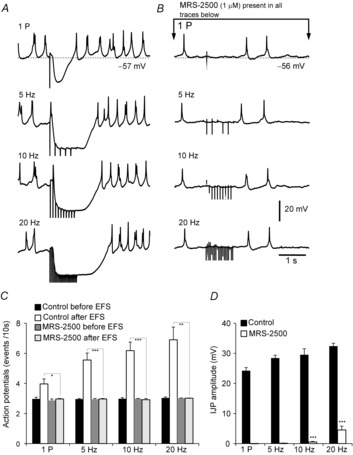
A, electrical activity recorded from intact colonic muscles in the presence of l-NNA (100 μm) and atropine (1 μm). EFS single pulse (1 P) and 5–20 Hz elicited IJPs, followed by post-stimulus excitation consisting of a train of action potentials (AP). Previous studies have described these responses as purinergic fast IJPs (fIJPs). B, MRS-2500 (1 μm) abolished fIJPs evoked by 1 P, 5 and 10 Hz stimuli. A small component persisted after MRS-2500 at 20 Hz (4.5 ± 1.2 mV, n = 6). C, summary of the average number of post-stimulus action potentials in controls and in the presence of MRS-2500 at different frequencies (i.e. one pulse and 5–20 Hz; each bar in the graph represents the average number of action potentials within 10 s in response to EFS). Note that the post-stimulus activation of action potentials was also inhibited by MRS-2500 (n = 6). D, summary of IJP amplitudes before and with MRS-2500 present (n = 6; each bar in the graph represents the average IJP amplitude).
Figure 6. Latencies of electrical responses in response to EFS correlated with the latencies of Ca2+ responses in PDGFRα+ cells.
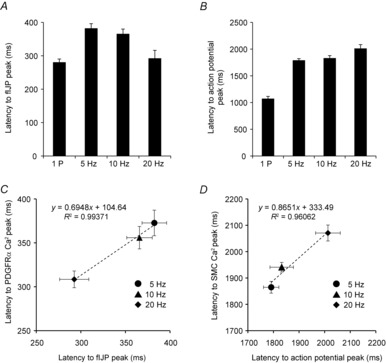
A, summary of the average latency from the onset of EFS to peak of fIJP (n = 6). B, summary of average latency from onset of EFS to first action potential peak during the post-stimulus excitation (n = 6). C, strong correlation was found between the average latency to the peaks of fIJPs and the average latency to the peaks of Ca2+ transients in PDGFRα+ cells over the range of EFS frequencies tested (5–20 Hz). Similarly, the average latency from the onset of EFS to the first action potential peak correlated with the average latency to the first SMC Ca2+ response over the range of EFS frequencies tested (5–20 Hz), indicating that action potentials were the source of the post-stimulus Ca2+ transients in SMCs (D).
A train of action potentials followed cessation of EFS (post-stimulation excitation), which has been described previously in GI muscles (Bennett, 1966; Wood & Brann, 1986; Ward et al. 1992) (Fig.5A). For example, before EFS the spontaneous action potential occurred at 3 ± 0.1 events 10 s−1, and this was increased significantly after EFS (10 Hz) to 6.2 ± 0.6 events 10 s−1 (P = 0.002, n = 6; Fig.5A and C). Post-stimulus excitation was also blocked by MRS-2500 and action potentials after EFS did not exceed the rate of spontaneous action potential generation (2.9 ± 0.08 events 10 s−1 at 10 Hz EFS, n = 6; Fig.5C).
The latencies from the onset of EFS (5–20 Hz) to the peaks of fIJPs and the peaks of the Ca2+ transients in PDGFRα+ cells were highly correlated (R2 = 0.99; Fig.6C). A strong correlation was also observed between the latency of the first post-stimulus action potential and the Ca2+ transients observed in SMCs after cessation of EFS (R2 = 0.96; Fig.6D). Taken together, these data demonstrate a consistent relationship between Ca2+ transients in PDGFRα+ cells and electrophysiological events in response to stimulation of motor neurons and show that PDGFRα+ cells are likely to mediate fIJPs in colonic muscles.
Expression of gap junctions in PDGFRα+ cells
In order for responses developed in PDGFRα+ cells to conduct to SMCs, some form of low resistance pathway(s) must connect these cells. Morphological studies have shown that PDGFRα+ cells are coupled to SMCs via gap junctions (Komuro et al. 1999; Horiguchi & Komuro, 2000; Fujita et al. 2003; Iino et al. 2009), but the nature and composition of gap junctions that form between these cells has not been investigated. Connexin (Cx) 40, 43 and 45 have been reported to be expressed in colonic muscles (Li et al. 1993; Mikkelsen et al. 1993; Nakamura et al. 1998; Seki & Komuro, 2001; Wang & Daniel, 2001), and more recently, human colon was shown to express Cx 32 and 26 (Kanczuga-Koda et al. 2004). We characterized the expression of gap junction genes in PDGFRα+ cells and SMCs using qPCR on extracts of cells purified by FACS and found higher expression of Gjb1 (Cx 32) and Gjb2 (Cx 26) in PDGFRα+ cells in comparison to unsorted cells (fold change = 2.8 ± 0.16, P = 0.0004; fold change = 2.1 ± 0.12, P = 0.001, respectively; Fig.7A). We also observed higher expression of Gja5 (Cx 40) in PDGFRα+ cells (fold change = 1.8 ± 0.12, P = 0.003; Fig.7A). Gja7 (Cx 45) expression was not significantly increased in PDGFRα+ cells (fold change = 1.1 ± 0.07, P = 0.16; Fig.7A). Gja1 (Cx 43) showed lower expression in PDGFRα+ cells in comparison to the population of unsorted cells (fold change = −4.5 ± 0.01, P = 0.001; Fig.7A).
Figure 7. Expression of gap junction transcripts in PDGFRα+ cells.
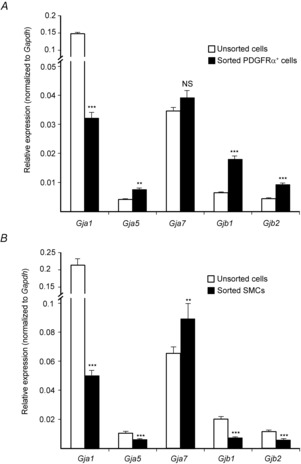
The relative expression of gap junction gene transcripts (Gja1, Gja5, Gja7, Gjb1, Gjb2) was compared in sorted PDGFRα+ cells (A), sorted SMCs (B) and unsorted cells (i.e. mixed cell population after enzymatic dispersions of distal colon muscles) by qPCR. A, PDGFRα+ cell expression of Cx 40 (Gja5), Cx 32 (Gjb1) and Cx 26 (Gjb2) were higher in PDGFRα+ cells in comparison to other cell types, although the highest transcript levels in PDGFRα+ cells were Cx 43 (Gja1) and Cx 45 (Gja7). B, transcript expression in sorted SMCs. Cx 45 (Gja7) and Cx 43 (Gja1) were also the most highly expressed gap junction genes in SMCs in comparison to other gap junction genes. The relative expression of each gene was normalized to the housekeeping gene, Gapdh.
Sorted SMCs showed higher expression of Gja7 (Cx 45) in comparison to unsorted cells (fold change = 1.4 ± 0.15, P = 0.008; Fig.7B) and significantly lower expression of other gap junctions: Gja1 (Cx 43) compared to unsorted cells (fold change = −4.2 ± 0.4, P = 0.0003; Fig.7B); Gja5 (Cx 40) compared to unsorted cells (fold change = −1.6 ± 0.16, P = 0.0001; Fig.7B); and Gjb1 (Cx 32) expression (fold change = −2.9 ± 0.2, P = 0.0001; Fig.7B). And a reduction in Gjb2 (Cx 26) expression was also observed (fold change = −2 ± 0.14, P = 0.0001 Fig.7B). It was also noted that the highest gap junction levels in PDGFRα+ cells and SMCs were Gja1 (Cx 43) and Gja7 (Cx 45), regardless of the ratio of expression to unsorted cells. These results suggest that PDGFRα+ cells and SMCs express several gap junction genes that may be involved in electrical coupling between these cells.
Gap junction blocking drugs blocked purinergic Ca2+ responses in SMCs
We examined the role of gap junctions in mediating the purinergic signalling in post-junctional cells with the gap junction inhibitors 18-β-glycyrrhetinic acid (18-β-GA) and octanol. Pretreatment of colonic muscles with 18-β-GA (40 μm; for 10–12 min in the presence of l-NNA and atropine) did not affect Ca2+ responses to EFS (10 Hz) in nerve fibres (duration of 1907 ± 83.2 ms, P = 0.54, n = 6; Fig.8C) or PDGFRα+ cells (duration of 1624 ± 106.6 ms, P = 0.85; latency from EFS 332 ± 29.6 ms, P = 0.45, n = 6; Fig.8C and D). In contrast, Ca2+ responses in SMCs were reduced in duration (to 483 ± 67.2 ms, P = 0.01, n = 6; Fig.8C) but no change in the latency to the peak of post-stimulus Ca2+ transients in SMCs was observed (latency from EFS 1938 ± 94.2 ms, P = 0.61, n = 6; Fig.8D). Higher concentrations of 18-β-GA (100 μm) blocked all Ca2+ responses to EFS in SMCs but had no effect on the duration of Ca2+ transients in nerve fibres (1809 ± 70.8 ms, P = 0.12, n = 6; Fig.8B and C) or PDGFRα+ cells (1475 ± 83.8 ms, P = 0.21, n = 6; Fig.8B and C) and no significant effects were noted in the latency between onset of EFS and the peaks of Ca2+ transients in PDGFRα+ cells (318 ± 24.9 ms, P = 0.26, n = 6; Fig.8D).
Figure 8. 18-β-glycyrrhetinic acid (18-β-GA) failed to block EFS-evoked responses in PDGFRα+ cells but blocked responses in SMCs.
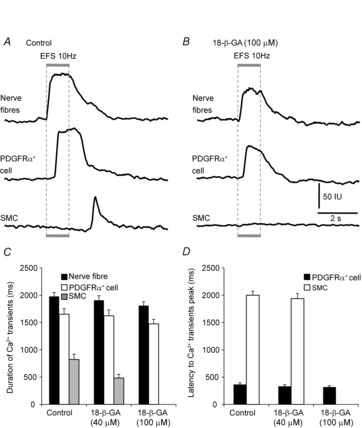
A, an example of Ca2+ transients activated by EFS (10 Hz) under control conditions (l-NNA and atropine present, n = 6). The stimulus train (1 s) is denoted by the grey box and dotted lines through the trace. EFS evoked Ca2+ transients in PDGFRα+ cells with a short latency after onset of EFS and in SMCs after cessation of stimulation. 18-β-GA (100 μm) blocked Ca2+ responses evoked by EFS in SMCs but did not affect the responses in PDGFRα+ cells significantly (B). C, summary of the duration of Ca2+ transients in nerve fibre bundles (black bars), PDGFRα+ cells (white bars) and SMCs (grey bars) before and after addition of 18-β-GA (40 and 100 μm). D, summary graph of the average latency in Ca2+ responses in PDGFRα+ cells and SMCs after the onset of EFS to the first Ca2+ transient peak before and after the addition of 18-β-GA (40 and 100 μm). Little change was noted in the latencies in nerve fibres and PDGFRα+ cells after 18-β-GA (100 μm), but responses were blocked in SMCs in the presence of 100 μm 18-β-GA.
A second gap junction blocking drug, octanol, was tested on post-junctional responses to EFS. Octanol (300 μm) caused a small, but significant, reduction in the Ca2+ responses evoked in nerve fibres by EFS (10 Hz) (from a control duration of 2009 ± 44.4 ms to 1867 ± 42.7 ms in the presence of octanol; P = 0.04, n = 6; Fig.9C) and a reduction in PDGFRα+ cells (reduced from control duration of 1671 ± 101.76 ms to 1276 ± 65.98 ms; P = 0.008, n = 6; Fig.9C). Responses of SMCs to EFS were also reduced by octanol (300 μm) (from a control duration of 897 ± 81.9 ms to 537 ± 60.6 ms; P = 0.005, n = 6; Fig.9C). Octanol (300 μm) had no significant effect on the latencies between the onset of EFS and peak Ca2+ transients in PDGFRα+ cells or SMCs (n = 6; Fig.9D). Higher concentrations of octanol (700 μm) blocked the Ca2+ transients in SMCs to EFS, but also had significant inhibitory effects on the durations of Ca2+ transients in nerve fibres (1633 ± 83.8 ms, P = 0.01, n = 6; Fig.9B and C) and PDGFRα+ cells (1326 ± 124.4 ms, P = 0.02, n = 6; Fig.9B and C), although the drug had no effect on latencies between the onset of EFS and the peaks of Ca2+ transients in PDGFRα+ cells (404.3 ± 29.9 ms, P = 0.46, n = 6; Fig.9D). While octanol appeared to have some non-specific effects on pre-junctional responses in enteric neurons, its effects on post-junctional cells were consistent with the effects of 18-β-GA.
Figure 9. Octanol inhibited Ca2+ transients evoked by EFS in SMCs.
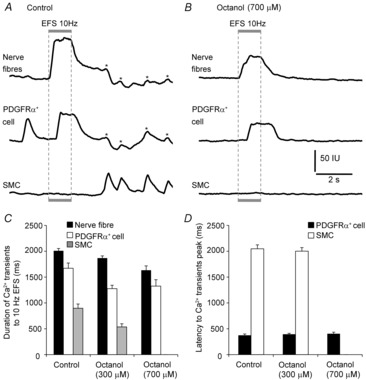
A and B, inhibition of Ca2+ transients of SMCs by the gap junction uncoupler, octanol (700 μm). A, Ca2+ transients evoked in neural processes, PDGFRα+ cells and SMCs in response to EFS (10 Hz, 1 s) under control conditions (l-NNA and atropine present, n = 6). The stimulus train is denoted by the grey box and dotted lines through the trace. B, octanol (700 μm) abolished the Ca2+ responses to EFS in SMCs. Note that octanol (700 μm) also somewhat reduced the duration of responses in nerve processes and PDGFRα+ cells. C, summary graph of the average duration of each nerve fibre bundle (black bars), PDGFRα+ cells (white bars) and SMCs (grey bars) before and after the addition of octanol (300 and 700 μm). D, summary graph of the average latency of Ca2+ responses in PDGFRα+ cells and SMCs (from onset of EFS to the peak of the first Ca2+ transient) before and after addition of octanol (300 and 700 μm). Asterisks denote a signal bleedthrough artifact.
Gap junction blocking drugs inhibited the conduction of purinergic electrical responses to SMCs
We also recorded electrophysiological responses of colonic muscles to EFS before and after addition of gap junction blockers. 18-β-GA (40 μm) caused a slight depolarization of cells that did not reach statistical significance (from −53 ± 2.2 to −49.5 ± 2.5 mV within 10–12 min after adding 18-β-GA; P = 0.29, n = 6; Fig.10A). In the presence of 18-β-GA (40 μm) EFS (5, 10 and 20 Hz) evoked IJPs that were significantly reduced in amplitude (e.g. IJPs at 10 Hz were 29.6 ± 0.8 mV in amplitude under control conditions and 26.9 ± 0.72 mV after 18-β-GA; P = 0.01, n = 6; Fig.10C). No significant change was noted in IJP amplitudes with one pulse of EFS (24.7 ± 1 mV, P = 0.25). 18-β-GA (40 μm) had no significant effect on the latency of IJP parameters. For example, at 10 Hz EFS the latency between EFS and fIJP was 401 ± 16 ms compared to control value of 363 ± 16.7 ms (P = 0.14, n = 6) and the latency between EFS and rebound peak was 1963 ± 53.4 ms compared to control value of 1854 ± 63.7 ms (P = 0.22, n = 6). However, in the presence of 18-β-GA (40 μm) post-stimulus action potentials were decreased at all frequencies of EFS tested (i.e. at 10 Hz action potentials were 4.7 ± 0.46 events 10 s−1 compared to control value of 6.4 ± 0.44 events 10 s−1, n = 6, P = 0.02; Fig.10E). Pretreatment of colonic muscles with 18-β-GA (100 μm) abolished fIJPs and post-stimulus action potentials (Fig.10A). Membrane depolarization was also observed with this concentration of 18-β-GA (i.e. to −44 ± 1.6 mV, P = 0.001).
Figure 10. Gap junction uncouplers 18-β-GA and octanol inhibited IJPs in response to EFS.
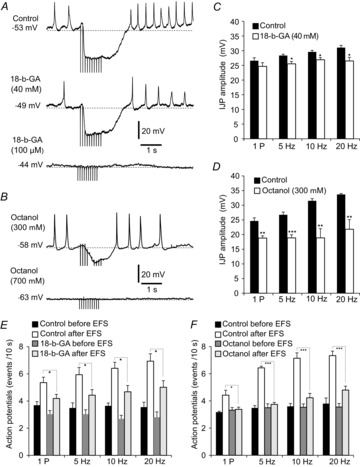
A, representative electrical response to EFS (10 Hz, 1 s). IJPs were abolished by 18-β-GA (100 μm) and octanol (700 μm) B, summary of average IJP amplitudes under control conditions (l-NNA and atropine present) and in the presence of 18-β-GA (40 μm) (C) and octanol (700 μm) (D). Note that IJP amplitude was reduced at all frequencies tested, even with the lower concentrations of both drugs, except for the response to the 1 P stimulus in the presence of 18-β-GA (n = 6). Higher concentrations of both uncouplers blocked IJPs. E, summary of the average number of action potentials before and after EFS in control and in the presence of 18-β-GA (40 μm). Note the marked decrease in post-stimulus action potentials in the presence of 18-β-GA (40 μm; each bar in the graph represents the average number of action potentials within 10 s after EFS). F, summary of the average number of action potentials in control and in the presence of octanol (300 μm). Note the marked decrease in the action potentials after cessation of EFS in the presence of octanol (300 μm) (each bar in the graph represents the average number of action potentials within 10 s before and after EFS).
Octanol (300 μm) caused slight hyperpolarization, but this effect did not reach statistical significance (−58 ± 1.3 mV compared to control value of −55 ± 1.7 mV, P = 0.16, n = 6; Fig.10B). In the presence of octanol (300 μm) IJPs were reduced in amplitude at all frequencies tested (e.g. 18.7 ± 3.1 mV at 10 Hz EFS compared to control value of 31.5 ± 1.8 mV, P = 0.005, n = 6; Fig.10D). Octanol (300 μm) had no significant effect on the latency of IJPs. For example, at 10 Hz EFS the latency between EFS and fIJPs averaged 397 ± 45.1 ms, compared to control value of 376 ± 28.3 ms (P = 0.71, n = 6), and the latency between EFS and the post stimulus rebound response was 1894 ± 59.7 ms, compared to control value of 1783 ± 67.1 ms (P = 0.24, n = 6). In the presence of octanol (300 μm) there was a marked decrease in post-stimulus action potentials after cessation of EFS at all frequencies tested (e.g. at 10 Hz EFS action potentials averaged 4.2 ± 0.32 events 10 s−1 compared to control value of 7.1 ± 0.4 events 10 s−1; n = 6, P = 0.0002; Fig.10F). Pretreatment of muscles with higher concentrations of octanol (700 μm) abolished fIJPs and post-stimulus action potentials (Fig.10B), and it should be noted that hyperpolarization was also observed with this concentration of octanol (−63 ± 1.9 mV, P = 0.01; Fig.10B).
Discussion
This study provides evidence that PDGFRα+-IM cells in colonic muscles are innervated by enteric inhibitory motor neurons. PDGFRα+-IM cells were responsive to exogenous purines and the responses were blocked by MRS-2500. With cholinergic and nitrergic components of responses blocked, EFS evoked Ca2+ transients in post-junctional cells (PDGFRα+-IM cells and SMCs). Post-junctional responses were abolished by MRS-2500 and not observed in muscles with genetic deactivation of P2Y1 receptors. Electrical responses (IJPs) showed similar time courses to the Ca2+ transients elicited by EFS. Drugs known to inhibit gap junctions blocked post-junctional responses to EFS in SMCs, but did not block responses in intramuscular nerve processes or PDGFRα+-IM cells. These data support the hypothesis that purinergic neurotransmission is transduced by PDGFRα+-IM cells and conducts to SMCs via gap junctions. The study shows the first direct evidence for serial activation of post-junctional cells during purinergic neurotransmission.
PDGFRα+ cells are abundant in the distal colon, and the cells within muscle bundles (PDGFRα+-IM cells) lie in close proximity to varicose processes of motor neurons (Kurahashi et al. 2011, 2012; Blair et al. 2012). This morphology occurs throughout various regions of the GI tracts of all mammalian species studied, including humans, as determined by light and electron microscopy (Komuro et al. 1999; Fujita et al. 2003; Iino et al. 2009; Grover et al. 2012). PDGFRα+ cells also possess the molecular apparatus for mediating purinergic signalling. Exogenous purines elicit Ca2+ transients in PDGFRα+ cells of the gastric fundus, and cells from the fundus and colon express P2Y1 receptors and SK3 channels that are the basis for purinergic IJPs (Mutafova-Yambolieva et al. 2007; Kurahashi et al. 2011; Baker et al. 2013; Peri et al. 2013). The present study unites morphological and physiological observations by showing that PDGFRα+-IM cells are innervated, respond directly to neurotransmitters released from enteric motor neurons and conduct responses to SMCs.
PDGFRα+-IM cells displayed Ca2+ transients spontaneously and these events were attenuated, but not blocked, by TTX. This suggests that PDGFRα+ cells contribute to setting resting smooth muscle excitability through ongoing inhibitory neurotransmission and by intrinsic generation of spontaneous transients outward currents (STOCs). This activity is likely to contribute to tonic inhibition, a basic behaviour in GI motility (Wood, 1972; Waterman & Costa, 1994; Spencer et al. 1998a). PDGFRα+ cells have robust expression of SK3 channels that are activated by cytoplasmic Ca2+ and blocked by apamin (Kurahashi et al. 2011). The spontaneous Ca2+ transients in PDGFRα+ cells were increased by exogenous purines. Ca2+ transients occur in a stochastic manner, and are dependent upon release of Ca2+ from internal stores via inositol trisphosphate (IP3) and ryanodine receptors (Baker et al. 2013; Tamada & Hashitani, 2014). The Ca2+ transients are asynchronous cell to cell, and are likely to cause STOCs in single PDGFRα+ cells and spontaneous transient hyperpolarizations (STHs) in intact muscles (Kito et al. 2014). Ca2+ transients in PDGFRα+-IM cells appear to mediate the spontaneous IJPs in colonic muscles, reported previously, as these events were also sensitive to TTX and apamin (Spencer et al. 1998b; Gil et al. 2010). Summation of spontaneous IJPs and intrinsic STOCs in PDGFRα+-IM cells would provide a net hyperpolarizing influence on the smooth muscle and temper basal contractile activity (i.e. a source of tonic inhibition).
P2Y1 receptors mediate purinergic neurotransmission in the gut (Giaroni et al. 2002; Gallego et al. 2006; Grasa et al. 2009; Zhang et al. 2010). Binding of purines to P2Y1 receptors couples to activation of SK channels and generation of fIJPs (Gallego et al. 2006; Grasa et al. 2009; Hwang et al. 2012). We confirmed that fIJPs are blocked by the selective P2Y1 blocker MRS-2500 and also demonstrated that Ca2+ transients activated by neurotransmitters were blocked by MRS-2500 and absent in P2ry1(−/−) mice. Note that Ca2+ transients activated by exogenous ATP, ADP and UTP were attenuated but not fully inhibited by MRS-2500, suggesting that PDGFRα+ cells express purine receptors in addition to P2Y1. P2Y2 receptors are equally sensitive to ATP and UTP (Velazquez et al. 2000), and expression of P2Y2 receptors by PDGFRα+ cells has been reported (Peri et al. 2013). MRS-2500 attenuated half of the UTP responses in the PDGFRα+ cells and this antagonism may attribute to a cross-talk between P2Y2 and P2Y1 receptors through phospholipase C (PLC) pathways (Werry et al. 2003; Baranska et al. 2004). The effects of ADP remaining after MRS-2500 might be mediated by P2Y12 receptors that are also expressed in PDGFRα+ cells (Peri et al. 2013). Binding of P2Y12 receptors might enhance Ca2+ mobilization through IP3 receptors by inhibition of protein kinase A (van der Meijden et al. 2008).
β-NAD, a purinergic neurotransmitter candidate, also elicited Ca2+ responses in PDGFRα+ cells, and these responses were blocked by MRS-2500 (Mutafova-Yambolieva et al. 2007; Hwang et al. 2012). A recent study demonstrated differential expression of enzymes involved in purine catabolism in cells within the tunica muscularis (Peri et al. 2013). For example, ectoenzymes Cd38 and Enpp1 are highly expressed in PDGFRα+ cells in comparison to SMCs and interstitial cells of Cajal (ICC). Cd38 is a primary enzyme capable of NAD+ hydrolysis (De Flora et al. 2004). Thus, close apposition of neurotransmitter release sites to PDGFRα+ cells and focalization of mechanisms to deactivate neurotransmitters close to sites of release may limit the post-junctional volume in which effective neurotransmitter concentrations are achieved.
This study measured responses and latencies of the responses of PDGFRα+ cells and SMCs to EFS of intrinsic motor neurons. Cholinergic and nitrergic neurotransmission were blocked to focus on responses to purinergic neurotransmission. Ca2+ transients were increased in PDGFRα+ cells by purinergic neurotransmission, and this response slightly preceded the occurrence of an fIJP. Such a Ca2+ response is consistent with activation of SK channels, which are responsible for fIJPs. Shortly after initiation of Ca2+ transients in PDGFRα+ cells, basal Ca2+ was reduced in SMCs. With the resolution of Ca2+ events in this study, an initial rise in Ca2+ was never evoked in SMCs by EFS. SMCs have low levels of SK channel expression and much lower current density attributable to SK channels than PDGFRα+ cells (Mutafova-Yambolieva et al. 2007; Kurahashi et al. 2011; Peri et al. 2013), but without a rise in Ca2+ in SMCs with kinetics similar to the kinetics of the fIJP, there is no mechanism to activate the SK channels that might be available in SMCs. The sustained drop in Ca2+ observed in SMCs during purinergic nerve stimulation is consistent with the idea that hyperpolarization responses developed in PDGFRα+ cells conducted to SMCs and reduced Ca2+ influx by reducing openings of voltage-dependent Ca2+ channels. Decreased Ca2+ in SMCs would be expected to cause relaxation, which is the well-known response to purinergic inhibitory neurotransmission in GI muscles.
Clearly electrical connectivity between PDGFRα+ cells and SMCs must exist if activation of SK3 channels in PDGFRα+ cells is capable of eliciting hyperpolarization in SMCs. Ultrastructural studies have reported gap junctions between PDGFRα+ cells and SMCs (Komuro et al. 1999; Fujita et al. 2003), and multiple gap junction proteins and transcripts, including Cx 40, 43, 45, 26 and 32, are expressed in GI smooth muscle tissues (Li et al. 1993; Mikkelsen et al. 1993; Nakamura et al. 1998; Seki & Komuro, 2001; Wang & Daniel, 2001; Kanczuga-Koda et al. 2004). All these studies reported results from whole muscles in which many cell types exist. We found a number of gap junction genes expressed in PDGFRα+ cells and SMCs. The variety of gap junctions possible between PDGFRα+ cells and SMCs from the genes expressed makes it difficult to probe the nature of electrical coupling between these cells using genetic knockouts, so the role of electrical coupling was tested with chemicals known to uncouple gap junctions. These compounds often have non-specific effects, so two chemicals were chosen such that results could be compared. Both compounds inhibited Ca2+ and electrical responses in SMCs, but responses were retained in neurons and PDGFRα+ cells. There appeared to be pre-junctional effects with octanol in enteric neurons, but this problem was less significant with 18-β-GA. The important observations were that the timing of events were not significantly altered and the occurrence (or lack of occurrence in SMCs) of events did not appear to result from depolarization or hyperpolarization of membrane potential or blockade of neurotransmission between enteric nerves and PDGFRα+ cells. The fact that responses were retained in nerves and PDGFRα+ cells in the presence of gap junction inhibitors is consistent with the following concept of purinergic neurotransmission: propagation of electrical signals in neurons, Ca2+ influx into nerve processes, release of neurotransmitter, binding of P2Y1 receptors expressed by PDGFRα+ cells and activation of Ca2+ release in these cells. Gap junctions are not involved in any of these steps, and therefore gap junction blockers did not block these events. Our findings support the hypothesis that post-junctional responses (IJPs) develop in PDGFRα+ cells and conduct to SMCs via gap junctions. Thus, responses in SMCs do not appear to result from direct binding of smooth muscle receptors by purine neurotransmitters.
In summary, this study demonstrates direct functional innervation of PDGFRα+ cells by purinergic enteric inhibitory neurons in colonic muscles. Morphological studies predicted there might be communications between motor neurons and PDGFRα+ cells, but this is the first report showing functional innervation of these cells. Ca2+ transients activated in PDGFRα+ cells are a requisite for the activation of SK channels, a signature of purinergic neurotransmission in GI muscles. Ca2+ transients were observed to occur spontaneously, which might provide part of the ‘tonic inhibition’ imposed on colonic muscles to help maintain the phasic nature of contractions. The number and amplitude of Ca2+ transients were increased by exogenous purines and by purinergic neurotransmitter(s) released from inhibitory motor neurons. This study supports targeted neurotransmission, specialization of post-junctional cells in transducing inputs from motor neurons in GI muscles and a primary role for PDGFRα+ cells in mediating enteric inhibitory neurotransmission in the colon.
Acknowledgments
We thank Yulia Bayguinov for immunohistochemistry, Lauren Peri for molecular expression studies, Byoung Koh for collecting cells by FACS, and Nancy Horowitz for maintenance and breeding of mice.
Glossary
- 18-β-GA
18- β-glycyrrhetinic acid
- Cx
connexin
- eGFP
enhanced green fluorescent protein
- FACS
fluorescence activated cell sorting
- GI
gastrointestinal
- IJP
inhibitory junction potential
- IP3
inositol trisphosphate
- KRB
Krebs Ringer bicarbonate
- l-NNA
Nω-nitro-L-arginine
- PDGFRα
platelet derived growth factor receptor α
- P2Y1
purinergic receptor subtype
- qPCR
quantitative PCR
- SK
small conductance Ca2+-activated K+
- SMCs
smooth muscle cells
- STOC
spontaneous transients outward current
Additional information
Competing interests
None
Author contributions
Conception and design of the experiments: S.A.B., K.M.S. Collection, analysis and interpretation of data: S.A.B., G.W.H., S.M.W., K.M.S. Drafting the article or revising it critically for important intellectual content: S.A.B., G.W.H., S.M.W., K.M.S. All authors read and approved the manuscript for submission.
Funding
A grant from NIDDK (R01 DK-091336) funded this study, and support from Core Laboratories, funded by P01-DK41315, was also provided.
Supporting Information
The following supporting information is available in the online version of this article.
Disclaimer: Supporting information has been peer-reviewed but not copyedited.
. PDGFRα+ cell Ca2+ responses to nerve stimulation.
Movie S2. Ca2+ transients of PDGFRα+ cells are absent in P2ry1(−/−) mice.
References
- Baker SA, Hennig GW, Salter AK, Kurahashi M, Ward SM. Sanders KM. Distribution and Ca2+ signalling of fibroblast-like (PDGFR+) cells in the murine gastric fundus. J Physiol. 2013;591:6193–6208. doi: 10.1113/jphysiol.2013.264747. [DOI] [PMC free article] [PubMed] [Google Scholar]
- Banks BE, Brown C, Burgess GM, Burnstock G, Claret M, Cocks TM. Jenkinson DH. Apamin blocks certain neurotransmitter-induced increases in potassium permeability. Nature. 1979;282:415–417. doi: 10.1038/282415a0. [DOI] [PubMed] [Google Scholar]
- Baranska J, Czajkowski R. Sabala P. Cross-talks between nucleotide receptor-induced signaling pathways in serum-deprived and non-starved glioma C6 cells. Adv Enzyme Regul. 2004;44:219–232. doi: 10.1016/j.advenzreg.2003.11.001. [DOI] [PubMed] [Google Scholar]
- Bennett MR. Transmission from intramural excitatory nerves to the smooth muscle cells of the guinea-pig taenia coli. J Physiol. 1966;185:132–147. doi: 10.1113/jphysiol.1966.sp007976. [DOI] [PMC free article] [PubMed] [Google Scholar]
- Bitar KN, Said SI, Weir GC, Saffouri B. Makhlouf GM. Neural release of vasoactive intestinal peptide from the gut. Gastroenterology. 1980;79:1288–1294. [PubMed] [Google Scholar]
- Blair PJ, Bayguinov Y, Sanders KM. Ward SM. Relationship between enteric neurons and interstitial cells in the primate gastrointestinal tract. Neurogastroenterol Motil. 2012;24:e437–449. doi: 10.1111/j.1365-2982.2012.01975.x. [DOI] [PMC free article] [PubMed] [Google Scholar]
- Bult H, Boeckxstaens GE, Pelckmans PA, Jordaens FH, Van Maercke YM. Herman AG. Nitric oxide as an inhibitory non-adrenergic non-cholinergic neurotransmitter. Nature. 1990;345:346–347. doi: 10.1038/345346a0. [DOI] [PubMed] [Google Scholar]
- Burnstock G, Campbell G, Bennett M. Holman ME. Inhibition of the smooth muscle on the taenia coli. Nature. 1963;200:581–582. doi: 10.1038/200581a0. [DOI] [PubMed] [Google Scholar]
- Burnstock G, Campbell G, Satchell D. Smythe A. Evidence that adenosine triphosphate or a related nucleotide is the transmitter substance released by non-adrenergic inhibitory nerves in the gut. Br J Pharmacol. 1970;40:668–688. doi: 10.1111/j.1476-5381.1970.tb10646.x. [DOI] [PMC free article] [PubMed] [Google Scholar]
- Cobine CA, Hennig GW, Kurahashi M, Sanders KM, Ward SM. Keef KD. Relationship between interstitial cells of Cajal, fibroblast-like cells and inhibitory motor nerves in the internal anal sphincter. Cell Tissue Res. 2011;344:17–30. doi: 10.1007/s00441-011-1138-1. [DOI] [PMC free article] [PubMed] [Google Scholar]
- Crist JR, He XD. Goyal RK. Both ATP and the peptide VIP are inhibitory neurotransmitters in guinea-pig ileum circular muscle. J Physiol. 1992;447:119–131. doi: 10.1113/jphysiol.1992.sp018994. [DOI] [PMC free article] [PubMed] [Google Scholar]
- Dalziel HH, Thornbury KD, Ward SM. Sanders KM. Involvement of nitric oxide synthetic pathway in inhibitory junction potentials in canine proximal colon. Am J Physiol. 1991;260:G789–792. doi: 10.1152/ajpgi.1991.260.5.G789. [DOI] [PubMed] [Google Scholar]
- De Flora A, Zocchi E, Guida L, Franco L. Bruzzone S. Autocrine and paracrine calcium signaling by the CD38/NAD+/cyclic ADP-ribose system. Ann N Y Acad Sci. 2004;1028:176–191. doi: 10.1196/annals.1322.021. [DOI] [PubMed] [Google Scholar]
- Fujita A, Takeuchi T, Jun H. Hata F. Localization of Ca2+-activated K+ channel, SK3, in fibroblast-like cells forming gap junctions with smooth muscle cells in the mouse small intestine. J Pharmacol Sci. 2003;92:35–42. doi: 10.1254/jphs.92.35. [DOI] [PubMed] [Google Scholar]
- Gallego D, Gil V, Martinez-Cutillas M, Mane N, Martin MT. Jimenez M. Purinergic neuromuscular transmission is absent in the colon of P2Y(1) knocked out mice. J Physiol. 2012;590:1943–1956. doi: 10.1113/jphysiol.2011.224345. [DOI] [PMC free article] [PubMed] [Google Scholar]
- Gallego D, Hernandez P, Clave P. Jimenez M. P2Y1 receptors mediate inhibitory purinergic neuromuscular transmission in the human colon. Am J Physiol Gastrointest Liver Physiol. 2006;291:G584–594. doi: 10.1152/ajpgi.00474.2005. [DOI] [PubMed] [Google Scholar]
- Giaroni C, Knight GE, Ruan HZ, Glass R, Bardini M, Lecchini S, Frigo G. Burnstock G. P2 receptors in the murine gastrointestinal tract. Neuropharmacology. 2002;43:1313–1323. doi: 10.1016/s0028-3908(02)00294-0. [DOI] [PubMed] [Google Scholar]
- Gil V, Gallego D, Grasa L, Martin MT. Jimenez M. Purinergic and nitrergic neuromuscular transmission mediates spontaneous neuronal activity in the rat colon. Am J Physiol Gastrointest Liver Physiol. 2010;299:G158–169. doi: 10.1152/ajpgi.00448.2009. [DOI] [PubMed] [Google Scholar]
- Grasa L, Gil V, Gallego D, Martin MT. Jimenez M. P2Y(1) receptors mediate inhibitory neuromuscular transmission in the rat colon. Br J Pharmacol. 2009;158:1641–1652. doi: 10.1111/j.1476-5381.2009.00454.x. [DOI] [PMC free article] [PubMed] [Google Scholar]
- Grider JR, Katsoulis S, Schmidt WE. Jin JG. Regulation of the descending relaxation phase of intestinal peristalsis by PACAP. J Auton Nerv Syst. 1994;50:151–159. doi: 10.1016/0165-1838(94)90005-1. [DOI] [PubMed] [Google Scholar]
- Grover M, Bernard CE, Pasricha PJ, Parkman HP, Abell TL, Nguyen LA, Snape W, Shen KR, Sarr M, Swain J, Kendrick M, Gibbons S, Ordog T. Farrugia G. Platelet-derived growth factor receptor alpha (PDGFRα)-expressing "fibroblast-like cells" in diabetic and idiopathic gastroparesis of humans. Neurogastroenterol Motil. 2012;24:844–852. doi: 10.1111/j.1365-2982.2012.01944.x. [DOI] [PMC free article] [PubMed] [Google Scholar]
- Horiguchi K. Komuro T. Ultrastructural observations of fibroblast-like cells forming gap junctions in the W/W(nu) mouse small intestine. J Auton Nerv Syst. 2000;80:142–147. doi: 10.1016/s0165-1838(00)00089-8. [DOI] [PubMed] [Google Scholar]
- Hwang SJ, Blair PJ, Durnin L, Mutafova-Yambolieva V, Sanders KM. Ward SM. P2Y1 purinoreceptors are fundamental to inhibitory motor control of murine colonic excitability and transit. J Physiol. 2012;590:1957–1972. doi: 10.1113/jphysiol.2011.224634. [DOI] [PMC free article] [PubMed] [Google Scholar]
- Iino S, Horiguchi K, Horiguchi S. Nojyo Y. c-Kit-negative fibroblast-like cells express platelet-derived growth factor receptor alpha in the murine gastrointestinal musculature. Histochem Cell Biol. 2009;131:691–702. doi: 10.1007/s00418-009-0580-6. [DOI] [PubMed] [Google Scholar]
- Iino S. Nojyo Y. Immunohistochemical demonstration of c-Kit-negative fibroblast-like cells in murine gastrointestinal musculature. Arch Histol Cytol. 2009;72:107–115. doi: 10.1679/aohc.72.107. [DOI] [PubMed] [Google Scholar]
- Kanczuga-Koda L, Sulkowski S, Koda M, Sobaniec-Lotowska M. Sulkowska M. Expression of connexins 26, 32 and 43 in the human colon – an immunohistochemical study. Folia Histochem Cytobiol. 2004;42:203–207. [PubMed] [Google Scholar]
- Keef KD, Du C, Ward SM, McGregor B. Sanders KM. Enteric inhibitory neural regulation of human colonic circular muscle: role of nitric oxide. Gastroenterology. 1993;105:1009–1016. doi: 10.1016/0016-5085(93)90943-7. [DOI] [PubMed] [Google Scholar]
- Keef KD, Saxton SN, McDowall RA, Kaminski RE, Duffy AM. Cobine CA. Functional role of vasoactive intestinal polypeptide in inhibitory motor innervation in the mouse internal anal sphincter. J Physiol. 2013;591:1489–1506. doi: 10.1113/jphysiol.2012.247684. [DOI] [PMC free article] [PubMed] [Google Scholar]
- Kito Y, Kurahashi M, Mitsui R, Ward SM. Sanders KM. Spontaneous transient hyperpolarizations in the rabbit small intestine. J Physiol. 2014;592:4733–4745. doi: 10.1113/jphysiol.2014.276337. [DOI] [PMC free article] [PubMed] [Google Scholar]
- Komuro T, Seki K. Horiguchi K. Ultrastructural characterization of the interstitial cells of Cajal. Arch Histol Cytol. 1999;62:295–316. doi: 10.1679/aohc.62.295. [DOI] [PubMed] [Google Scholar]
- Kurahashi M, Nakano Y, Hennig GW, Ward SM. Sanders KM. Platelet-derived growth factor receptor α-positive cells in the tunica muscularis of human colon. J Cell Mol Med. 2012;16:1397–1404. doi: 10.1111/j.1582-4934.2011.01510.x. [DOI] [PMC free article] [PubMed] [Google Scholar]
- Kurahashi M, Zheng H, Dwyer L, Ward SM, Don Koh S. Sanders KM. A functional role for the ‘fibroblast-like cells’ in gastrointestinal smooth muscles. J Physiol. 2011;589:697–710. doi: 10.1113/jphysiol.2010.201129. [DOI] [PMC free article] [PubMed] [Google Scholar]
- Lee H, Koh BH, Peri LE, Sanders KM. Koh SD. Functional expression of SK channels in murine detrusor PDGFR+ cells. J Physiol. 2013;591:503–513. doi: 10.1113/jphysiol.2012.241505. [DOI] [PMC free article] [PubMed] [Google Scholar]
- Li Z, Zhou Z. Daniel EE. Expression of gap junction connexin 43 and connexin 43 mRNA in different regional tissues of intestine in dog. Am J Physiol. 1993;265:G911–916. doi: 10.1152/ajpgi.1993.265.5.G911. [DOI] [PubMed] [Google Scholar]
- Mikkelsen HB, Huizinga JD, Thuneberg L. Rumessen JJ. Immunohistochemical localization of a gap junction protein (connexin43) in the muscularis externa of murine, canine, and human intestine. Cell Tissue Res. 1993;274:249–256. doi: 10.1007/BF00318744. [DOI] [PubMed] [Google Scholar]
- Mutafova-Yambolieva VN, Hwang SJ, Hao X, Chen H, Zhu MX, Wood JD, Ward SM. Sanders KM. β-Nicotinamide adenine dinucleotide is an inhibitory neurotransmitter in visceral smooth muscle. Proc Natl Acad Sci USA. 2007;104:16359–16364. doi: 10.1073/pnas.0705510104. [DOI] [PMC free article] [PubMed] [Google Scholar]
- Nakamura K, Kuraoka A, Kawabuchi M. Shibata Y. Specific localization of gap junction protein, connexin45, in the deep muscular plexus of dog and rat small intestine. Cell Tissue Res. 1998;292:487–494. doi: 10.1007/s004410051077. [DOI] [PubMed] [Google Scholar]
- Peri LE, Sanders KM. Mutafova-Yambolieva VN. Differential expression of genes related to purinergic signaling in smooth muscle cells, PDGFRα-positive cells, and interstitial cells of Cajal in the murine colon. Neurogastroenterol Motil. 2013;25:e609–620. doi: 10.1111/nmo.12174. [DOI] [PMC free article] [PubMed] [Google Scholar]
- Seki K. Komuro T. Immunocytochemical demonstration of the gap junction proteins connexin 43 and connexin 45 in the musculature of the rat small intestine. Cell Tissue Res. 2001;306:417–422. doi: 10.1007/s00441-001-0470-2. [DOI] [PubMed] [Google Scholar]
- Spencer NJ, Bywater RA, Holman ME. Taylor GS. Inhibitory neurotransmission in the circular muscle layer of mouse colon. J Auton Nerv Syst. 1998a;70:10–14. doi: 10.1016/s0165-1838(98)00045-9. [DOI] [PubMed] [Google Scholar]
- Spencer NJ, Bywater RA, Holman ME. Taylor GS. Spontaneous and evoked inhibitory junction potentials in the circular muscle layer of mouse colon. J Auton Nerv Syst. 1998b;69:115–121. doi: 10.1016/s0165-1838(98)00012-5. [DOI] [PubMed] [Google Scholar]
- Spencer NJ. Smith TK. Simultaneous intracellular recordings from longitudinal and circular muscle during the peristaltic reflex in guinea-pig distal colon. J. Physiol. 2001;533:787–799. doi: 10.1111/j.1469-7793.2001.00787.x. [DOI] [PMC free article] [PubMed] [Google Scholar]
- Stark ME, Bauer AJ. Szurszewski JH. Effect of nitric oxide on circular muscle of the canine small intestine. J Physiol. 1991;444:743–761. doi: 10.1113/jphysiol.1991.sp018904. [DOI] [PMC free article] [PubMed] [Google Scholar]
- Tamada H. Hashitani H. Calcium responses in subserosal interstitial cells of the guinea-pig proximal colon. Neurogastroenterol Motil. 2014;26:115–123. doi: 10.1111/nmo.12240. [DOI] [PubMed] [Google Scholar]
- van der Meijden PE, Schoenwaelder SM, Feijge MA, Cosemans JM, Munnix IC, Wetzker R, Heller R, Jackson SP. Heemskerk JW. Dual P2Y 12 receptor signaling in thrombin-stimulated platelets–involvement of phosphoinositide 3-kinase β but not γ isoform in Ca2+ mobilization and procoagulant activity. FEBS J. 2008;275:371–385. doi: 10.1111/j.1742-4658.2007.06207.x. [DOI] [PubMed] [Google Scholar]
- Velazquez B, Garrad RC, Weisman GA. Gonzalez FA. Differential agonist-induced desensitization of P2Y2 nucleotide receptors by ATP and UTP. Mol Cell Biochem. 2000;206:75–89. doi: 10.1023/a:1007091127392. [DOI] [PubMed] [Google Scholar]
- Wang YF. Daniel EE. Gap junctions in gastrointestinal muscle contain multiple connexins. Am J Physiol Gastrointest Liver Physiol. 2001;281:G533–543. doi: 10.1152/ajpgi.2001.281.2.G533. [DOI] [PubMed] [Google Scholar]
- Ward SM, Dalziel HH, Thornbury KD, Westfall DP. Sanders KM. Nonadrenergic, noncholinergic inhibition and rebound excitation in canine colon depend on nitric oxide. Am J Physiol. 1992;262:G237–243. doi: 10.1152/ajpgi.1992.262.2.G237. [DOI] [PubMed] [Google Scholar]
- Waterman SA. Costa M. The role of enteric inhibitory motoneurons in peristalsis in the isolated guinea-pig small intestine. J Physiol. 1994;477:459–468. doi: 10.1113/jphysiol.1994.sp020207. [DOI] [PMC free article] [PubMed] [Google Scholar]
- Werry TD, Wilkinson GF. Willars GB. Mechanisms of cross-talk between G-protein-coupled receptors resulting in enhanced release of intracellular Ca2+ Biochem J. 2003;374:281–296. doi: 10.1042/BJ20030312. [DOI] [PMC free article] [PubMed] [Google Scholar]
- Wood JD. Excitation of intestinal muscle by atropine, tetrodotoxin, and xylocaine. Am J Physiol. 1972;222:118–125. doi: 10.1152/ajplegacy.1972.222.1.118. [DOI] [PubMed] [Google Scholar]
- Wood JD. Brann LR. Pharmacological analysis of rebound excitation in large intestine of piebald mouse model for Hirschsprung's disease. Dig Dis Sci. 1986;31:744–752. doi: 10.1007/BF01296453. [DOI] [PubMed] [Google Scholar]
- Zhang Y, Lomax AE. Paterson WG. P2Y1 receptors mediate apamin-sensitive and -insensitive inhibitory junction potentials in murine colonic circular smooth muscle. J Pharmacol Exp Ther. 2010;333:602–611. doi: 10.1124/jpet.109.160978. [DOI] [PubMed] [Google Scholar]
Associated Data
This section collects any data citations, data availability statements, or supplementary materials included in this article.
Supplementary Materials
. PDGFRα+ cell Ca2+ responses to nerve stimulation.
Movie S2. Ca2+ transients of PDGFRα+ cells are absent in P2ry1(−/−) mice.