Abstract
Ceramide synthase 2 (CerS2) null mice cannot synthesize very-long acyl chain (C22-C24) ceramides resulting in significant alterations in the acyl chain composition of sphingolipids. We now demonstrate that hepatic triacylglycerol (TG) levels are reduced in liver but not in adipose tissue or skeletal muscle in the CerS2 null mouse, both before and after feeding with a high fat diet (HFD), where no weight gain was observed and large hepatic nodules appeared. Uptake of both BODIPY-palmitate and [3H]-palmitate were also abrogated in hepatocytes and liver. The role of a number of key proteins involved in fatty acid uptake was examined, including FATP5, CD36/FAT, FABPpm and cytoplasmic FABP1. Levels of FATP5 and FABP1 were decreased in CerS2 null mouse liver, whereas CD36/FAT levels were significantly elevated and CD36/FAT was also mislocalized upon insulin treatment. Moreover, treatment of hepatocytes with C22-C24-ceramides down-regulated CD36/FAT levels. Infection of CerS2 null mice with recombinant adeno-associated virus (rAAV)-CerS2 restored normal TG levels and corrected the mislocalization of CD36/FAT, but had no effect on the intracellular localization or levels of FATP5 or FABP1. Together, these results demonstrate that hepatic fatty acid uptake via CD36/FAT can be regulated by altering the acyl chain composition of sphingolipids.
Keywords: Sphingolipids, ceramide synthase, fatty acid uptake, fatty acid transport protein, fatty acid binding protein, cluster of differentiation 36
1. Introduction
Triacylglycerols (TG) are transported in very low density lipoprotein (VLDL) particles or chylomicrons and degraded to free fatty acids (FFAs) by the action of hepatic lipase (HL). Although FFAs were thought to enter cells by diffusion, long chain fatty acid (LCFA) uptake is now believed to be, at least partially, protein-mediated, dependent on fatty acid transport proteins (FATPs), plasma membrane fatty acid binding protein (FABPpm) and fatty acid translocase (CD36/FAT) [1,2]. Six FATP family members have been identified, with each displaying tissue-specific expression [1]. An FATP5 null mouse displays reduced hepatic TG and FFA levels [3]. Upon insulin stimulation, CD36/FAT localizes from an interior vesicle population to the plasma membrane [4–7], and in the absence of caveolin-1, CD36/FAT is mis-targeted out of detergent-resistant membranes (DRMs), resulting in reduced FFA uptake [8]. A caveolin-1 null mouse is resistant to diet-induced obesity [9], and inhibition of caveolae formation results in decreased oleic acid uptake [10].
Sphingolipids (SLs) are major components of the plasma membrane where they are involved in regulating a number of processes. The backbone of all SLs is ceramide. In mammals, ceramide is synthesized by six ceramide synthases (CerS) [11], with each using acyl CoAs of different chain lengths for N-acylation of the sphingoid long chain base. CerS2, which generates very-long acyl chain (VLC) ceramides (C22-24-ceramides), is the best characterized CerS, largely due to the generation and characterization of a CerS2 null mouse [12,13], which displays a wide range of pathologies, many of which are associated with the liver, where CerS2 is expressed at high levels. CerS2 null mice contain virtually no VLC-ceramides but contain elevated levels of C16-ceramide and sphinganine, which appear to be the cause of hepatopathy, hepatic insulin resistance, hepatic oxidative stress and mitochondrial dysfunction [12–15], probably due to altered membrane properties [16]. However, the pathologies are not caused by a general defect in liver function, but rather by the dysfunction of specific biochemical pathways. For instance, CerS2 null mice are insensitive to LPS/galactosamine-mediated hepatic failure due to defective TNFR1 internalization [17] and to drug-induced liver injury due to dysfunctional gap junctions [18]. Thus, it is not possible to predict the outcome of manipulation of the liver due to the variety of pathways that are, or are not affected, by altering the SL acyl chain composition.
We now demonstrate that LCFA uptake is disrupted in CerS2 null mouse liver, resulting in reduced hepatic TG accumulation even after a high fat diet (HFD). These data might implicate SL synthesis as a putative regulatory mechanism in nonalcoholic fatty liver disease (NAFLD).
2. Materials and Methods
2.1. Materials
Optiprep, tyloxapol and sulfo-N-succinimidyl oleate (SSO) were from Sigma Aldrich (St Louis, MO). C16-C24 ceramides were from Avanti Polar Lipids (Alabaster, AL). The antibodies used in this study were anti-caveolin-1, anti-clathrin (Cell Signaling Technology, Beverly, MA), anti-flotillin-1, anti-IRβ (BD Biosciences, San Diego, CA), anti-α-tubulin, anti-β-actin, anti-HA, anti-Flag, anti-CerS2 (Sigma Aldrich, St Louise, MO), anti-FATP5, anti-1163-phosphorylated IRβ (Santa Cruz Biotechnology, Santa Cruz, CA), anti-CD36/FAT (eBioscience, San Diego, CA), anti-GAPDH (Millipore, Temecula, CA) anti-FABPpm (Abcam, Cambridge, MA) and anti-Cy2, anti-Cy3 (Jackson ImmunoResearch Laboratories, West Grove, PA). The anti-FABP1 antibody was obtained as described [19]. [9,10-3H(N)]-triolein and [14C]-palmitic acid were from American Radiolabeled Chemicals (St Louis, MO) and [9,10-3H (N)]-palmitic acid was from Amersham International (Amersham, UK). BODIPY-palmitate was from Invitrogen (Carlsbad, CA).
2.2. Animals
CerS2 null mice were generated as described [12,13]. All mice were treated according to the Animal Care Guidelines of the Weizmann Institute of Science Animal Care Committee and the National Institutes of Health’s Guidelines for Animal Care.
2.3. Lipid Extraction and Thin Layer Chromatography
Lipids were extracted using chloroform/methanol, (2:1, vol:vol) and separated by thin layer chromatography (TLC) using heptane/isopropyl ether/acetic acid as the developing solvent (60:40:3, vol:vol:vol). TLC plates were sprayed with copper sulfate (15.6% copper sulfate, 9.4% phosphoric acid) and incubated at 100°C for 8 min.
2.4. TG and FFA Quantification
TGs and FFAs were measured using colorimetric assays (Triglyceride Quantification Kit, Biovision, Palo Alto, CA, and Free Fatty Acid Quantification kit, Biovision, Palo Alto, CA).
2.5. High Fat Diet
HFD (D12492) (60% fat, 20% carbohydrate, 20% protein, 5.24 kcal/g) and chow diets (D12450K) (10% fat, 70% carbohydrate, 20% protein, 3.85 kcal/g) were from Research Diets (New Brunswick, NJ). 2–3-month-old male mice were fed either a HFD or chow diet for 12 weeks and had free access to water and food.
2.6. Glucose-Tolerance Test
Glucose-tolerance test was performed as described [14]. After 8 h starvation, glucose (2.0 g/Kg) was injected intraperitoneally, and blood glucose was measured using an automatic glucometer (ACCU-CHEK PERFORMA, Roche Diagnostics).
2.7. Histology
Liver was fixed in 4% paraformaldehyde solution overnight and embedded in paraffin, sectioned at 4 μm and stained with hematoxylin and eosin.
2.8. Fatty acid oxidation
Fatty acid oxidation in 2-month-old fed or fasted WT and CerS2 null mice liver was examined as described [20,21]. Briefly, 1 μCi [14C]-palmitate was added to a liver homogenate (1 mg of protein) and incubated with 7% perchloric acid (PCA) for 24 hr at 37°C with shaking. 14CO2 was captured using tissue paper soaked in 1 M benzethonium hydroxide. Acidified samples were centrifuged at 2,200×gav for 10 min and oxidation was calculated by summing total radioactivity of the supernatant (acid-soluble products) and of the tissue paper (CO2).
2.9. Absorption and Distribution of Dietary Fat
Fat absorption and uptake in intestine were measured as described [22]. Briefly, 2–3-month-old mice were injected with 100 μl tyloxapol (5% in PBS) into the tail vein and gavaged with 2 μCi [9,10-3H(N)]-triolein in 100 μl olive oil. Blood was collected at 1, 2 and 4 h and radioactivity was measured. For the distribution of dietary fat, mice were fasted for 6 h and subsequently gavaged with 1 μCi [9,10-3H(N)]-triolein in 100 μl olive oil. After 2 h, the small intestine was excised and cut into 2 cm pieces. Radioactivity was analyzed with Ultima Gold scintillation cocktail (PerkinElmer Life and Analytical Sciences, Boston, MA).
2.10. Triglyceride Hydrolase, MGAT and DGAT Activity Assays
TG hydrolase [23,24], MGAT and DGAT assays in 2-month-old WT and CerS2 null mice were performed as described [25].
2.11. Hepatocyte Isolation and Lipid or Insulin Treatment
Hepatocytes were isolated as described [14] from 2-month-old mice. After 18 h starvation, BODIPY-palmitate (20 μM) was added to serum-free media with 0.1% FA-free bovine serum albumin (Sigma Aldrich, St Louise, MO) (the molar ratio of BODIPY-palmitate/BSA was 1.3) and incubated for various times. Hepatocytes were fixed, stained by Hoechst 33342 (Invitrogen, Carlsbad, CA) and examined by confocal laser scanning microscopy using an Olympus Fluoview FV500 imaging system. BODIPY-palmitate and Hoechst 33342 were detected with excitation wavelengths of 492 and 405nm, respectively. Hepatocytes, permeabilized with 20 μg/ml digitonin for 10 min every 6 h, were incubated for 24 h with 10 μM C16-C24 ceramides. In some cases, hepatocytes were treated with insulin (80 IU/l for 4 h, 10 nM for 0.5 h, or 100 nM for 0.5 h).
2.12. [9,10 N-3H]-Palmitic Acid Uptake
6.6 mCi/kg [9,10 N-3H] palmitic acid (dried under N2) and dissolved in saline with 5 mg/ml FA-free bovine serum albumin (the molar ratio of [9,10 N-3H] palmitate/BSA was 0.5) was injected via the tail vein. Thirty minutes after injection, mice were euthanized and radioactivity quantified.
2.13. Real Time PCR, Cell Culture and Transfection
Real Time PCR, cell culture and transfection were performed as described [14]. Primers for real time PCR are listed in Supplemental Table 1.
2.14. Western Blotting
Radioimmunoprecipitation assay (RIPA) buffer (50 mM Tris-Cl, pH 7.5, 150 mM NaCl, 1% Nonidet P-40, 0.5% sodium deoxycholate, 0.1% SDS and protease inhibitors) was added to liver tissue or to isolated hepatocytes and homogenized. Protein was quantified using the BCA Protein Assay Kit (Pierce Chemical Co., Rockford, IL). Fifty micrograms of protein was loaded in each lane and separated by 8~15% SDS-PAGE and transferred to nitrocellulose membranes. Membranes were blocked using 5% bovine serum albumin (BSA) in PBST (PBS with 0.1% Tween-20) and primary and secondary antibodies in PBST were added. Chemiluminescence was performed using a SuperSignal West Pico Chemiluminescent Substrate (Thermo Scientific Inc., Waltham, MA).
2.15. Isolation of Detergent-Resistant Membranes
Mouse liver was excised and homogenized at 4°C with lysis buffer (0.1% Triton X-100, 100 mM NaCl, 2 mM EDTA, 2 mM EGTA, 30 mM HEPES, pH 7.5, 1 mM Na3VO4, 50 μm phenylarsine oxide and protease inhibitors). Homogenates were centrifuged (3 min, 400×gav, 4°C) and 40% Optiprep and 10% sucrose (final concentration) were added to the supernatant, which was overlaid with 35%, 30%, 25%, 20% and 0% Optiprep containing 10% sucrose and centrifuged (6 h, 170,000×gav, 4°C). Nine fractions were separated and kept at −20°C.
2.16. Immunocytochemistry
Hepatocytes either before and after insulin treatment were fixed with 3% paraformaldehyde for 10 min and permeabilized with 0.1% saponin. Hepatocytes were blocked with 20% horse serum in PBS for 2 h and incubated with an anti-CD36/FAT antibody (1:100) or with an anti-FATP5 antibody (1:200) at 4°C overnight. After three washes with PBS, anti-Cy2 (1:250) or anti-Cy3 antibodies (1:500) were added for 1 h. Hoechst 33342 (Invitrogen, Carlsbad, CA) was used to label nuclei, and hepatocytes were examined by confocal laser scanning microscopy. Hoechst 33342, Cy2 and Cy3 were viewed with excitation wavelengths of 405, 492 and 568 nm, respectively.
2.17. Separation of Membrane and Cytoplasmic Fractions
Hepatocytes were lysed in fractionation buffer (250 mM sucrose, 20 mM HEPES, pH 7.4, 10 mM KCl, 1.5 mM MgCl2, 1 mM EDTA, 1 mM EGTA) containing protease inhibitors. Lysates were passed through a 25G needle 15 times. After 15 min incubation on ice, lysates were centrifuged (5 min, 720×gav, 4°C) and the pellet (the nuclear fraction) was removed. The supernatant was centrifuged (20 min, 10,000×gav, 4°C) and the pellet (mitochondrial fraction) removed. Further centrifugation of the supernatant (1 h, 100,000×gav, 4°C) yielded the membrane and cytosolic fractions.
2.18. Recombinant AAV production
Recombinant adeno-associated virus (rAAV) containing full-length human CerS2 cDNA was produced as described [18].
2.19. Mass Spectrometry
Electrospray ionization tandem mass spectrometry was performed using a PE-Sciex API 3000 triple quadrupole mass spectrometer and an ABI 4000 quadrupole-linear ion trap mass spectrometer [26,27].
2.20. Statistical Analysis
Values are expressed as means ± S.E.M. Statistical significance was calculated using a Student’s t test.
3. Results
3.1. Reduced TG Levels in CerS2 Null Mouse Liver
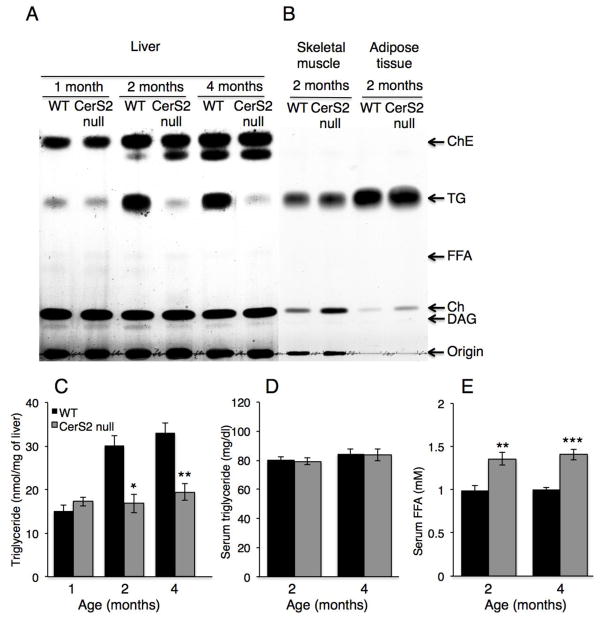
We first analyzed TG levels in CerS2 null mice, which were significantly lower in 2 and 4 month-old CerS2 null mice liver than in wild type (WT) littermate controls (Fig. 1A, C), but were unaltered in skeletal muscle and in adipose tissue (Fig. 1B). No differences in TG levels were detected in serum, although FFA levels were somewhat elevated in CerS2 null mice (Fig. 1D, E).
Fig. 1. TG and FFA levels in 1–4 month-old CerS2 null mouse liver.
TG levels were measured in liver by two independent methods, (A) TLC (representative result of 3 independent experiments) and (C) a colorimetric assay (n=3). (B) Lipid levels in skeletal muscle and adipose tissue. (D) TG and (E) FFA levels in serum (n=5–6). ChE, cholesterol ester; Ch, cholesterol; DAG, diacylglycerol. Data are means ± S.E.M. *P < 0.05, **P < 0.01, ***P < 0.001.
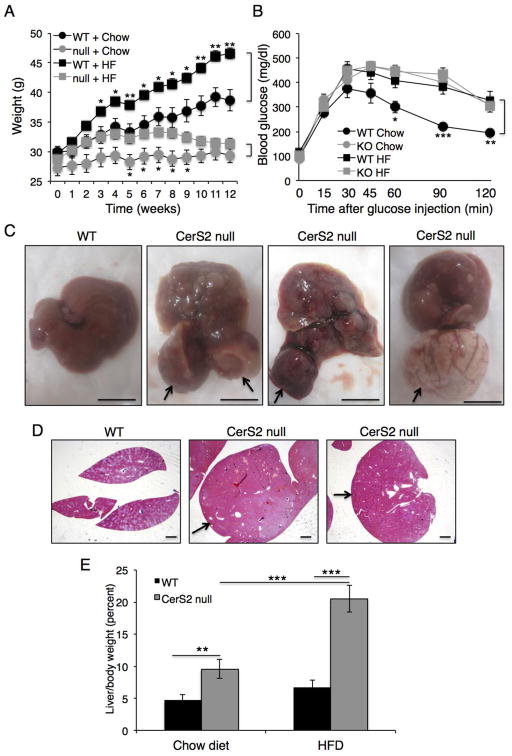
On a low fat chow diet, CerS2 null mice gained less weight than WT mice (Fig. 2A). Upon feeding with a high fat diet (HFD) for 12 weeks, WT mice showed a significant gain in body weight, as expected, whereas CerS2 null mice showed a small weight gain between 1–4 weeks of HFD, but weight loss after 7 weeks (Fig. 2A). The increased insulin resistance observed in CerS2 null mice [14] did not change upon feeding with the HFD (Fig. 2B). CerS2 null mice also showed dramatically enlarged liver nodules (Fig. 2C), which might be related to the enhanced levels of regenerative nodules in older, chow-fed CerS2 null mice [13], whereas the liver of WT mice fed with a HFD displayed a typical pattern of fat accumulation (Fig. 2C). Similar results were obtained using hematoxylin and eosin staining (Fig. 2D). CerS2 null mice showed an increase in liver weight upon feeding with a HFD (Fig. 2E).
Fig. 2. Effect of a HFD on CerS2 null mice.
(A) Weight of 6-month-old WT and CerS2 null mice during feeding with either a chow or HFD (n=8). (B) Glucose tolerance test after 8 h starvation (n=8). (C) Size of hepatic nodules 12 weeks after feeding with a HFD. Arrows indicate hepatic nodules in three examples of CerS2 null mouse liver. Scale bar, 10 mm. (D) Hematoxylin & eosin staining of WT and CerS2 null mouse liver after feeding with a HFD. Arrows indicate hepatic nodules. Scale bar, 1 mm. (E) Liver/body mass (n=4). Data are means ± S.E.M.** P< 0.01, *** P< 0.001.
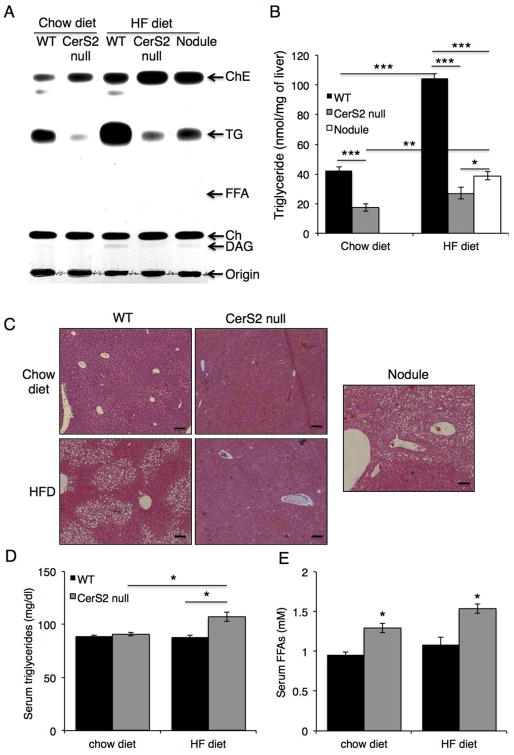
While the HFD caused a huge increase in hepatic TG content in WT mice, a much smaller increase was observed in CerS2 null mice (Fig. 3A, B). Hematoxylin & eosin staining was consistent with the lack of lipid droplet accumulation in CerS2 null mice (Fig. 3C). After the HFD, the amount of TG in nodules was much lower than in WT mice (Fig. 3A, B). Serum TG levels were elevated in CerS2 null mice (Fig. 3D), although FFA levels did not increase further after the HFD (Fig. 3E).
Fig. 3. Hepatic TG levels after feeding with a HFD.
TG levels were measured in liver from 6-month-old mice by two independent methods, (A) TLC (representative result of 3 independent experiments) and (B) a colorimetric assay (n=3). (C) Hematoxylin & eosin staining. The nodule is from a CerS2 null mouse. Scale bar, 100 μm. (D) Serum TG and (E) FFA levels (n=3). ChE, cholesterol ester; Ch, cholesterol; DAG, diacylglycerol. Data are means ± S.E.M.* P< 0.05, ** P< 0.01, *** P< 0.001.
3.2. Intestinal TG absorption and hepatic fatty acid oxidation
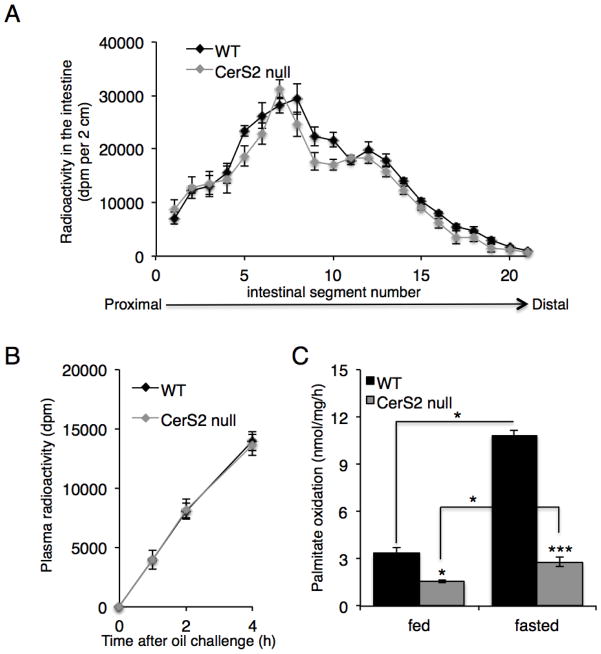
The lack of TG accumulation in the CerS2 null mouse liver could, in principle, be explained by altered TG uptake in the intestine, a tissue in which CerS2 is expressed at high levels [28]. However, no difference in TG (Triolein [9,10-3H(N)]) absorption was observed between WT and CerS2 null mice (Fig. 4A). Likewise, the rate of appearance of radioactive TG in the blood was unaffected (Fig. 4B). Monoacylglycerol acyltransferase (MGAT) and diacylglycerol acyltransferase (DGAT) activities were measured in liver microsomal fractions since the sphingoid long chain base, sphingosine, has been shown to inhibit MGAT activity [29]. MGAT (13.6 ± 1.3 nmol/mg/min in WT versus 17.1 ± 2.6 in CerS2 null (n=4)) and DGAT (6.9 ± 0.2 nmol/mg/min in WT versus 5.6 ± 0.4 in CerS2 null (n=4)) activities were unaltered, as was the activity of TG hydrolase (103 ± 10.8 nmol/mg/h in WT versus 108 ± 9.7 in CerS2 null (n=3)). Interestingly, reduced levels of fatty acid oxidation were detected in both fed and fasted CerS2 null mice (Fig. 4C).
Fig. 4. Intestinal TG absorption and hepatic fatty acid oxidation.
(A) Distribution of [3H]-Triolein in 2-month-old CerS2 null mouse intestine (n=3). (B) Plasma radioactivity after administration of tyloxapol and [3H]-Triolein (n=3). (C) Fatty acid oxidation in 2–3-month-old WT and CerS2 null mice liver (n=4). * P< 0.05, *** P<0.001.
3.3. Fatty Acid Uptake is Abrogated in CerS2 Null Mouse Liver
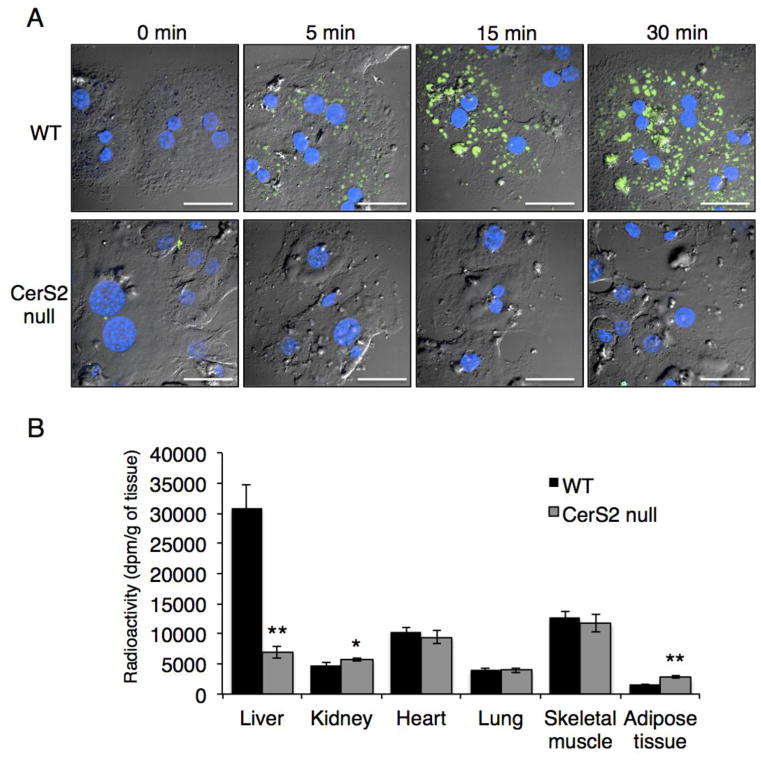
We next determined the relationship between liver TG levels and the rate of FFA uptake. BODIPY-palmitate uptake was dramatically reduced in CerS2 null mice hepatocytes (Fig. 5A), as was uptake of [9,10-3H (N)]-palmitate upon its injection into the tail vein; [9,10-3H (N)]-palmitate uptake was unaffected in a number of other tissues, and slightly increased in kidney and in adipose tissue (Fig. 5B). These data suggest that the lower levels of TG accumulation in CerS2 null mouse liver could be due to defective fatty acid uptake.
Fig. 5. FFA uptake in CerS2 null mouse liver.
(A) BODIPY-palmitate (green) uptake into hepatocytes isolated from 2–3-month-old WT and CerS2 null mice. Nuclei were labeled with DAPI (blue). This experiment was repeated 4 times with similar results. Scale bar, 20 μm. (B) [9,10-3H (N)]-palmitate uptake into mouse tissues upon its injection into the tail vein (n=4). Data are means ± S.E.M. * P< 0.05, ** P< 0.01.
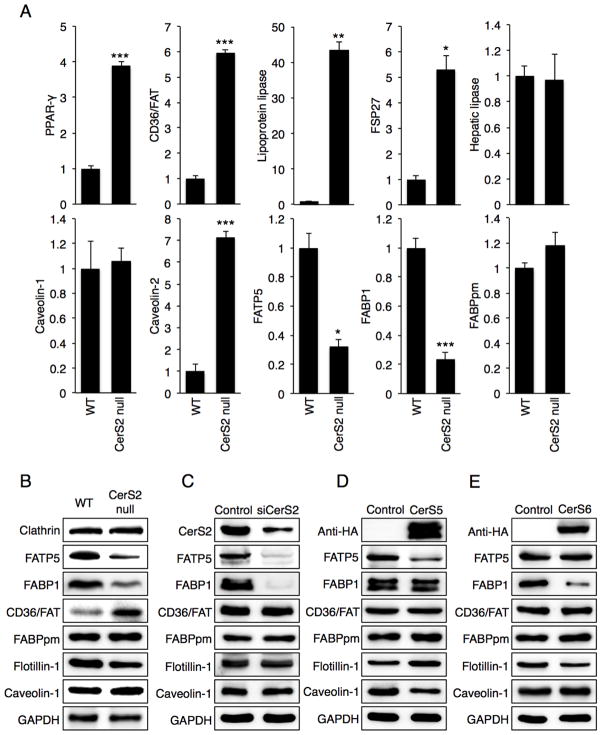
We next measured levels of a number of key proteins involved in hepatic FFA uptake, including FATP5, CD36/FAT, FABPpm and FABP1 [1–3,30]. mRNA expression levels of PPAR-γ, CD36/FAT, lipoprotein lipase (LPL), fat specific protein 27 (FSP27) and caveolin-2 were significantly increased in livers of 2-month-old CerS2 null mice, whereas FATP5 and FABP1 levels were down-regulated (Fig. 6A). mRNA expression levels of hepatic lipase and FABPpm were unaltered (Fig. 6A). Western blotting was consistent with mRNA expression, since CD36/FAT levels were elevated whereas FATP5 and FABP1 levels were reduced in 2 month-old mouse liver (Fig. 6B). FABPpm levels were unchanged (Fig. 6B).
Fig. 6. Expression of proteins involved in hepatic FFA uptake.
(A) mRNA expression in 2-month-old WT and CerS2 null mice (n=3). Data are show as fold-change versus WT and are means ± S.E.M. * P< 0.05, ** P< 0.01, *** P< 0.001. FATP5, fatty acid transport protein 5; FSP27, fat specific protein 27; FABP1, fatty acid binding protein 1; FABPpm, plasma membrane fatty acid binding protein. (B) Western blots of homogenates from 2-month-old WT and CerS2 null mouse liver. Western blots of Hep3b cells after transfection with either (C) siRNA to CerS2, (D) CerS5 or (E) CerS6. Western blots were repeated at least 3 times and gave similar results.
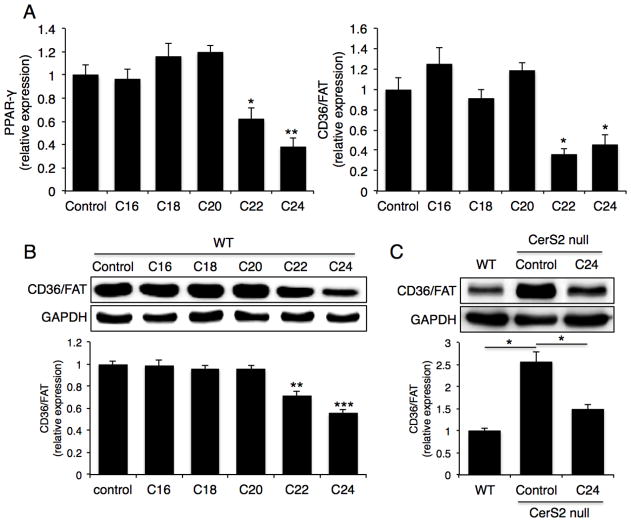
To determine the role of specific SLs in regulating levels of these proteins, Hep3b liver cells were transfected with CerS2 siRNA [28]; in CerS2 null mice, C16-ceramide and sphinganine levels are elevated in addition to the reduced levels of VLC-ceramides [12]. Consistent with the results in CerS2 null mouse liver, FATP5 and FABP1 levels were reduced, although CD36/FAT and caveolin-1 were unaltered (Fig. 6C). Transfection with CerS2 siRNA elevates C16-SL levels but only causes a small decrease in VLC-SLs [28,31], implying that the decrease in FATP5 and FABP1 levels is due to increased C16-SLs [12]. This was verified by transfecting Hep3b cells with CerS5 or CerS6. In the case of CerS5, C16-ceramide levels were elevated from 317 ± 70 pmol/mg dry weight in non-transfected cells to 986 ± 187 pmol/mg dry weight, and in the case of CerS6, C16-ceramide levels increased to 835 ± 123 pmol/mg dry weight. CerS5 transfection led to reduced FATP5 and caveolin-1 levels (Fig. 6D), whereas CerS6 transfection led to reduced FABP1 levels (Fig. 6E). These data indicate that elevated C16-SLs levels might be responsible for the reduction in FATP5 and FABP1 levels. In contrast, the increase in CD36/FAT and PPAR-γ expression could be regulated by additional factors. This was supported by experiments in which hepatocytes were directly incubated with VLC-ceramides. After gentle permeabilization of WT hepatocytes [32,33], PPAR-γ and CD36/FAT levels were reduced upon incubation with C22- and C24-ceramides (Fig. 7A, B), and CD36/FAT levels were decreased upon incubation of CerS2 null mice hepatocytes with C24-ceramide (Fig. 7C). No other ceramides, including C16-, C18- and C20-ceramides had any effect.
Fig. 7. Effects of VLC-ceramides on CD36/FAT expression.
Hepatocytes from 2-month-old mice were treated with various acyl chain length ceramides. (A) mRNA expression levels of PPAR-γ and CD36/FAT (n=3). (B) Protein level of CD36/FAT. Western blots were repeated at least 3 times and gave similar results. (C) Protein level of CD36/FAT in 2-month-old CerS2 null hepatocyte after C24-ceramide treatment. Western blots were repeated at least 3 times and gave similar results. Data are means ± S.E.M., * P< 0.05, ** P< 0.01, *** P< 0.001.
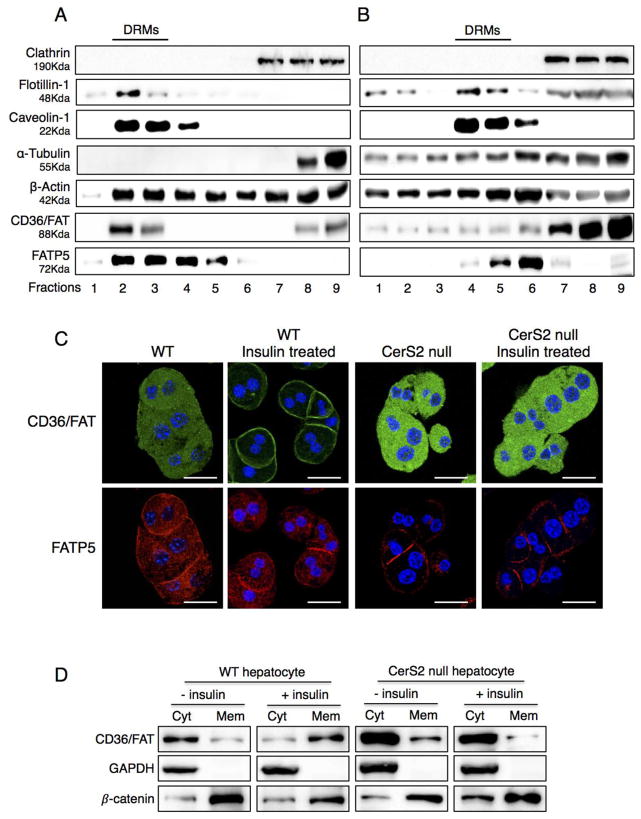
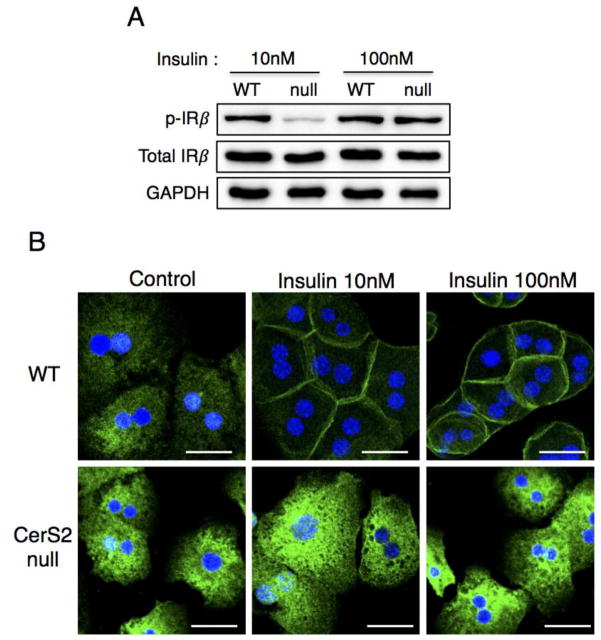
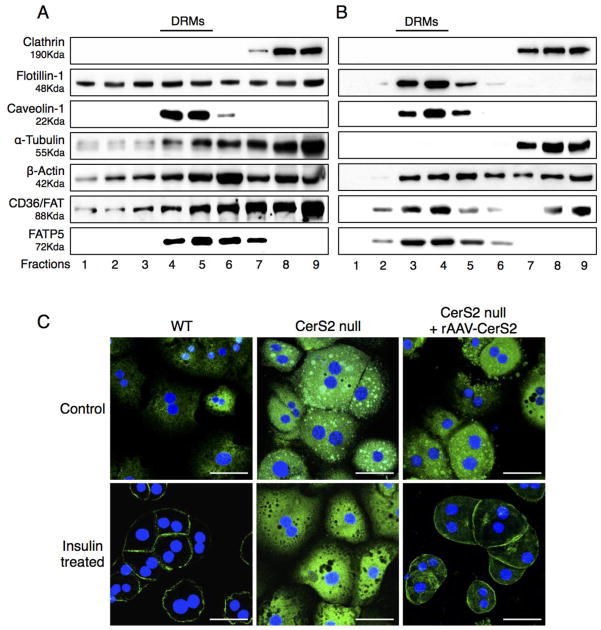
CD36/FAT and caveolin play a critical role in LCFA uptake, and both proteins can be isolated in DRM fractions [8,10]. CD36/FAT was mislocalized out of DRMs isolated from CerS2 null mice, where it was found in lower density fractions, as were a number of other proteins including flotillin-1 [14], α-tubulin and β-actin (Figs. 8A and B). The distribution of FATP5 was unaltered (Fig. 8A and B), although its levels were significantly decreased (Fig. 6B). In hepatocytes isolated from WT mice, CD36/FAT translocated to the plasma membrane upon insulin treatment [4–7], but did not translocate in hepatocytes from CerS2 null mice (Fig. 8C). Translocation of CD36/FAT was also observed in membrane fractions in which CD36/FAT translocated to the membrane fraction upon insulin treatment in hepatocytes derived from WT but not from CerS2 null mice (Fig. 8D). To determine whether the changes in CD36/FAT localization might be due to insulin resistance [14], hepatocytes were treated with high levels of insulin (100 nM), which is able to overcome the insulin resistance (Fig. 9A) but had no effect on CD36/FAT translocation in hepatocytes from CerS2 null mice (Fig. 9B).
Fig. 8. Distribution of CD36/FAT and FATP5 in DRM fractions.
DRM fractions from 2-month-old (A) WT and (B) CerS2 null mouse liver analyzed by Western blotting. The experiment was repeated at least 3 times and gave similar results. (C) Intracellular location of CD36/FAT and FATP5 in hepatocytes isolated from 2-month-old WT and CerS2 null mouse after treatment with 80 mU/l insulin. Scale bar, 20 μm. This experiment was repeated 4 times with similar results. (D) Subcellular fractionation of CD36/FAT in hepatocytes from 2-month-old WT and CerS2 null mice upon insulin treatment. This experiment was repeated 3 times with similar results. Cyt, cytoplasmic fraction; Mem, membrane fraction.
Fig. 9. Impaired CD36/FAT translocation is not due to hepatic insulin resistance.
(A) Phosphorylation of insulin receptor β and (B) CD36/FAT translocation of hepatocytes isolated from 2-month-old WT, CerS2 null mice upon 10 nM or 100 nM insulin treatment. Scale bar, 20 μm. This experiment was repeated 4 times with similar results.
3.4. Infection of CerS2 Null Mice with rAAV-CerS2 Restores TG Levels and FFA Uptake
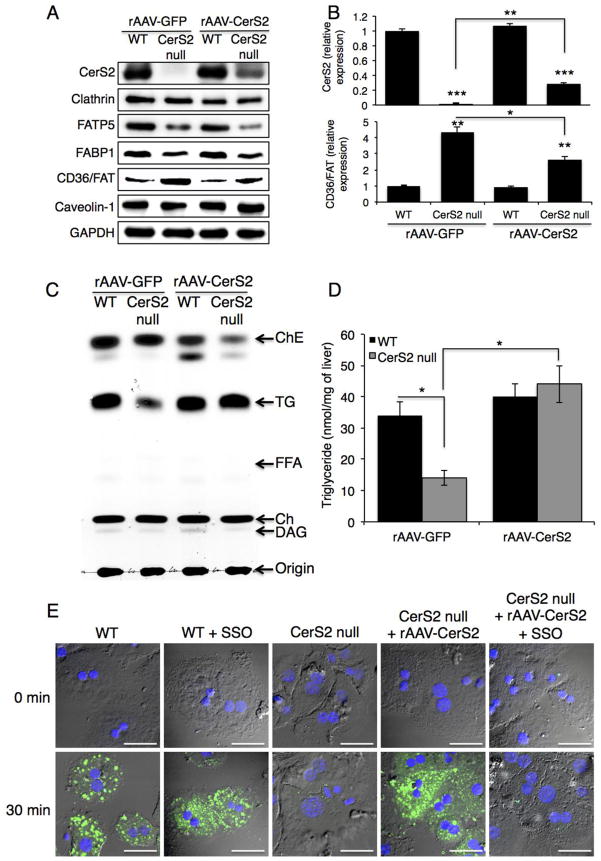
To demonstrate a direct mechanistic association between CerS2 and CD36/FAT, mice were infected with recombinant adeno-associated virus expressing human CerS2 (rAAV-CerS2) [18]. Six to seven weeks after infection, CerS2 levels increased to ~25% of those found in WT mice (Fig. 10A, B), with a concomitant decrease in CD36/FAT levels, but no effect on FABP1 and FATP5 levels (Fig. 10A, B). Importantly, both TG levels in liver (Fig. 10C, D) and BODIPY-palmitate uptake in hepatocytes (Fig. 10E) were restored to levels similar to those in WT mice, as was the distribution of proteins in DRMs (Fig. 11B). BODIPY-palmitate uptake in CerS2 null hepatocyte was inhibited by sulfo-N-succinimidyl oleate (SSO) (Fig. 10E), a specific CD36/FAT inhibitor [34,35]. CD36/FAT was also re-targeted to the plasma membrane upon insulin treatment (Fig. 11C). These results demonstrate that the levels and intracellular distribution of CD36/FAT can be directly regulated by VLC-SLs, which in turn directly impacts hepatic FFA transport and TG levels.
Fig. 10. Effect of rAAV-CerS2 infection on protein levels and on FFA uptake.
rAAV-GFP and rAAV-CerS2 were injected via the tail vein to 6–7-week-old WT and CerS2 null mice. (A) Protein expression analyzed by Western blotting. This experiment was repeated 3 times with similar results. (B) Quantification of CerS2 and CD36/FAT levels (n=3). Data are means ± S.E.M. * P< 0.05, ** P< 0.01, *** P< 0.001. (C) TG and lipid levels. This experiment was repeated 3 times with similar results. (D) Quantification of TG levels. Data are means ± S.E.M. * P< 0.05. (n=3) (E) Uptake of BODIPY-palmitate into hepatocytes isolated from WT and CerS2 null mice. This experiment was repeated twice with similar results. Scale bar, 20 μm.
Fig. 11. Effect of rAAV-CerS2 infection on distribution of CD36/FAT and FATP5.
DRM fractions from 4-month-old CerS2 null mouse liver infected with either (A) rAAV-GFP or (B) rAAV-CerS2 analyzed by Western blotting. The experiment was repeated at least 3 times and gave similar results. The location of DRMs is indicated. (C) Intracellular location of CD36/FAT upon treatment with 80 mU/l insulin of hepatocytes isolated from 4-month-old WT, CerS2 null and CerS2 null mouse liver after rAAV-CerS2 infection. Scale bar, 20 μm. This experiment was repeated 3 times with similar results.
4. Discussion
The main result of the current study is that hepatic TG levels are significantly reduced in CerS2 null mice and do not increase upon feeding with a HFD. The major mechanistic explanation for this phenomenon is the altered intracellular localization of CD36/FAT, which directly impacts hepatic FFA uptake and TG accumulation in CerS2 null mice. Direct evidence for a role of CD36/FAT was obtained upon infection with rAAV-CerS2, which re-targeted CD36/FAT to the plasma membrane and restored FFA uptake, but had no effect on other proteins such as FATP5 and FABP1. Our data are consistent with the idea that hepatic CD36/FAT expression is regulated by C22-C24-ceramide levels [36]. Feeding with a HFD feeding decreases C24-ceramide levels in mouse liver [37,38] and increases hepatic CD36/FAT expression [39]. Thus, CerS2 appears to play an important role in the regulation of hepatic CD36/FAT expression.
The role of CD36/FAT in hepatic fatty acid uptake is somewhat controversial. Although CD36/FAT does not play a major role in fatty acid uptake in normal liver [40,41], increased hepatic CD36/FAT expression has been observed in various pathologic conditions such as cancer, NAFLD, and type 2 diabetes mellitus [42,43]. Similarly, CD36/FAT levels were up-regulated in CerS2 null mice, although CD36/FAT was non-functional since it was mis-localized, likely due to altered membrane properties [12,14,16]. Furthermore, FFA uptake via FATP5 and FABP1, both of which are involved in FFA uptake in normal liver, seem to play a limited role in FFA uptake in CerS2 null mice due to their diminished expression. CD36/FAT was found in low density, detergent-soluble fractions in CerS2 null mice, consistent with data showing inhibition of FA uptake in adipocytes upon methyl-β-cyclodextrin treatment and upon transfection with a dominant-negative caveolin mutant [1,44]. Similarly, caveolin-1 null mice were resistant to diet-induced obesity [9] and CD36/FAT was isolated in detergent-soluble fractions in caveolin-1 knockout fibroblasts [8]. Thus, even though CD36/FAT levels were up-regulated, this up-regulation did not have any impact upon FFA uptake since CD36/FAT was localized intracellularly rather than at the plasma membrane upon insulin treatment. In principle, the disrupted insulin receptor signaling in CerS2 null mice [14] could play a role in the mislocalization of CD36/FAT. However, upon treatment with high levels of insulin, resulting in normal insulin receptor phosphorylation in CerS2 null mice, CD36/FAT was not localized to the plasma membrane. In contrast, rAAV-CerS2 infection did permit CD36/FAT translocation to the plasma membrane and restored FFA uptake. Hence, recent interest in manipulating CD36/FAT levels as a potential therapeutic target in fatty liver diseases [39] should take into account that the correct intracellular localization of CD36/FAT is critical for its proper function.
Previous studies have shown that CD36/FAT over-expression increases hepatic TG storage by increasing FFA uptake [42], and that hepatic CD36/FAT expression is regulated by LXR (liver X receptor), PXR (pregnane X receptor) and PPAR-γ [45]. CD36/FAT is expressed mainly in adipose tissue, skeletal muscle and heart, with relatively low expression in liver [46]. Moreover, CD36/FAT null mice exhibit elevated plasma FFA and TG levels and impaired LPL-mediated TG clearance [47]. There are, however, significant differences in the phenotypes of CD36/FAT and of CerS2 null mice, since CD36/FAT function in heart, skeletal muscle and adipose tissue in CerS2 null mice is unaffected, probably due to the less dramatic changes in the SL chain length in these tissues due to lower basal expression levels of CerS2.
Although CD36/FAT appears to play a major role in reduced levels of FFA uptake, other factors may also contribute, such as β-oxidation, lipogenesis and lipoprotein secretion. Indeed, a significant reduction in β-oxidation was observed in CerS2 null mice, consistent with impaired mitochondrial function in these mice [15], but demonstrating that altered β-oxidation cannot explain the reduced TG levels. MGAT and DGAT activity were also unaltered.
An unexpected observation in the current study was the appearance of hepatic nodules upon feeding a HFD to CerS2 null mice, which was accompanied by lipid droplet accumulation. The mechanism of focal fatty changes is unknown, but focal tissue hypoxia might be involved [48] as might decreased blood perfusion [49]. Levels of apoptosis and proliferation are both increased in CerS2 null mouse liver, a number of cell cycle-related genes are up-regulated [13], the liver/body weight ratio increases, and 20% of CerS2 null mice develop hepatocellular carcinoma after 14 months of age [13]. In addition, sphingosine and sphinganine are elevated in CerS2 null mice liver although levels of sphingosine 1-phosphate and sphinganine 1-phosphate are unaltered [12]. Elevation of sphingoid bases been reported in hepatic nodules induced by the CerS inhibitor, fumonisin B1, and by 2-acetylaminofluorene (upon partial hepatectomy) [50]. Long term treatment with fumonisin B1 has also been shown to induce hyperplastic nodules [51]. Thus, enhanced rates of proliferation, which induce chronic hypoxia or changed levels of sphingoid long chain bases, might contribute to the development of focal fatty changes.
In summary, the current study might implicate SL synthesis and turnover as a putative regulatory mechanism in NAFLD. Since NAFLD is emerging as a risk factor in diabetes and cardiovascular disease [52], our data further imply that regulating the SL acyl chain length might be of vital importance in regulating a number of other diseases of lipid metabolism and transport.
Supplementary Material
Highlights.
Ceramide synthase 2 null mice are resistant to diet-induced obesity
Ceramide synthase 2 null mice showed reduced hepatic fatty acid uptake
C22-C24 sphingolipid regulate CD36/FAT expression
Acknowledgments
We thank Drs. Elad L. Laviad and Seung-Hoon Yang (Weizmann Institute of Science) and Dr. Sung-Chul Jung (Ewha Womans University) for their technical assistance, and Jessica R. Bame (Georgia Institute of Technology) for measurement of sphingolipids. This work was supported by the Minerva Foundation and the Israel Science Foundation (0888/11). W-J.P and J-W.P were supported by the National Research Foundation of Korea Grant funded by the Korean Government (Ministry of Education, Science and Technology) [NRF-2013R1A1A1076013 and NRF-2013K2A1A2053119].
Abbreviations
- CD36/FAT
fatty acid translocase
- CerS
ceramide synthase
- DRMs
detergent resistant membranes
- FABP
fatty acid binding protein
- FABPpm
plasma membrane fatty acid binding protein
- FATP
fatty acid transport protein
- FFA
free fatty acid
- HFD
high fat diet
- LCFA
long chain fatty acid
- NAFLD
nonalcoholic fatty liver disease
- SLs
sphingolipids
- SSO
sulfo-N-succinimidyl oleate
- TG
triacylglycerol
- VLC
very-long chain
Footnotes
Publisher's Disclaimer: This is a PDF file of an unedited manuscript that has been accepted for publication. As a service to our customers we are providing this early version of the manuscript. The manuscript will undergo copyediting, typesetting, and review of the resulting proof before it is published in its final citable form. Please note that during the production process errors may be discovered which could affect the content, and all legal disclaimers that apply to the journal pertain.
References
- 1.Pohl J, Ring A, Ehehalt R, Herrmann T, Stremmel W. New concepts of cellular fatty acid uptake: role of fatty acid transport proteins and of caveolae. Proc Nutr Soc. 2004;63:259–262. doi: 10.1079/PNS2004341. [DOI] [PubMed] [Google Scholar]
- 2.Abumrad N, Coburn C, Ibrahimi A. Membrane proteins implicated in long-chain fatty acid uptake by mammalian cells: CD36, FATP and FABPm. Biochim Biophys Acta. 1999;1441:4–13. doi: 10.1016/s1388-1981(99)00137-7. [DOI] [PubMed] [Google Scholar]
- 3.Doege H, Baillie RA, Ortegon AM, Tsang B, Wu Q, Punreddy S, et al. Targeted deletion of FATP5 reveals multiple functions in liver metabolism: alterations in hepatic lipid homeostasis. Gastroenterology. 2006;130:1245–1258. doi: 10.1053/j.gastro.2006.02.006. [DOI] [PubMed] [Google Scholar]
- 4.van Oort MM, van Doorn JM, Bonen A, Glatz JFC, van der Horst DJ, Rodenburg KW, et al. Insulin-induced translocation of CD36 to the plasma membrane is reversible and shows similarity to that of GLUT4. Biochim Biophys Acta. 2008;1781:61–71. doi: 10.1016/j.bbalip.2007.11.006. [DOI] [PubMed] [Google Scholar]
- 5.Luiken JJFP, Koonen DPY, Willems J, Zorzano A, Becker C, Fischer Y, et al. Insulin stimulates long-chain fatty acid utilization by rat cardiac myocytes through cellular redistribution of FAT/CD36. Diabetes. 2002;51:3113–3119. doi: 10.2337/diabetes.51.10.3113. [DOI] [PubMed] [Google Scholar]
- 6.Luiken JJFP, Dyck DJ, Han XX, Tandon NN, Arumugam Y, Glatz JFC, et al. Insulin induces the translocation of the fatty acid transporter FAT/CD36 to the plasma membrane. Am J Physiol Endocrinol Metab. 2002;282:E491–5. doi: 10.1152/ajpendo.00419.2001. [DOI] [PubMed] [Google Scholar]
- 7.Buqué X, Cano A, Miquilena-Colina ME, García-Monzón C, Ochoa B, Aspichueta P. High insulin levels are required for FAT/CD36 plasma membrane translocation and enhanced fatty acid uptake in obese Zucker rat hepatocytes. AJP: Endocrinology and Metabolism. 2012;303:E504–14. doi: 10.1152/ajpendo.00653.2011. [DOI] [PubMed] [Google Scholar]
- 8.Ring A, Le Lay S, Pohl J, Verkade P, Stremmel W. Caveolin-1 is required for fatty acid translocase (FAT/CD36) localization and function at the plasma membrane of mouse embryonic fibroblasts. Biochim Biophys Acta. 2006;1761:416–423. doi: 10.1016/j.bbalip.2006.03.016. [DOI] [PubMed] [Google Scholar]
- 9.Razani B, Combs TP, Wang XB, Frank PG, Park DS, Russell RG, et al. Caveolin-1-deficient mice are lean, resistant to diet-induced obesity, and show hypertriglyceridemia with adipocyte abnormalities. J Biol Chem. 2002;277:8635–8647. doi: 10.1074/jbc.M110970200. [DOI] [PubMed] [Google Scholar]
- 10.Pohl J, Ring A, Stremmel W. Uptake of long-chain fatty acids in HepG2 cells involves caveolae: analysis of a novel pathway. J Lipid Res. 2002;43:1390–1399. doi: 10.1194/jlr.M100404-JLR200. [DOI] [PubMed] [Google Scholar]
- 11.Levy M, Futerman AH. Mammalian ceramide synthases. IUBMB Life. 2010;62:347–356. doi: 10.1002/iub.319. [DOI] [PMC free article] [PubMed] [Google Scholar]
- 12.Pewzner-Jung Y, Park H, Laviad EL, Silva LC, Lahiri S, Stiban J, et al. A critical role for ceramide synthase 2 in liver homeostasis: I. alterations in lipid metabolic pathways. J Biol Chem. 2010;285:10902–10910. doi: 10.1074/jbc.M109.077594. [DOI] [PMC free article] [PubMed] [Google Scholar]
- 13.Pewzner-Jung Y, Brenner O, Braun S, Laviad EL, Ben-Dor S, Feldmesser E, et al. A critical role for ceramide synthase 2 in liver homeostasis: II. insights into molecular changes leading to hepatopathy. J Biol Chem. 2010;285:10911–10923. doi: 10.1074/jbc.M109.077610. [DOI] [PMC free article] [PubMed] [Google Scholar]
- 14.Park J-W, Park W-J, Kuperman Y, Boura-Halfon S, Pewzner-Jung Y, Futerman AH. Ablation of very long acyl chain sphingolipids causes hepatic insulin resistance in mice due to altered detergent-resistant membranes. Hepatology. 2013;57:525–532. doi: 10.1002/hep.26015. [DOI] [PubMed] [Google Scholar]
- 15.Zigdon H, Kogot-Levin A, Park JW, Goldschmidt R, Kelly S, Merrill AH, et al. Ablation of ceramide synthase 2 causes chronic oxidative stress due to disruption of the mitochondrial respiratory chain. J Biol Chem. 2013;288:4947–4956. doi: 10.1074/jbc.M112.402719. [DOI] [PMC free article] [PubMed] [Google Scholar]
- 16.Silva LC, Ben-David O, Pewzner-Jung Y, Laviad EL, Stiban J, Bandyopadhyay S, et al. Ablation of ceramide synthase 2 strongly affects biophysical properties of membranes. J Lipid Res. 2012;53:430–436. doi: 10.1194/jlr.M022715. [DOI] [PMC free article] [PubMed] [Google Scholar]
- 17.Ali M, Fritsch J, Zigdon H, Pewzner-Jung Y, Schütze S, Futerman AH. Altering the sphingolipid acyl chain composition prevents LPS/GLN-mediated hepatic failure in mice by disrupting TNFR1 internalization. Cell Death Dis. 2013;4:e929. doi: 10.1038/cddis.2013.451. [DOI] [PMC free article] [PubMed] [Google Scholar]
- 18.Park WJ, Park JW, Erez-Roman R, Kogot-Levin A, Bame JR, Tirosh B, et al. Protection of a ceramide synthase 2 null mouse from drug-induced liver injury: role of gap junction dysfunction and connexin 32 mislocalization. J Biol Chem. 2013;288:30904–30916. doi: 10.1074/jbc.M112.448852. [DOI] [PMC free article] [PubMed] [Google Scholar]
- 19.Lagakos WS, Gajda AM, Agellon L, Binas B, Choi V, Mandap B, et al. Different functions of intestinal and liver-type fatty acid-binding proteins in intestine and in whole body energy homeostasis. AJP: Gastrointestinal and Liver Physiology. 2011;300:G803–14. doi: 10.1152/ajpgi.00229.2010. [DOI] [PMC free article] [PubMed] [Google Scholar]
- 20.Storch J, Zhou YX, Lagakos WS. Metabolism of apical versus basolateral sn-2-monoacylglycerol and fatty acids in rodent small intestine. J Lipid Res. 2008;49:1762–1769. doi: 10.1194/jlr.M800116-JLR200. [DOI] [PMC free article] [PubMed] [Google Scholar]
- 21.Lagakos WS, Gajda AM, Agellon L, Binas B, Choi V, Mandap B, et al. Different functions of intestinal and liver-type fatty acid-binding proteins in intestine and in whole body energy homeostasis. AJP: Gastrointestinal and Liver Physiology. 2011;300:G803–14. doi: 10.1152/ajpgi.00229.2010. [DOI] [PMC free article] [PubMed] [Google Scholar]
- 22.Yen CLE, Cheong ML, Grueter C, Zhou P, Moriwaki J, Wong JS, et al. Deficiency of the intestinal enzyme acyl CoA:monoacylglycerol acyltransferase-2 protects mice from metabolic disorders induced by high-fat feeding. Nat Med. 2009;15:442–446. doi: 10.1038/nm.1937. [DOI] [PMC free article] [PubMed] [Google Scholar]
- 23.Alsted TJ, Nybo L, Schweiger M, Fledelius C, Jacobsen P, Zimmermann R, et al. Adipose triglyceride lipase in human skeletal muscle is upregulated by exercise training. AJP: Endocrinology and Metabolism. 2008;296:E445–E453. doi: 10.1152/ajpendo.90912.2008. [DOI] [PubMed] [Google Scholar]
- 24.Schweiger M, Schreiber R, Haemmerle G, Lass A, Fledelius C, Jacobsen P, et al. Adipose triglyceride lipase and hormone-sensitive lipase are the major enzymes in adipose tissue triacylglycerol catabolism. J Biol Chem. 2006;281:40236–40241. doi: 10.1074/jbc.M608048200. [DOI] [PubMed] [Google Scholar]
- 25.Coleman RA. Diacylglycerol acyltransferase and monoacylglycerol acyltransferase from liver and intestine. Meth Enzymol. 1992;209:98–104. doi: 10.1016/0076-6879(92)09013-s. [DOI] [PubMed] [Google Scholar]
- 26.Sullards MC, Liu Y, Chen Y, Merrill AH. Analysis of mammalian sphingolipids by liquid chromatography tandem mass spectrometry (LC-MS/MS) and tissue imaging mass spectrometry (TIMS) Biochim Biophys Acta. 2011;1811:838–853. doi: 10.1016/j.bbalip.2011.06.027. [DOI] [PMC free article] [PubMed] [Google Scholar]
- 27.Shaner RL, Allegood JC, Park H, Wang E, Kelly S, Haynes CA, et al. Quantitative analysis of sphingolipids for lipidomics using triple quadrupole and quadrupole linear ion trap mass spectrometers. J Lipid Res. 2009;50:1692–1707. doi: 10.1194/jlr.D800051-JLR200. [DOI] [PMC free article] [PubMed] [Google Scholar]
- 28.Laviad EL, Albee L, Pankova-Kholmyansky I, Epstein S, Park H, Merrill AH, et al. Characterization of ceramide synthase 2: tissue distribution, substrate specificity, and inhibition by sphingosine 1-phosphate. J Biol Chem. 2008;283:5677–5684. doi: 10.1074/jbc.M707386200. [DOI] [PubMed] [Google Scholar]
- 29.Bhat BG, Wang P, Coleman RA. Sphingosine inhibits rat hepatic monoacylglycerol acyltransferase in Triton X-100 mixed micelles and isolated hepatocytes. Biochemistry. 1995;34:11237–11244. doi: 10.1021/bi00035a033. [DOI] [PubMed] [Google Scholar]
- 30.Storch J, Corsico B. The emerging functions and mechanisms of mammalian fatty acid-binding proteins. Annu Rev Nutr. 2008;28:73–95. doi: 10.1146/annurev.nutr.27.061406.093710. [DOI] [PubMed] [Google Scholar]
- 31.Mullen TD, Spassieva S, Jenkins RW, Kitatani K, Bielawski J, Hannun YA, et al. Selective knockdown of ceramide synthases reveals complex interregulation of sphingolipid metabolism. J Lipid Res. 2011;52:68–77. doi: 10.1194/jlr.M009142. [DOI] [PMC free article] [PubMed] [Google Scholar]
- 32.Hajnóczky G, Gao E, Nomura T, Hoek JB, Thomas AP. Multiple mechanisms by which protein kinase A potentiates inositol 1,4,5-trisphosphate-induced Ca2+ mobilization in permeabilized hepatocytes. Biochem J. 1993;293(Pt 2):413–422. doi: 10.1042/bj2930413. [DOI] [PMC free article] [PubMed] [Google Scholar]
- 33.Richter K, Nessling M, Lichter P. Experimental evidence for the influence of molecular crowding on nuclear architecture. J Cell Sci. 2007;120:1673–1680. doi: 10.1242/jcs.03440. [DOI] [PubMed] [Google Scholar]
- 34.Harmon CM, Abumrad NA. Binding of sulfosuccinimidyl fatty acids to adipocyte membrane proteins: isolation and amino-terminal sequence of an 88-kD protein implicated in transport of long-chain fatty acids. J Membr Biol. 1993;133:43–49. doi: 10.1007/BF00231876. [DOI] [PubMed] [Google Scholar]
- 35.Coort SLM, Willems J, Coumans WA, van der Vusse GJ, Bonen A, Glatz JFC, et al. Sulfo-N-succinimidyl esters of long chain fatty acids specifically inhibit fatty acid translocase (FAT/CD36)-mediated cellular fatty acid uptake. Mol Cell Biochem. 2002;239:213–219. [PubMed] [Google Scholar]
- 36.Li Y, Dong J, Ding T, Kuo MS, Cao G, Jiang XC, et al. Sphingomyelin synthase 2 activity and liver steatosis: an effect of ceramide-mediated peroxisome proliferator-activated receptor γ2 suppression. Arterioscler Thromb Vasc Biol. 2013;33:1513–1520. doi: 10.1161/ATVBAHA.113.301498. [DOI] [PMC free article] [PubMed] [Google Scholar]
- 37.Fox TE, Bewley MC, Unrath KA, Pedersen MM, Anderson RE, Jung DY, et al. Circulating sphingolipid biomarkers in models of type 1 diabetes. J Lipid Res. 2011;52:509–517. doi: 10.1194/jlr.M010595. [DOI] [PMC free article] [PubMed] [Google Scholar]
- 38.Cinar R, Godlewski G, Liu J, Tam J, Jourdan T, Mukhopadhyay B, et al. Hepatic cannabinoid-1 receptors mediate diet-induced insulin resistance by increasing de novo synthesis of long-chain ceramides. Hepatology. 2014;59:143–153. doi: 10.1002/hep.26606. [DOI] [PMC free article] [PubMed] [Google Scholar]
- 39.He J, Lee JH, Febbraio M, Xie W. The emerging roles of fatty acid translocase/CD36 and the aryl hydrocarbon receptor in fatty liver disease. Exp Biol Med. 2011;236:1116–1121. doi: 10.1258/ebm.2011.011128. [DOI] [PubMed] [Google Scholar]
- 40.Coburn CT, Knapp FF, Febbraio M, Beets AL, Silverstein RL, Abumrad NA. Defective uptake and utilization of long chain fatty acids in muscle and adipose tissues of CD36 knockout mice. J Biol Chem. 2000;275:32523–32529. doi: 10.1074/jbc.M003826200. [DOI] [PubMed] [Google Scholar]
- 41.Clugston RD, Yuen JJ, Hu Y, Abumrad NA, Berk PD, Goldberg IJ, et al. CD36-deficient mice are resistant to alcohol- and high-carbohydrate-induced hepatic steatosis. J Lipid Res. 2014;55:239–246. doi: 10.1194/jlr.M041863. [DOI] [PMC free article] [PubMed] [Google Scholar]
- 42.Koonen DPY, Jacobs RL, Febbraio M, Young ME, Soltys CLM, Ong H, et al. Increased Hepatic CD36 Expression Contributes to Dyslipidemia Associated With Diet-Induced Obesity. Diabetes. 2007;56:2863–2871. doi: 10.2337/db07-0907. [DOI] [PubMed] [Google Scholar]
- 43.Miquilena-Colina ME, Lima-Cabello E, Sánchez-Campos S, García-Mediavilla MV, Fernández-Bermejo M, Lozano-Rodríguez T, et al. Hepatic fatty acid translocase CD36 upregulation is associated with insulin resistance, hyperinsulinaemia and increased steatosis in non-alcoholic steatohepatitis and chronic hepatitis C. Gut. 2011;60:1394–1402. doi: 10.1136/gut.2010.222844. [DOI] [PubMed] [Google Scholar]
- 44.Pohl J, Ring A, Korkmaz Ü, Ehehalt R, Stremmel W. FAT/CD36-mediated long-chain fatty acid uptake in adipocytes requires plasma membrane rafts. Mol Biol Cell. 2005;16:24–31. doi: 10.1091/mbc.E04-07-0616. [DOI] [PMC free article] [PubMed] [Google Scholar]
- 45.Zhou J, Febbraio M, Wada T, Zhai Y, Kuruba R, He J, et al. Hepatic fatty acid transporter Cd36 is a common target of LXR, PXR, and PPARgamma in promoting steatosis. Gastroenterology. 2008;134:556–567. doi: 10.1053/j.gastro.2007.11.037. [DOI] [PubMed] [Google Scholar]
- 46.Abumrad NA, El-Maghrabi MR, Amri EZ, Lopez E, Grimaldi PA. Cloning of a rat adipocyte membrane protein implicated in binding or transport of long-chain fatty acids that is induced during preadipocyte differentiation. Homology with human CD36. J Biol Chem. 1993;268:17665–17668. [PubMed] [Google Scholar]
- 47.Goudriaan JR, den Boer MAM, Rensen PCN, Febbraio M, Kuipers F, Romijn JA, et al. CD36 deficiency in mice impairs lipoprotein lipase-mediated triglyceride clearance. J Lipid Res. 2005;46:2175–2181. doi: 10.1194/jlr.M500112-JLR200. [DOI] [PubMed] [Google Scholar]
- 48.Brawer MK, Austin GE, Lewin KJ. Focal fatty change of the liver, a hitherto poorly recognized entity. Gastroenterology. 1980;78:247–252. [PubMed] [Google Scholar]
- 49.Paulson EK, Baker ME, Spritzer CE, Leder RA, Gulliver DJ, Meyers WC. Focal fatty infiltration: a cause of nontumorous defects in the left hepatic lobe during CT arterial portography. J Comput Assist Tomogr. 1993;17:590–595. [PubMed] [Google Scholar]
- 50.van der Westhuizen L, Gelderblom WCA, Shephard GS, Swanevelder S. Disruption of sphingolipid biosynthesis in hepatocyte nodules: selective proliferative stimulus induced by fumonisin B1. Toxicology. 2004;200:69–75. doi: 10.1016/j.tox.2004.03.011. [DOI] [PubMed] [Google Scholar]
- 51.Lumlertdacha S, Lovell RT, Shelby RA, Lenz SD, Kemppainen BW. Growth, hematology, and histopathology of channel catfish, Ictalurus punctatus, fed toxins from Fusarium moniliforme. Aquaculture. 1995;130:201–218. [Google Scholar]
- 52.Musso G, Gambino R, Cassader M. Recent insights into hepatic lipid metabolism in non-alcoholic fatty liver disease (NAFLD) Prog Lipid Res. 2009;48:1–26. doi: 10.1016/j.plipres.2008.08.001. [DOI] [PubMed] [Google Scholar]
Associated Data
This section collects any data citations, data availability statements, or supplementary materials included in this article.


