

Abstract
Background
Angiogenesis plays a role in tumor growth and is partly mediated by factors in both the fibroblast growth factor (FGF) and vascular endothelial growth factor (VEGF) pathways. Durable clinical responses with VEGF tyrosine kinase inhibitors (TKIs) may be limited by intrinsic tumor resistance. We hypothesized that FGF signaling may impact clinical responses to sorafenib.
Methods
Nephrectomy material was available from 40 patients with metastatic renal cell carcinoma (RCC) enrolled in a phase II clinical trial of sorafenib ± interferon (ClinicalTrials.gov Identifier NCT00126594). Fibroblast growth factor receptor 1 (FGFR1) and fibroblast growth factor receptor substrate 2 alpha (FRS2α) expression was assessed by in situ hybridization and immunofluorescence, respectively. The relationship between fibroblast growth factor pathway marker levels and progression-free survival (PFS) was analyzed using Kaplan-Meier and Cox proportional hazards regression methods.
Results
Univariate analysis indicated that more intense FGFR1 staining was associated with shorter PFS (log-rank P = 0.0452), but FRS2α staining was not significantly associated with PFS (log-rank P = 0.2610). Multivariate Cox proportional hazards regression models were constructed for FGFR1 and FRS2α individually, adjusting for baseline Eastern Cooperative Oncology Group performance status, treatment arm and anemia status. When adjusted for each of these variables, the highest intensity level of FGFR1 (level 3 or 4) had increased progression risk relative to the lowest intensity level of FGFR1 (level 1) (P = 0.0115). The highest intensity level of FRS2α (level 3 or 4) had increased progression risk relative to the lowest intensity level of FRS2α (level 1) (P = 0.0126).
Conclusions
Increased expression of FGFR1 and FRS2α was associated with decreased PFS among patients with metastatic RCC treated with sorafenib. The results suggest that FGF pathway activation may impact intrinsic resistance to VEGF receptor inhibition.
Electronic supplementary material
The online version of this article (doi:10.1186/s12885-015-1302-1) contains supplementary material, which is available to authorized users.
Keywords: FGF, Renal cell carcinoma, VEGF, Sorafenib
Background
Cancers of the kidney and renal pelvis affect more than 61,000 patients annually and the most common pathological subtype is clear cell renal cell carcinoma (ccRCC) [1]. Over 13,000 patients die annually from RCC, making it one of the top 10 leading causes of cancer deaths. Contemporary treatments include inhibitors of vascular endothelial growth factor receptor (VEGFR) and mammalian target of rapamycin (mTOR); the choice of inhibitors is currently empirical and resistance to treatment typically occurs [2].
Angiogenesis plays a key role in the growth of many tumors and is mediated by growth factors in both the fibroblast growth factor (FGF) and VEGF families [3,4]. Durable clinical responses with current VEGF tyrosine kinase inhibitors (TKIs) may be limited by acquired or intrinsic tumor resistance. Acquired resistance to VEGF blockade in various mouse models appears to be via activation of VEGF-independent pathways with secondary activation of proangiogenic ligands from the FGF family [5,6]. Fibroblast growth factor-2 expression is increased in post-VEGF TKI treatment biopsies further supporting the role of FGF signaling in acquired resistance [7].
There are four FGF tyrosine kinase membrane receptors (FGFRs): FGFR1, −2, −3 and −4 [8]. FGFs bind their receptors to mediate cell proliferation, angiogenesis, and aberrant pathway activation associated with tumor neovascularization. Downstream targets of FGFR signaling include fibroblast growth factor receptor substrate 2 alpha (FRS2α), which promotes cell proliferation [9]. Intrinsic resistance to TKIs is associated with poor clinical outcomes and overexpression of FGFR1,-2 has been observed in RCC [10,11]. However, the impact of expression of FGF signaling components on response to first-line treatment TKIs is unknown. We hypothesized that FGF signaling may impact response to sorafenib, a TKI whose targets include VEGFR2 and platelet-derived growth factor receptor (PDGFR) [12].
Our retrospective analysis of a phase II clinical trial suggest that increased expression of FGFR1 and FRS2α is associated with decreased progression-free survival (PFS) in patients with RCC treated with first-line sorafenib. The results suggest that FGF pathway activation may be associated with intrinsic tumor resistance to sorafenib.
Methods
Clinical samples
In a prospective phase II trial, untreated patients with metastatic clear cell RCC were randomly allocated to receive sorafenib 400 mg orally twice daily with or without subcutaneous interferon α (0.5 million units twice daily). Eighty participants were enrolled from June 25, 2005 through June 18, 2007 [13]. Primary endpoints included the objective response rate (ORR) and safety. Secondary endpoints included progression-free survival (PFS) and overall survival (OS). All patients had signed an informed consent approved by The University of Texas MD Anderson Cancer Center institutional review board under protocols 2003–0982 and 2004–0526 (ClinicalTrials.gov Identifier NCT00126594). An experienced genitourinary pathologist (P.T.) centrally reviewed hematoxylin-eosin slides for available patient tumors (n = 40) in order to confirm histological classification and standardize pathologic features.
Statistical methods
Associations between marker levels and clinical variables (sex, ethnicity, performance status, prognostic risk, and anemia defined as hemoglobin level <14 g/dL for men or <12 g/dL for women) were analyzed using the Fisher’s exact test. PFS was analyzed with regard to marker levels for FGFR1 and FRS2α in a cohort of 40 patients with available nephrectomy specimens. PFS was defined as the number of months from the start of chemotherapy, until a patient’s death or disease progression. Patients whose disease had not progressed were censored at the last follow-up date. Patients whose disease had not progressed before starting a new treatment were censored at the new treatment start date. The relationship between tumor marker levels and PFS was analyzed using Kaplan-Meier and Cox proportional hazards regression methods. Because the phase II study used the Pocock-Simon minimization method [14] to randomize patients to treatment arms, the balancing variables were included in the multivariate models along with the treatment arm [15]. These variables included ECOG performance status (1 vs 0) and baseline anemia (No vs Yes, where Yes is based on Hb < 14 for males and Hb < 12 for females). Although randomization procedures also balanced treatment arms on nephrectomy (No vs Yes) and LDH (Not elevated vs Elevated, where Elevated is > 1.5× ULN), none of the 40 patients in the biomarker study had elevated LDH and all had a nephrectomy; therefore, the multivariate models were not adjusted for these two factors. Other prognostic factors, such as corrected calcium, were not available. All P-values were two tailed and considered significant at α < 0.05. Analyses were conducted using SAS for Windows (release 9.1, SAS Institute, Cary, NC, USA).
Tissue microarrays
Tissue microarrays were generated using an arrayer (Beecher Instruments, Inc., Sun Prairie, WI) with 0.6-mm cores in triplicate for each case. The slides were scanned with the Leica Microsystem (Leica Microsystems Inc. Buffalo Grove, IL) at 20X using the Ariol Scan Station. The Ariol system (Applied Imaging, San Jose, CA) was used to analyze images. Areas of viable tumor were gated by a genitourinary pathologist (P.T.) for analysis; areas of non-viable tumor and non-tumor tissue were excluded. A cytoplasmic algorithm was applied using the multi-stain version of the software. Digitally, the DAB stained cells would be positive and the negative cells stained with hematoxlin would be measured for area. We used TMA Navigator software (Applied Imaging, San Jose, CA) to quantitate the tumor (scale of 0–100) intensity and stratification of biomarkers into quartiles for each core at 20X magnification.
Histology, In Situ Hybridization (ISH), and Immunofluorescence (IF)
Four-micron paraffin sections are cut and dried at room temperature for 30 minutes prior to being placed in the oven at 56°C overnight. The in situ hybridization for FGFR1 was performed using a protocol as previously described [16]. Immunofluorescence using primary antibodies (FRS2α) was performed as previously described [17]. TO-PRO-3 was used as a nuclear counterstain. The Ariol imaging platform was used to stratify the specimens based on intensity of staining for FGF biomarkers (FGFR1 ISH, FRS2α IF); the stratification was independently confirmed by a pathologist (P.T.).
Results
The baseline patient characteristics are denoted in supplemental information, Table 1 for the previously reported phase II clinical trial of first-line sorafenib therapy in metastatic RCC [13]. Seventy-three percent of study participants were male. Participants had an ECOG status of 0 (68%) or 1 (32%), and all had a Memorial Sloan-Kettering Cancer Center (MSKCC) prognostic risk of low or intermediate except for 1 patient categorized as poor and 1 patient with missing data. Race/ethnicity was white, non-Hispanic for 80% and Hispanic, Black, or Native American for 20% (Additional file 1: Table S1). At baseline, 37% of the patients had anemia and 63% did not. Patient age at registration ranged from 45 to 83 years of age (mean 62.38, SD 8.59).
Table 1.
Univariate cox proportional hazards regression models of progression free survival from chemotherapy start
| Variable | Progressed | Total | HR | 95% CI | P |
|---|---|---|---|---|---|
| PFS (29 of 40 progressed) | |||||
| Treatment arm | |||||
| Sorafenib | 19 | 22 | 2.05 | 0.95, 4.45 | 0.0683 |
| Sorafenib + interferon | 10 | 18 | 1.00 | ||
| ECOG performance status | |||||
| 1 | 10 | 13 | 4.95 | 2.07, 11.84 | 0.0003 |
| 0 | 19 | 27 | 1.00 | ||
| Anemia | |||||
| Yes | 12 | 15 | 2.37 | 1.09, 5.17 | 0.0299 |
| No | 17 | 25 | 1.00 | ||
| FGFR1 | |||||
| (level 1) | 3 | 8 | 1.00 | ||
| (level 2) | 15 | 19 | 3.54 | 1.02, 12.29 | 0.0463 |
| (level 3 or 4) | 11 | 13 | 4.56 | 1.25, 16.66 | 0.0218 |
| FRS2α | |||||
| (level 1) | 3 | 7 | 1.00 | ||
| (level 2) | 17 | 21 | 2.07 | 0.60, 7.18 | 0.2498 |
| (level 3 or 4) | 9 | 12 | 2.87 | 0.77, 10.66 | 0.1146 |
ECOG, Eastern Cooperative Oncology Group; FGFR1, fibroblast growth factor receptor 1; FRS2α, fibroblast growth factor receptor substrate 2 alpha; HR, hazard ratio.
To examine the relationship between expression of FGF biomarkers and PFS, a tissue microarray representing clear cell RCC specimens from patients with available tumor and enrolled on the trial was constructed. Expression of FGFR1 and FRS2α were analyzed by ISH/IF and stratified into 3 categories (low, level 1; intermediate, level 2; high, level 3 or 4) (Figure 1). We did not observe an association with FGFR1 intensity with patient characteristics (sex, ethnicity, ECOG performance status, MSKCC prognostic risk category or anemia). Only baseline anemia was associated with FRS2α intensity (P = 0.0168), Additional file 2: Table S2 and Additional file 3: Table S3.
Figure 1.
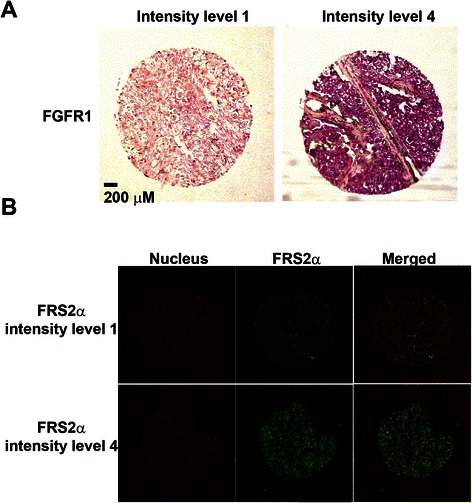
Fibroblast growth factor receptor 1 and fibroblast growth factor receptor substrate 2 alpha expression. Intensity levels were stratified using the Ariol imaging platform (higher number corresponds to higher intensity) in renal cell carcinoma. Non-tumor tissue was excluded from analysis. (A)In situ hybridization for localization of FGFR1 message. (B) FRS2α immunofluorescence.
In univariate models, PFS was associated with ECOG performance status (P = 0.0003), anemia (P = 0.0299) and FGFR1 expression (P = 0.0218), Table 1. The median PFS for the total sample was 7.56 (95% CI 4.07 to 10.25) months. Median PFS by FGFR1 intensity was 5.49 (95% CI 3.48 to 11.07) months for those with the highest intensities (level 3 or 4), 5.52 (95% CI 3.55 to 10.25) months for those with intermediate intensity (level 2), and 11.14 (95% CI 9.20, not attained) months for those with the lowest FGFR1 intensity (level 1). Similarly, median PFS by FRS2α intensity was 4.07 (95% CI 1.81 to 11.07) months for those with the highest intensities (level 3 or 4), 7.56 (95% CI 3.68 to 10.25) months for those with intermediate intensity (level 2), and 11.14 (95% CI 5.45, not attained) months for those with lowest FRS2α intensity (level 1). Kaplan-Meier curves indicated that more intense FGFR1 staining was associated with shorter PFS (P = 0.0452), but FRS2α staining was not significantly associated with PFS (P = 0.2610) (Figures 2 and 3).
Figure 2.
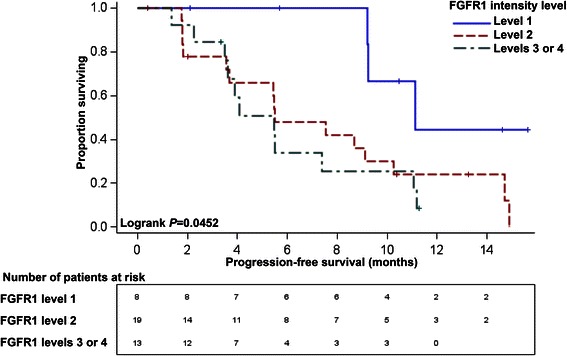
Progression-free survival curves (PFS) with number at risk stratified by FGFR1 intensity. The Ariol imaging platform was used to stratify the specimens based on intensity of in situ hybridization staining for FGFR1. Non-tumor tissue was excluded from analysis. The differences across FGFR1 intensity strata were statistically significant with better progression-free survival among those patients with the lowest FGFR1 intensity (level 1) in univariate analysis; P = 0.0452.
Figure 3.
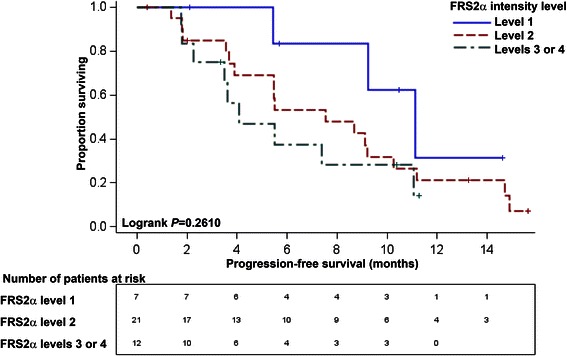
Progression-free survival curves (PFS) with number at risk stratified by FRS2α intensity. The Ariol imaging platform was used to stratify the specimens based on intensity of immunofluorescence staining for FRS2α. Non-tumor tissue was excluded from analysis. The differences across FRS2α intensity strata were not statistically significant in univariate analysis; P = 0.2610.
ECOG performance status, baseline anemia, nephrectomy and LDH were balancing variables used during the randomization of patients to treatment arm. Multivariate Cox proportional hazards regression models were constructed for FGFR1 and FRS2α individually, adjusting for baseline ECOG performance status, treatment arm and baseline anemia (Tables 2 and 3). When adjusted for each of these factors, the risk of progression was significantly higher for tumors with the highest intensity level of FGFR1 (level 3 or 4) (HR 5.92, 95% CI 1.49 to 23.56, P = 0.0115) and for those with an intermediate intensity level of FGFR1 (level 2) (HR 4.21, 95% CI 1.13 to 15.72, P = 0.0326) relative to the risk among those with the lowest intensity level of FGFR1 (level 1). Tumors with the highest intensity level of FRS2α (level 3 or 4) had increased risk of progression relative to those with the lowest intensity level of FRS2α (level 1) (HR 7.32, 95% CI 1.53 to 34.97, P = 0.0126); progression risk did not differ significantly between those with intermediate versus low FRS2α intensity (level 2 vs. level 1) (HR 2.96, 95% CI 0.76 to 11.45, P = 0.1161). Our data indicates that increased expression of FGFR1 and FRS2α is associated with a worse PFS on first-line sorafenib treatment.
Table 2.
Multivariate cox proportional hazards regression model to predict progression-free survival from chemotherapy start by FGFR1 intensity level
| Variable | Level | Hazard ratio | 95% Hazard ratio confidence limits | Probability > Chi square test | |
|---|---|---|---|---|---|
| Treatment arm | Sorafenib vs. Sorafenib + interferon | 1.581 | 0.697 | 3.585 | 0.2725 |
| ECOG Status | 1 vs. 0 | 4.630 | 1.417 | 15.134 | 0.0112 |
| Anemia | Yes vs. No | 1.481 | 0.531 | 4.131 | 0.4535 |
| FGFR1 Intensity | (3 or 4) vs. 1 | 5.925 | 1.490 | 23.561 | 0.0115 |
| 2 vs. 1 | 4.209 | 1.126 | 15.725 | 0.0326 | |
ECOG, Eastern Cooperative Oncology Group; FGFR1, fibroblast growth factor receptor 1.
Table 3.
Multivariate cox proportional hazards regression model to predict progression-free survival from chemotherapy start by FRS2α intensity level
| Variable | Level | Hazard ratio | 95% Hazard ratio confidence limits | Probability > Chi square test | |
|---|---|---|---|---|---|
| Treatment arm | Sorafenib vs. Sorafenib + interferon | 1.915 | 0.850 | 4.314 | 0.1171 |
| ECOG Status | 1 vs. 0 | 4.651 | 1.508 | 14.341 | 0.0075 |
| Anemia | Yes vs. No | 1.831 | 0.628 | 5.342 | 0.2683 |
| FRS2α Intensity | (3 or 4) vs. 1 | 7.318 | 1.531 | 34.971 | 0.0126 |
| 2 vs. 1 | 2.959 | 0.765 | 11.449 | 0.1161 | |
ECOG, Eastern Cooperative Oncology Group; FRS2α, fibroblast growth factor receptor substrate 2 alpha.
Discussion
Patients that do not initially benefit from tyrosine kinase inhibition may have intrinsically resistant tumors. We investigated expression of FGF pathway components in patients with metastatic RCC treated in a randomized phase II clinical trial that yielded no differences in PFS between sorafenib versus sorafenib + interferon α [13]. In our current study, expression of FGFR1 and FRS2α was not associated with MKSCC prognostic risk categories. Using univariate and multivariate analyses, we observed that increased expression of FGFR1 is associated with a shorter PFS in patients treated with first-line sorafenib. In the phase II trial design, to balance the prognostic factors between treatment arms, the Pocock-Simon minimization method was used to randomize patients and balance prognostic factors such as ECOG performance status, baseline anemia, nephrectomy, and LDH. The highest FRS2α expression levels were associated with a shorter PFS after adjustment for study treatment, baseline anemia or performance status.
Activation of VEGF-independent pathways such as FGF signaling can promote cell proliferation, cell migration and tumorigenesis [5,6]. VEGFR2 blockade transiently stops tumor growth and is followed by tumor progression and restoration of tumor-associated endothelium. Blockade of the FGF pathway using adenoviral delivery of a soluble FGFR2, which acts as a FGF-trap, decreases secondary angiogenesis after VEGFR2 blockade suggesting that FGF inhibition may block acquired VEGF-independent pathways [5]. Consistent with this hypothesis, soluble high affinity decoy FGF receptors inhibit cell proliferation and treatment with a FGF ligand trap blocks VEGF-independent reactivation of tumor angiogenesis in a mouse model of pancreatic neuroendocrine tumors [4,18].
All currently approved targeted therapies for metastatic RCC (sunitinib, sorafenib, temsirolimus, everolimus, bevacizumab, pazopanib and axitinib) lack FGFR activity [19]. In a phase II study of dovitinib, a TKI that inhibits FGFR and VEGFR, as second-line therapy in metastatic RCC, the disease control rate ≥ 4 months was 51% [20]. However, no amplification of FGFR1,-2,-3 by PCR was detected in archival tissue suggesting that PCR may not accurately reflect FGF activation after progression on first-line therapy. In a phase III trial comparing dovitinib with sorafenib as third-line targeted therapy in metastatic RCC, there were no differences in efficacy outcomes suggesting that there may be other mechanisms of VEGF-targeted therapy than FGF activation [21].
Our study has several limitations. Although the samples were part of a randomized clinical trial, our sample size (N = 40) was small in comparison to prior studies [20,21] as tissue was not available from all enrolled patients, limiting the validity of the observations to the cohort. We did not directly compare our ISH/IF assay with other FGF assays such as PCR amplification of FGFR or FGF serum levels. RCC has intratumoral heterogeneity and we attempted to control for macroscopic heterogeneity by using the Ariol platform to exclude stroma and stratify the ISH/IF intensities, however it is unknown whether FGFR1/FRS2α expression in FFPE nephrectomy samples is concordant with expression in distant metastases [22,23]. The Ariol platform, as an automated quantitative analysis, has been studied with other biomarkers with concordance between manual and automated scoring [24], however it is unknown the limitations of our IHC/IF assay with respect to formalin-fixed paraffin-embedded age or fixation conditions. The study was retrospective and FGF activation was not used in the initial stratification of treatment arms. There are also likely additional mechanisms beyond FGF activation [25] that contribute to intrinsic TKI resistance and we did not evaluate other commonly used TKIs such as pazopanib or sunitinib. Future investigation is warranted to determine whether these markers are associated with response to other TKIs.
The results from our study, which used FGFR1 ISH and FRS2α IF to assess FGF activation pre-treatment, could be used to build predictive models in RCC to prospectively identify patients who would benefit from therapeutic strategies targeting both VEGF and FGF signaling in the first-line setting. FGF pathway activation may contribute to intrinsic VEGF TKI resistance, or angiogenesis in tumors with FGF activation may be less dependent on VEGF-mediated pathways. Predictive biomarkers of intrinsic VEGF TKI resistance are lacking and the efficacy of dual inhibition of FGF and VEGF in the subset of patients with increased FGFR1 expression prior to treatment requires further study.
Conclusions
Increased expression of FGFR1 or FRSα was associated with decreased PFS in a phase II clinical trial of patients with metastatic RCC treated with first-line sorafenib. The results suggest that FGF pathway activation may be associated with an intrinsic resistance to VEGF receptor inhibition.
Acknowledgements
This study was funded in part by Bristol-Myers Squibb. The funders had no role in study design, data collection and analysis, decision to publish, or preparation of the manuscript. T.H.H. is supported by funding from the Gloria A. and Thomas J. Dutson, Jr. Kidney Research Endowment, a Kathryn H. and Roger Penske Career Development Award to Support Medical Research, Mayo Clinic CR5 Program, and a US National Institutes of Health (NIH) grant (K12CA90628).
Abbreviations
- ccRCC
Clear cell renal cell carcinoma
- ECOG
Eastern Cooperative Oncology Group
- FGF
Fibroblast growth factor
- FGFR1
Fibroblast growth factor receptor 1
- FRS2α
Fibroblast growth factor receptor substrate 2 alpha
- IF
Immunofluorescence
- ISH
In situ hybridization
- MKSCC
Memorial Sloan-Kettering Cancer Center
- ORR
Objective response rate
- PDGFR
Platelet-derived growth factor
- PFS
Progression-free survival
- TKI
Tyrosine kinase inhibitor
- VEGF
Vascular endothelial growth factor
Additional files
Patient characteristics.
Association of FGFR1 Intensity With Patient Characteristics.
Association of FRS2α Intensity With Patient Characteristics.
Footnotes
Thai H Ho and Xian-De Liu contributed equally to this work.
Competing interests
Eric Jonasch: Bristol-Myers Squibb (research funding). All other authors declare that they have no competing interests.
Authors’ contributions
THH, XDL, EJ participated in the design, conception, and coordination of the study and drafted the manuscript. AH, PT, FW constructed the tissue microarrays and performed the in situ and immunofluorescence. PT reviewed the pathology. CLW and MMJ performed the statistical analysis. All authors read and approved the final manuscript.
Contributor Information
Thai H Ho, Email: ho.thai@mayo.edu.
Xian-De Liu, Email: XLiu10@mdanderson.org.
Yanqing Huang, Email: yhuang@ibt.tamhsc.edu.
Carla L Warneke, Email: cwarneke@mdanderson.org.
Marcella M Johnson, Email: mmjohnso@mdanderson.org.
Anh Hoang, Email: anhoang@mdanderson.org.
Pheroze Tamboli, Email: ptamboli@mdanderson.org.
Fen Wang, Email: fwang@ibt.tamhsc.edu.
Eric Jonasch, Email: ejonasch@mdanderson.org.
References
- 1.Siegel RL, Miller KD, Jemal A. Cancer statistics, 2015. CA Cancer J Clin. 2015;65(1):5–29. doi: 10.3322/caac.21254. [DOI] [PubMed] [Google Scholar]
- 2.Atkins MB, Bukowski RM, Escudier BJ, Figlin RA, Hudes GH, Kaelin WG, Jr, et al. Innovations and challenges in renal cancer: summary statement from the Third Cambridge Conference. Cancer. 2009;115(10 Suppl):2247–51. doi: 10.1002/cncr.24229. [DOI] [PMC free article] [PubMed] [Google Scholar]
- 3.Bhide RS, Lombardo LJ, Hunt JT, Cai ZW, Barrish JC, Galbraith S, et al. The antiangiogenic activity in xenograft models of brivanib, a dual inhibitor of vascular endothelial growth factor receptor-2 and fibroblast growth factor receptor-1 kinases. Mol Cancer Ther. 2010;9(2):369–78. doi: 10.1158/1535-7163.MCT-09-0472. [DOI] [PubMed] [Google Scholar]
- 4.Allen E, Walters IB, Hanahan D. Brivanib, a dual FGF/VEGF inhibitor, is active both first and second line against mouse pancreatic neuroendocrine tumors developing adaptive/evasive resistance to VEGF inhibition. Clin Cancer Res. 2011;17(16):5299–310. doi: 10.1158/1078-0432.CCR-10-2847. [DOI] [PMC free article] [PubMed] [Google Scholar]
- 5.Casanovas O, Hicklin DJ, Bergers G, Hanahan D. Drug resistance by evasion of antiangiogenic targeting of VEGF signaling in late-stage pancreatic islet tumors. Cancer Cell. 2005;8(4):299–309. doi: 10.1016/j.ccr.2005.09.005. [DOI] [PubMed] [Google Scholar]
- 6.Welti JC, Gourlaouen M, Powles T, Kudahetti SC, Wilson P, Berney DM, et al. Fibroblast growth factor 2 regulates endothelial cell sensitivity to sunitinib. Oncogene. 2010;30(10):1183–93. doi: 10.1038/onc.2010.503. [DOI] [PubMed] [Google Scholar]
- 7.Sharpe K, Stewart GD, Mackay A, Van Neste C, Rofe C, Berney D, et al. The effect of VEGF-targeted therapy on biomarker expression in sequential tissue from patients with metastatic clear cell renal cancer. Clin Cancer Res. 2013;19(24):6924–34. doi: 10.1158/1078-0432.CCR-13-1631. [DOI] [PubMed] [Google Scholar]
- 8.Dempke WC, Zippel R. Brivanib, a novel dual VEGF-R2/bFGF-R inhibitor. Anticancer Res. 2010;30(11):4477–83. [PubMed] [Google Scholar]
- 9.Sato T, Gotoh N. The FRS2 family of docking/scaffolding adaptor proteins as therapeutic targets of cancer treatment. Expert Opin Ther Targets. 2009;13(6):689–700. doi: 10.1517/14728220902942330. [DOI] [PubMed] [Google Scholar]
- 10.Busch J, Seidel C, Weikert S, Wolff I, Kempkensteffen C, Weinkauf L, et al. Intrinsic resistance to tyrosine kinase inhibitors is associated with poor clinical outcome in metastatic renal cell carcinoma. BMC Cancer. 2011;11:295. doi: 10.1186/1471-2407-11-295. [DOI] [PMC free article] [PubMed] [Google Scholar]
- 11.Tsimafeyeu I, Demidov L, Stepanova E, Wynn N, Ta H. Overexpression of fibroblast growth factor receptors FGFR1 and FGFR2 in renal cell carcinoma. Scand J Urol Nephrol. 2011;45(3):190–5. doi: 10.3109/00365599.2011.552436. [DOI] [PubMed] [Google Scholar]
- 12.Ahmad T, Eisen T. Kinase inhibition with BAY 43–9006 in renal cell carcinoma. Clin Cancer Res. 2004;10(18 Pt 2):6388S–92. doi: 10.1158/1078-0432.CCR-040028. [DOI] [PubMed] [Google Scholar]
- 13.Jonasch E, Corn P, Pagliaro LC, Warneke CL, Johnson MM, Tamboli P, et al. Upfront, randomized, phase 2 trial of sorafenib versus sorafenib and low-dose interferon alfa in patients with advanced renal cell carcinoma: clinical and biomarker analysis. Cancer. 2010;116(1):57–65. doi: 10.1002/cncr.24685. [DOI] [PMC free article] [PubMed] [Google Scholar]
- 14.Pocock SJ, Simon R. Sequential treatment assignment with balancing for prognostic factors in the controlled clinical trial. Biometrics. 1975;31(1):103–15. doi: 10.2307/2529712. [DOI] [PubMed] [Google Scholar]
- 15.Kahan BC, Morris TP. Improper analysis of trials randomised using stratified blocks or minimisation. Stat Med. 2012;31(4):328–40. doi: 10.1002/sim.4431. [DOI] [PubMed] [Google Scholar]
- 16.Yang F, Zhang Y, Ressler SJ, Ittmann MM, Ayala GE, Dang TD, et al. FGFR1 is essential for prostate cancer progression and metastasis. Cancer Res. 2013;73(12):3716–24. doi: 10.1158/0008-5472.CAN-12-3274. [DOI] [PMC free article] [PubMed] [Google Scholar]
- 17.Zhang Y, Zhang J, Lin Y, Lan Y, Lin C, Xuan JW, et al. Role of epithelial cell fibroblast growth factor receptor substrate 2alpha in prostate development, regeneration and tumorigenesis. Development. 2008;135(4):775–84. doi: 10.1242/dev.009910. [DOI] [PubMed] [Google Scholar]
- 18.Li D, Wei X, Xie K, Chen K, Li J, Fang J. A novel decoy receptor fusion protein for FGF-2 potently inhibits tumour growth. Br J Cancer. 2014;111(1):68–77. doi: 10.1038/bjc.2014.282. [DOI] [PMC free article] [PubMed] [Google Scholar]
- 19.Ho TH, Jonasch E. Axitinib in the treatment of metastatic renal cell carcinoma. Future Oncol. 2011;7(11):1247–53. doi: 10.2217/fon.11.107. [DOI] [PubMed] [Google Scholar]
- 20.Escudier B, Grunwald V, Ravaud A, Ou YC, Castellano D, Lin CC, et al. Phase II results of dovitinib (TKI258) in patients with metastatic renal cell cancer. Clin Cancer Res. 2014;20(11):3012–22. doi: 10.1158/1078-0432.CCR-13-3006. [DOI] [PubMed] [Google Scholar]
- 21.Motzer RJ, Porta C, Vogelzang NJ, Sternberg CN, Szczylik C, Zolnierek J, et al. Dovitinib versus sorafenib for third-line targeted treatment of patients with metastatic renal cell carcinoma: an open-label, randomised phase 3 trial. Lancet Oncol. 2014;15(3):286–96. doi: 10.1016/S1470-2045(14)70030-0. [DOI] [PMC free article] [PubMed] [Google Scholar]
- 22.Gerlinger M, Horswell S, Larkin J, Rowan AJ, Salm MP, Varela I, et al. Genomic architecture and evolution of clear cell renal cell carcinomas defined by multiregion sequencing. Nat Genet. 2014;46(3):225–33. doi: 10.1038/ng.2891. [DOI] [PMC free article] [PubMed] [Google Scholar]
- 23.Gerlinger M, Rowan AJ, Horswell S, Larkin J, Endesfelder D, Gronroos E, et al. Intratumor heterogeneity and branched evolution revealed by multiregion sequencing. N Engl J Med. 2012;366(10):883–92. doi: 10.1056/NEJMoa1113205. [DOI] [PMC free article] [PubMed] [Google Scholar]
- 24.Cass JD, Varma S, Day AG, Sangrar W, Rajput AB, Raptis LH, et al. Automated quantitative analysis of p53, Cyclin D1, Ki67 and pERK expression in breast carcinoma does not differ from expert pathologist scoring and correlates with clinico-pathological characteristics. Cancers (Basel) 2012;4(3):725–42. doi: 10.3390/cancers4030725. [DOI] [PMC free article] [PubMed] [Google Scholar]
- 25.Zhang L, Bhasin M, Schor-Bardach R, Wang X, Collins MP, Panka D, et al. Resistance of renal cell carcinoma to sorafenib is mediated by potentially reversible gene expression. PLoS One. 2011;6(4) doi: 10.1371/journal.pone.0019144. [DOI] [PMC free article] [PubMed] [Google Scholar]