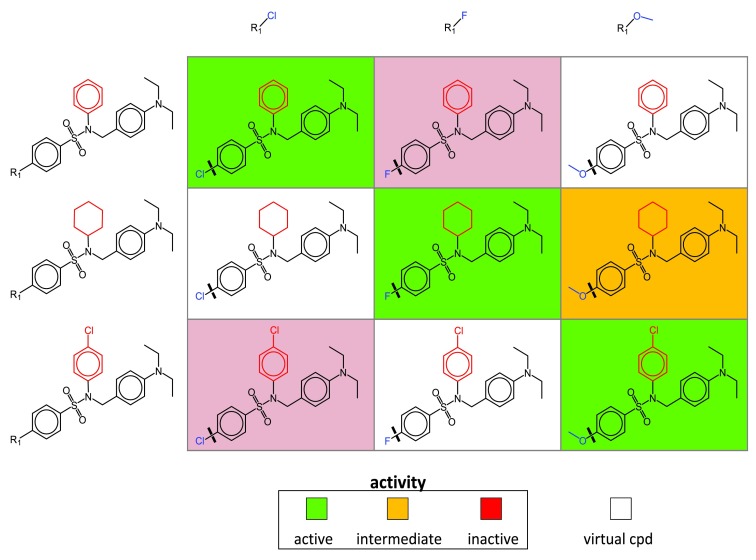
Figure 1. SAR matrix.
A schematic representation of a SARM is shown. Compound fragmentation (indicated by thick lines in matrix cells) yields three analog series with structurally related cores (keys). Each series consists of analogs that share a core and differ by a single substitutent (value, blue). Structural differences between the cores of the three series are highlighted in red. Each SARM combines all analog series with structurally related cores available in a compound set. Rows and columns represent compounds sharing the same core and substituent, respectively. In each cell, the combination of a core and a substituent defines a unique molecular structure. Compounds present in the data set are represented by filled cells that are color-coded according to activity. In addition, empty cells represent virtual compounds (i.e., previously unexplored key-value combinations resulting from MMP fragmentation).

