

Abstract
Background
The decline in asbestos use in the United States may impact mesothelioma incidence.
Objective
This report provides national and state-specific estimates of mesothelioma incidence in the United States using cancer surveillance data for the entire US population.
Methods
Data from the National Program for Cancer Registries and the Surveillance, Epidemiology, and End Results program were used to calculate incidence rates and annual percent change.
Results
During 2003–2008, an average of 1.05 mesothelioma cases per 100 000 persons were diagnosed annually in the United States; the number of cases diagnosed each year remained level, whereas rates decreased among men and were stable among women.
Conclusion
US population-based cancer registry data can be used to determine the burden of mesothelioma and track its decline. Even 30 years after peak asbestos use in the United States, 3200 mesothelioma cases are diagnosed annually, showing that the US population is still at risk.
Keywords: Mesothelioma, Incidence, Cancer surveillance
Introduction
Exposure to asbestos may cause non-malignant diseases, such as asbestosis, chronic airway obstruction, pleural plaques, diffuse and localized pleural thickening, and rounded atelectasis;1–3 cancers of the lung, larynx, and ovary;4 and malignant mesothelioma.4,5 Mesothelioma can originate in the lining of the lung or chest cavity (pleura), in the lining of the abdomen (peritoneum), or other sites, such as the pericardium and tunica vaginalis.6 Mesothelioma is caused principally by exposure to asbestos.4,5 All forms of asbestos, including the serpentine form (chrysotile) and the amphibole forms (i.e. crocidolite, amosite, anthophyllite, treomolite, and actinolite), as well as some other fibrous minerals (e.g. erionite) cause mesothelioma.4 Even a low-level or relatively brief exposure to asbestos is linked with a low, non-zero, risk of developing mesothelioma.7,8 The latent period between first exposure to asbestos and mesothelioma is generally 30 years or more.9
Use of asbestos began in the United States in the late 1800s, peaked in the early 1970s with more than 800 000 metric tons produced or imported in 1973, and has since declined, although 1100 metric tons were still imported in 2011.10,11 Partially on the basis of these usage patterns and data from the National Cancer Institute’s (NCI) Surveillance, Epidemiology, and End Results (SEER) registries, which covers 9% (SEER nine registries) to 26% (SEER 17 registries) of the US population,12 some investigators predicted that mesothelioma incidence in the United States would peak around the year 2000 with 2400–2500 cases being diagnosed per year.13–15 The first nationally representative mesothelioma incidence rates for 1999–2002 were estimated by using data from 40 states and the District of Columbia (DC) (covering 88% of the US population) that were reported to the Centers for Disease Control and Prevention’s (CDC) National Program for Cancer Registries (NPCR) and SEER.16 These data showed that predictive models restricted to SEER data might yield conservative estimates of the number of mesothelioma cases.16 Cancer surveillance data from NPCR and SEER now provide 100% coverage of the US population for 2003–2008 and are used here to update national and state-specific mesothelioma incidence rates and counts.
Methods
Information was obtained about cases of malignant mesothelioma diagnosed during 2003–2008, as reported to an NPCR or SEER population-based cancer registry, and submitted to CDC or NCI by November 2010.17 In each US state and the DC, local and regional cancer data are reported to NPCR or SEER central cancer registries about all new diagnoses of cancer from patient records at such medical facilities as hospitals, physicians’ offices, therapeutic radiation facilities, free-standing surgical centers, and pathology laboratories. The central cancer registries collate these data and use state vital records, and the National Death Index to collect information about any cancer deaths that were not reported as cases. These data are submitted to CDC or NCI and combined into one dataset. Combined, the NPCR and SEER cancer registries cover all of the US population and provide the only source of information on population-based cancer incidence for the nation. Cancer registries demonstrated that cancer incidence data were of high quality by meeting six US Cancer Statistics (USCS) publication criteria.17 All registries met these criteria for each year during 2003–2008, covering 100% of the US population.
Mesothelioma cases were identified by using the International Classification of Diseases for Oncology third edition (ICD-O-3).18 Cases were defined by anatomic sites (pleura [C38.4], peritoneum [C48], and other mesothelioma [all other ICD-O-3 codes]). Most (98%) pleural and peritoneal mesothelioma cases were diagnosed in medical facilities and 2% were found by death certificate or autopsy; 82% of ‘other’ mesothelioma cases were diagnosed in medical facilities and 8% were found by death certificate or autopsy.
Population estimates used in the SEER*Stat software (www.seer.cancer.gov/seerstat) were a modified version of the annual time series of July 1 county population estimates by age, sex, and race/ethnicity produced by the US Census Bureau.19 Modifications incorporated bridged, single-race estimates that were derived from multiple-race categories in the 2000 Census20 and accounted for known issues in certain counties.19 The modified county-level population estimates, summed to the state and national levels, were used as denominators in rate calculations.19
Average annual incidence rates per 100 000 persons were age-adjusted to the 2000 US standard population by the direct method.21 Corresponding 95% confidence intervals (CIs) were calculated as modified gamma intervals.22 All rate calculations were performed by using SEER*Stat. Mesothelioma incidence rates were examined by sex, age, race/ethnicity, and state. Incidence rates were calculated for all races and ethnicities combined and for each of five major racial/ethnic populations (i.e. white, black, American Indian or Alaska Native, Asian or Pacific Islander, and Hispanic). Information about race and Hispanic ethnicity were collected separately. An algorithm was applied to Hispanic ethnicity data to reduce misclassification of Hispanic persons as being of unknown ethnicity.23
Trends in age-standardized cancer incidence rates and counts were analyzed by using joinpoint regression, which characterizes the trends as annual percent change.24 The t-test was used to test whether the annual percent change was statistically different from zero (P<0.05). The Pearson correlation was used to evaluate associations between male and female mesothelioma incidence rates and between pleural and peritoneal incidence rates within states. These analyses were weighted by the inverse variance of the male and female combined mesothelioma incidence rate and restricted to states where at least 16 cases were diagnosed for each sex or subsite to allow for reliable rates (i.e. 42 states for correlation by sex; 28 states for correlation by subsite). All statistical tests were two-sided.
Maps depicting the geographic distribution of the number of mesothelioma cases and the age-adjusted mesothelioma incidence rates used the twenty-fifth, fiftieth, seventy-fifth, and ninetieth percentiles as cutpoints.
Results
During 2003–2008, 19 011 cases of mesothelioma were diagnosed in the United States, approximately 3200 per year (Table 1). The average annual age-adjusted incidence rate during this period was 1.05 (95% CI: 1.03–1.06) cases per 100 000 population. Rates were higher among men (rate=1.93) than among women (rate=0.41). The highest rates were observed among white men (rate=2.06).
Table 1.
Demographic characteristics of malignant mesothelioma diagnosed in the United States during 2003–2008*
| Overall |
Men |
Women |
||||||||||
|---|---|---|---|---|---|---|---|---|---|---|---|---|
| Count† | Percent | Rate‡ | 95% CI | Count† | Percent | Rate‡ | 95% CI | Count† | Percent | Rate‡ | 95% CI | |
| Overall | 19 011 | 1.05 | 1.03–1.06 | 14 764 | 1.93 | 1.90–1.97 | 4247 | 0.41 | 0.40–0.43 | |||
| Race§ | ||||||||||||
| White | 17 725 | 93.2% | 1.12 | 1.10–1.14 | 13 826 | 93.6% | 2.06 | 2.02–2.09 | 3899 | 91.8% | 0.44 | 0.43–0.46 |
| Black | 897 | 4.7% | 0.53 | 0.50–0.57 | 672 | 4.6% | 1.05 | 0.97–1.14 | 225 | 5.3% | 0.22 | 0.19–0.25 |
| American Indian/Alaska Native | 67 | 0.4% | 0.57 | 0.43–0.72 | 42 | 0.3% | 0.78 | 0.54–1.07 | 25 | 0.6% | 0.40 | 0.25–0.59 |
| Asian/Pacific Islander | 228 | 1.2% | 0.35 | 0.31–0.40 | 156 | 1.1% | 0.57 | 0.48–0.68 | 72 | 1.7% | 0.19 | 0.15–0.24 |
| Ethnicity | ||||||||||||
| Hispanic | 1049 | 5.5% | 0.81 | 0.76–0.87 | 737 | 5% | 1.34 | 1.24–1.44 | 312 | 7.3% | 0.42 | 0.38–0.47 |
| Non-Hispanic | 17 962 | 94.5% | 1.06 | 1.04–1.08 | 14 027 | 95% | 1.97 | 1.94–2.00 | 3935 | 92.7% | 0.41 | 0.40–0.43 |
| Age (years) | ||||||||||||
| <25 | 43 | 0.2% | 0.01 | 0.01–0.01 | 19 | 0.1% | 0.01 | 0.00–0.01 | 24 | 0.6% | 0.01 | 0.01–0.01 |
| 25–34 | 107 | 0.6% | 0.05 | 0.04–0.06 | 50 | 0.3% | 0.04 | 0.03–0.06 | 57 | 1.3% | 0.05 | 0.04–0.06 |
| 35–44 | 371 | 2.0% | 0.14 | 0.13–0.16 | 186 | 1.3% | 0.14 | 0.12–0.16 | 185 | 4.4% | 0.14 | 0.12–0.16 |
| 45–54 | 1128 | 5.9% | 0.44 | 0.41–0.47 | 708 | 4.8% | 0.56 | 0.52–0.60 | 420 | 9.9% | 0.32 | 0.29–0.35 |
| 55–64 | 3075 | 16.2% | 1.67 | 1.62–1.73 | 2404 | 16.3% | 2.73 | 2.62–2.84 | 671 | 15.8% | 0.70 | 0.65–0.76 |
| 65–74 | 5369 | 28.2% | 4.76 | 4.63–4.89 | 4295 | 29.1% | 8.34 | 8.09–8.60 | 1074 | 25.3% | 1.75 | 1.65–1.86 |
| 75–84 | 6761 | 35.6% | 8.53 | 8.33–8.74 | 5490 | 37.2% | 17.07 | 16.62–17.52 | 1271 | 29.9% | 2.69 | 2.55–2.84 |
| 85+ | 2157 | 11.3% | 7.22 | 6.91–7.53 | 1612 | 10.9% | 17.62 | 16.77–18.50 | 545 | 12.8% | 2.63 | 2.41–2.86 |
| Anatomic site | ||||||||||||
| Pleura (ICD-O-3 code: C38.4) | 15 615 | 82.1% | 0.86 | 0.85–0.87 | 12 509 | 84.7% | 1.65 | 1.62–1.68 | 3106 | 73.1% | 0.30 | 0.29–0.31 |
| Peritoneum (ICD-O-3 code: C48) | 1754 | 9.2% | 0.10 | 0.09–0.10 | 1008 | 6.8% | 0.12 | 0.12–0.13 | 746 | 17.6% | 0.08 | 0.07–0.08 |
| All other sites | 1642 | 8.6% | 0.09 | 0.09–0.09 | 1247 | 8.4% | 0.17 | 0.16–0.18 | 395 | 9.3% | 0.04 | 0.03–0.04 |
Notes:
Data are from the CDC’s National Program of Cancer Registries and the National Cancer Institute’s Surveillance, Epidemiology, and End Results program that met US Cancer Statistics data quality criteria for each year during 2003–2008 (covering 100% of the US population).
Number of mesothelioma cases diagnosed during 2003–2008.
Average annual rates of mesothelioma incidence are for 2003–2008 per 100 000 persons and age-adjusted to the 2000 US standard population.
Race-specific rates are not presented for cases with unknown or missing race. Race is not mutually exclusive from ethnicity.
Rates were similar among men and women younger than 45 years, but then diverged as rates began to increase more rapidly with age among men (Table 1). Rates were highest among men aged 75 years or older (Table 1).
The anatomic site where mesothelioma was diagnosed differed by sex and age. Among men, 85% of cases were diagnosed in the pleura and 7% in the peritoneum, compared with 73% diagnosed in the pleura and 18% in the peritoneum among women (differences significant P<0.05) (Table 1). Most (66%) cases classified as ‘other’ mesothelioma were diagnosed in the lung (ICD-O-3 codes 34.0–34.9).
By age, among those younger than 45 years at diagnosis, 44% of cases were diagnosed in the pleura, compared with 77% among those aged 45–64 years and 85% among those aged 65 years or older (differences significant P<0.05) (Table 2). The correlation between incidence rates of pleural and peritoneal mesothelioma within states was 0.70 (P<0.0001) (Fig. 1A).
Table 2.
Malignant mesothelioma incidence by anatomic site, sex, and age in the United States during 2003–2008*
| Age/anatomic site | Overall |
Men |
Women |
|||||||||
|---|---|---|---|---|---|---|---|---|---|---|---|---|
| Count† | Percent | Rate‡ | 95% CI | Count† | Percent | Rate‡ | 95% CI | Count† | Percent | Rate‡ | 95% CI | |
| <45 years | ||||||||||||
| Pleura (ICD-O-3 code: C38.4) | 230 | 44% | 0.02 | 0.02–0.02 | 131 | 51% | 0.02 | 0.02–0.03 | 99 | 37% | 0.02 | 0.02–0.02 |
| Peritoneum (ICD-O-3 code: C48) | 230 | 44% | 0.02 | 0.02–0.02 | 94 | 37% | 0.02 | 0.01–0.02 | 136 | 51% | 0.03 | 0.02–0.03 |
| All other sites | 61 | 12% | 0.01 | 0.00–0.01 | 30 | 12% | 0.01 | 0.00–0.01 | 31 | 12% | 0.01 | 0.00–0.01 |
| 45–64 years | ||||||||||||
| Pleura (ICD-O-3 code: C38.4) | 3222 | 77% | 0.71 | 0.68–0.73 | 2489 | 80% | 1.13 | 1.08–1.17 | 733 | 67% | 0.32 | 0.29–0.34 |
| Peritoneum (ICD-O-3 code: C48) | 643 | 15% | 0.14 | 0.13–0.16 | 376 | 12% | 0.17 | 0.16–0.19 | 267 | 24% | 0.12 | 0.10–0.13 |
| All other sites | 338 | 8% | 0.07 | 0.07–0.08 | 247 | 8% | 0.11 | 0.10–0.13 | 91 | 8% | 0.04 | 0.03–0.05 |
| 65–74 years | ||||||||||||
| Pleura (ICD-O-3 code: C38.4) | 10 336 | 85% | 5.35 | 5.25–5.46 | 8488 | 87% | 10.30 | 10.08–10.53 | 1848 | 79% | 1.67 | 1.60–1.75 |
| Peritoneum (ICD-O-3 code: C48) | 806 | 7% | 0.42 | 0.39–0.45 | 508 | 5% | 0.61 | 0.56–0.67 | 298 | 13% | 0.28 | 0.24–0.31 |
| All other sites | 988 | 8% | 0.51 | 0.48–0.54 | 789 | 8% | 0.96 | 0.89–1.03 | 199 | 8% | 0.18 | 0.16–0.21 |
| 75+ years | ||||||||||||
| Pleura (ICD-O-3 code: C38.4) | 1827 | 85% | 6.11 | 5.83–6.40 | 1401 | 87% | 15.31 | 14.52–16.14 | 426 | 78% | 2.05 | 1.86–2.26 |
| Peritoneum (ICD-O-3 code: C48) | 75 | 3% | 0.25 | 0.20–0.31 | 30 | 2% | 0.33 | 0.22–0.47 | 45 | 8% | 0.22 | 0.16–0.29 |
| All other sites | 255 | 12% | 0.85 | 0.75–0.96 | 181 | 11% | 1.98 | 1.70–2.29 | 74 | 14% | 0.36 | 0.28–0.45 |
Notes:
Data are from the CDC’s National Program of Cancer Registries and the National Cancer Institute’s Surveillance, Epidemiology, and End Results program that met US Cancer Statistics data quality criteria for each year during 2003–2008 (covering 100% of the US population).
Number of cases diagnosed during 2003–2008.
Average annual rates of mesothelioma incidence are for 2003–2008 per 100 000 persons and age-adjusted to the 2000 US standard population.
Figure 1.

(A) Correlation between pleural mesothelioma incidence and peritoneal mesothelioma incidence within states, United States, 2003–2008 (Pearson correlation=0.70; P<0.0001). (B) Correlation between male mesothelioma incidence and female mesothelioma incidence within states, United States, 2003–2008 (Pearson correlation=0.78; P<0.0001). Correlation is shown as straight line and 95% confidence intervals are shown as shaded area. Analyses were weighted by the inverse variance of the male and female combined mesothelioma incidence rate and restricted to states where at least 16 cases were diagnosed for each sex or subsite to allow for reliable rates (i.e. 42 states for correlation by sex; 28 states for correlation by subsite). Data are from Centers for Disease Control and Prevention’s National Program of Cancer Registries and the National Cancer Institute’s Surveillance, Epidemiology, and End Results program that met US Cancer Statistics data quality criteria for each year during 2003–2008.
Incidence rates among states ranged from 0.58 to 1.65 per 100 000 persons (Fig. 2A). The average rate among states in the upper tenth percentile (Alaska, Maine, New Jersey, West Virginia, and Washington) was 1.51 (Fig. 2A). Rates among women tended to be higher in states where rates among men were also high (Pearson correlation r=0.78; P<0.0001) (Fig. 1B).
Figure 2.

Geographic distribution of malignant mesothelioma diagnosed in the United States, 2003–2008. Map A depicts incidence rates (age-adjusted to the 2000 US standard population) with lighter colors indicating lower rates and darker colors indicating higher rates. Map B depicts average number of cases diagnosed each year 2003–2008 with lighter colors indicating lower numbers and darker colors indicating higher numbers. Data are from Centers for Disease Control and Prevention’s National Program of Cancer Registries and the National Cancer Institute’s Surveillance, Epidemiology, and End Results program that met US Cancer Statistics data quality criteria for each year during 2003–2008 (covering 100% of the US population).
Incidence rates decreased by 2.6% per year from 2003 to 2008 among men and were stable among women (Fig. 3). The number of cases diagnosed each year remained the same from 2003 to 2008 with about 2500 cases among men and 700 cases among women diagnosed each year (Fig. 3).
Figure 3.
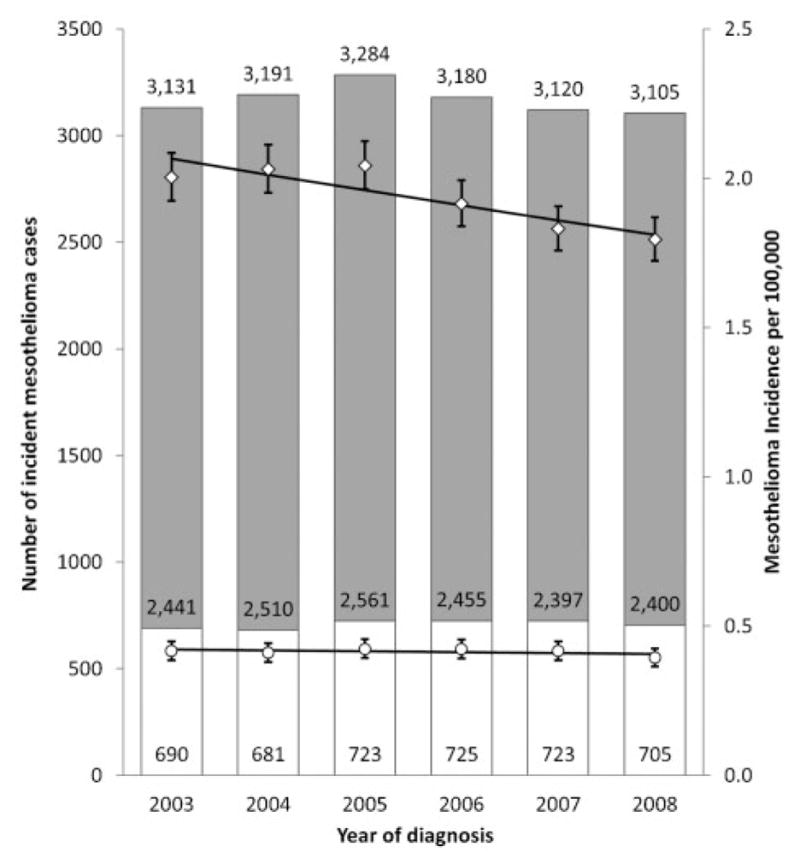
Malignant mesothelioma cases diagnosed in the United States by sex and year 2003–2008. The vertical scale on the left represents the number of malignant mesothelioma cases diagnosed annually. White bars represent cases among women, and gray bars represent cases among men. Numbers of cases are given within bars; the number of cases was stable over time (P<0.05). The vertical scale on the right represents the annual incidence rate of malignant mesothelioma per 100 000 persons, age-adjusted to the 2000 US standard population. Circles represent rates among women, and diamonds represent rates among men. Vertical lines around the data points represent 95% confidence intervals for the rate. Trend lines represent incidence trends estimated by using joinpoint regression. From 2003 to 2008, malignant mesothelioma incidence rates declined by 2.6% per year among men (P<0.05) and were stable among women. Data are from the CDC’s National Program of Cancer Registries and the National Cancer Institute’s Surveillance, Epidemiology, and End Results program that met US cancer statistics data quality criteria for each year 2003–2008 (covering 100% of the US population).
Discussion
This report updates national and state-specific mesothelioma incidence in the United States on the basis of 40 states and DC (88% of the US population) for 1999–200216 with data from all 50 states and DC, providing 100% coverage of the US population for 2003–2008. National estimates of mesothelioma incidence extrapolated from SEER data underestimated the true number of cases.13–15 For some cancers, including pleural neoplasms, rates calculated in the SEER nine areas may not be representative of US rates.25,26 US mesothelioma rates appear to be higher than those from the SEER nine registries, but similar to those from the SEER 17 registries, which include states with high rates of mesothelioma, such as New Jersey and Louisiana.12 Several ecological studies have shown linear associations between historical asbestos use and mesothelioma incidence and mortality rates.27–29 Based on incidence data during 1995–2000 and asbestos use 25 years earlier, countries with high historical asbestos use tended to have the highest mesothelioma incidence rates such as Australia (3.5 cases per 100 000 people), Great Britain (3.3), and the Netherlands (3.0); US rates (1.4) were about the same as countries with similar asbestos use (2.6 kg per capita per year).29 Patterns of asbestos use suggest that the mesothelioma disease burden is shifting toward countries with recent use of asbestos.28,30
The temporal trends in our data agree with trends based on SEER nine data, which show that mesothelioma incidence rates among men increased until the early 1990s, remained level for several years, and then began to decline about 2005, while rates among women increased slightly during 1975–1986 and had little change during 1986–2008.12 Based on data from 83 countries covering 29% of the world population, worldwide mesothelioma mortality increased 5.4% per year from 1994 through 2008.30 A study of the relation between asbestos use and mesothelioma mortality among men found increasing mortality from 1996 through 2005 in five countries (Japan, Croatia, Hungary, Argentina, and Brazil) and stable trends in 26 countries including Australia and the United Kingdom.28
Age-adjusted incidence rates can be influenced by several factors, including the size or overall age of the population.21 If the size or overall age of the US population or both increased over time, the rate may go down, even if the number of cases stayed the same or increased during that time. Our study shows that during 2003–2008, the number of mesothelioma cases and incidence rate were stable among women, and among men the number of cases remained the same although the rate of mesothelioma incidence declined. A decline in the mesothelioma rate does not necessarily imply that there were fewer mesothelioma cases or fewer people exposed to asbestos.
In the United States, men tend to have the highest mesothelioma incidence rate, which may reflect differences in occupational exposures.31 Historically people, primarily men, were exposed to asbestos from working in asbestos-related industries, such as asbestos mining and manufacturing, ship building, and construction.32 Currently, about 1.3 million workers in the United States and 125 million workers around the world are exposed to asbestos.33 In an effort to protect US workers from occupational exposure to asbestos, standards were recommended by the National Institute for Occupational Safety and Health in 1972 (revised in 1976)34 and issued by the Occupational Safety and Health Administration in 1972 (revised in 1996).35 Today, most workers are exposed to asbestos primarily through the demolition, remediation, and maintenance of buildings, including homes and schools, containing asbestos.32,36
In addition, differences in industry may explain geographic variability in mesothelioma incidence. States with high mesothelioma rates tended to have had shipyard industries, such as Washington and Maine, or asbestos manufacturing industries, such as New Jersey.37 In West Virginia, mesothelioma incidence was highest among counties with large industries (e.g. coal mining, power plants, and chemical plants); workers in these industries are considered at high risk of asbestos exposure and have a high risk of death from mesothelioma.32,38 Given that most contemporary exposure in the United States may come from being around buildings built with asbestos-laden materials,32 these geographic patterns may shift. A recent study in Australia estimated that home renovation was the largest source of non-occupational asbestos exposure for both men and women; of mesothelioma cases diagnosed during 2005–2008, 8% among men and 36% among women were due to exposures during home renovation.36 Geographic patterns also may shift following widespread community exposure to asbestos, as occurred in Libby, Montana.39,40
As observed previously,16 US mesothelioma incidence rates were highest among older men and women who were probably exposed to asbestos before IARC classified it as a human carcinogen,41 and before efforts were undertaken to limit exposure. However, our data show that approximately 1% of US mesothelioma cases were diagnosed among men and women aged younger than 35 years (3% younger than 45 years). Because mesothelioma is rare in this age group, it has been suggested that these cases may have an increased genetic susceptibility to developing mesothelioma; however, several lines of evidence also point to asbestos as a contributing cause. First, some (but not all) case studies of mesothelioma among children and young adults have documented a history of asbestos exposure.42–45
Second, some studies have observed that people exposed to asbestos as children have increased risk of developing respiratory symptoms,46 radiographic abnormalities,47 and mesothelioma.48 Our study is in line with other studies that show a higher proportion of peritoneal mesotheliomas in this age group than in older age groups.42,45 The hypothesis that pleural and peritoneal mesothelioma share a common cause, notably exposure to asbestos, is supported by the high correlation we observed between pleural and peritoneal mesothelioma (r=0.7). This correlation is similar to those reported in cohorts of asbestos-exposed workers49 and among the population of Italy.50 A study of the Lombardy Region Mesothelioma Registry found that patients with pleural and peritoneal mesothelioma had similar proportions of occupational (60%) and environmental/familial (7%) asbestos exposures.51 An ecological study of 33 countries found significant correlations between historical asbestos consumption and both pleural and peritoneal mesothelioma.27 Although asbestos is the overwhelming cause of mesothelioma, exposure to factors that also induce cell necrosis, inflammation, proliferation, or DNA damage, such as ionizing radiation, particularly in conjunction with asbestos exposure, may contribute to the development of mesothelioma.31,49 Genetic susceptibility may also play a role because only a fraction of people with history of asbestos exposure develop mesothelioma.52
Our data agree with studies that showed that female mesothelioma incidence tends to be higher in geographic regions with high rates of male mesothelioma incidence, suggesting a common exposure to asbestos.37,53 While men are primarily exposed to asbestos through occupation, women are exposed in other ways. Workers may have contaminated their homes with asbestos fibers carried on their clothes, shoes, and hair, thus, potentially exposing their families and other household members.54 Asbestos from mining and manufacturing industries can contaminate air and water near mining and manufacturing plants and along transportation routes to loading stations or warehouses.55,56 The correlation between male and female mesothelioma incidence and the regional variation in female mesothelioma incidence support the hypothesis that mesothelioma risk may be increased by ambient asbestos environmental pollution from industrial sources.55,57–59 Asbestos was banned from new uses in the United States by the US Environmental Protection Agency,60 but some US-manufactured and imported products, such as roofing materials and brake linings, still contain asbestos.61 Worldwide, 2 million tons of asbestos were mined in 2011 (Russia, China, Kazakhstan, Canada, and Brazil accounted for 99% of production), and 200 million tons are in reserve.11 One study has estimated that for every 170 tons of asbestos used, one person will die from mesothelioma.29
Current treatment options for mesothelioma are limited, particularly for peritoneal mesothelioma, but include a multimodal approach, including surgery, radiotherapy, and chemotherapy.6,62 Detecting and treating mesothelioma in its early manifestation may help increase the 5-year survival rate, which was only 8% in 2007.12 However, because clinical trials of early detection and treatment options have not yet yielded clinical benefits, preventing mesothelioma by controlling or eliminating asbestos exposure is indicated as the optimal approach.27,63
This study is subject to at least the following limitations. Because of migration, state-specific mesothelioma rates may not reflect past asbestos exposure because mesothelioma may not have been diagnosed in the state where the asbestos exposure occurred, particularly given the long latency period between exposure and disease. Although the combined NPCR and SEER data provide 100% coverage of the United States, CIs are presented since our rates may be underestimates or estimates because of delays in case-reporting, misdiagnosis, or differential diagnosis. Delays in case-reporting can result in an underestimate for the most recent years. Although the possibility of misdiagnosis has diminished in recent years because current standards recommend that a malignant mesothelioma diagnosis be confirmed by biopsy and immunohistochemistry,4 some tumors, mainly carcinomas, may be misdiagnosed as mesothelioma, resulting in an overestimate.31 Conversely, some mesotheliomas, especially peritoneal mesotheliomas, may have been differentially diagnosed, particularly as serous papillary carcinomas of the peritoneum or ovary, resulting in an underestimate.31
This report shows that 3200 mesothelioma cases were diagnosed annually in the United States during 2003–2008; some of these cases occurred among young people who were born after the use of asbestos peaked. These data indicate that the US population is still at risk of exposure to asbestos, and possibly erionite, and developing mesothelioma. Even though advancements in early detection and treatment options offer promises of better prognosis of mesothelioma, these advancements have not yet resulted in improved survival for individuals who already have the disease. Therefore, prevention is a better option. Mesothelioma can be prevented by eliminating exposure to asbestos.27,63 Almost all products that use asbestos have a safer substitute,10,64 and NIOSH and OSHA standards can be followed to reduce occupational exposure to asbestos.34,35 Subsequent changes in mesothelioma incidence in the United States can be monitored by using national, population-based, cancer registry data.
Acknowledgments
We gratefully acknowledge the contributions of the state and regional cancer registry staffs for their work in collecting the data used in this study. The findings and conclusions in this report are those of the authors and do not necessarily represent the official positions of the Centers for Disease Control and Prevention or the Agency for Toxic Substances and Disease Registry.
Footnotes
Disclosure
The authors declare no conflict of interest.
References
- 1.Agency for Toxic Substances and Disease Registry. Asbestos: health effects. http://www.atsdr.cdc.gov/asbestos/asbestos/health_effects/
- 2.King C, Mayes D, Dorsey DA. Benign asbestos-related pleural disease. Dis Mon. 2011;57(1):27–39. doi: 10.1016/j.disamonth.2010.12.003. [DOI] [PubMed] [Google Scholar]
- 3.Kamp DW. Asbestos-induced lung diseases: an update. Transl Res. 2009;153(4):143–52. doi: 10.1016/j.trsl.2009.01.004. [DOI] [PMC free article] [PubMed] [Google Scholar]
- 4.International Agency for Research on Cancer. IARC monographs on the evaluation of carcinogenic risks to humans: Volume 100C: a review of human carcinogens: arsenic, metals, fibres, and dusts. Lyon: International Agency for Research on Cancer; 2011. [Google Scholar]
- 5.National Toxicology Program. Report on carcinogens. 12. Research Triangle Park, NC: US Department of Health and Human Services, Public Health Service, National Toxicology Program; 2011. [Google Scholar]
- 6.Sovak M, Aisner S, Aisner J. Tumors of the pleura and mediastinum. In: Abeloff M, OArmitage J, Niederhuber J, Kastan M, McKenna W, editors. Abelhoff’s clinical oncology. Philadelphia, PA: Churchill Livingstone Elsevier; 2008. pp. 1367–98. [Google Scholar]
- 7.Hodgson JT, Darnton A. The quantitative risks of mesothelioma and lung cancer in relation to asbestos exposure. Ann Occup Hyg. 2000;44(8):565–601. [PubMed] [Google Scholar]
- 8.Hillerdal G. Mesothelioma: cases associated with non-occupational and low dose exposures. Occup Environ Med. 1999;56(8):505–13. doi: 10.1136/oem.56.8.505. [DOI] [PMC free article] [PubMed] [Google Scholar]
- 9.Selikoff IJ, Hammond EC. Asbestos-associated disease in United States shipyards. CA Cancer J Clin. 1978;28(2):87–99. doi: 10.3322/canjclin.28.2.87. [DOI] [PubMed] [Google Scholar]
- 10.Virta R. Vol Circular. Reston, VA: US Geological Survey; 2006. Worldwide asbestos supply and consumption trends from 1900 through 2003; p. 1298. http://pubs.usgs.gov/circ/2006/1298/c1298.pdf. [Google Scholar]
- 11.Virta R. Mineral commodity summaries 2012. Reston, VA: US Geological Survey; 2012. http://minerals.usgs.gov/minerals/pubs/commodity/asbestos/index.html#mcs. [Google Scholar]
- 12.Howlader N, Noone AM, Krapcho M, Neyman N, Aminou R, Waldron W, et al. SEER cancer statistics review 1975–2008. Bethesda, MD: National Cancer Institute; 2011. http://seer.cancer.gov/csr/1975_2008/ [Google Scholar]
- 13.Price B, Ware A. Mesothelioma trends in the United States: an update based on Surveillance, Epidemiology, and End Results program data for 1973 through 2003. Am J Epidemiol. 2004;159(2):107–12. doi: 10.1093/aje/kwh025. [DOI] [PubMed] [Google Scholar]
- 14.Price B, Ware A. Time trend of mesothelioma incidence in the United States and projection of future cases: an update based on SEER data for 1973 through 2005. Crit Rev Toxicol. 2009;39(7):576–88. doi: 10.1080/10408440903044928. [DOI] [PubMed] [Google Scholar]
- 15.Moolgavkar SH, Meza R, Turim J. Pleural and peritoneal mesotheliomas in SEER: age effects and temporal trends, 1973–2005. Cancer Causes Control. 2009;20(6):935–44. doi: 10.1007/s10552-009-9328-9. [DOI] [PubMed] [Google Scholar]
- 16.Larson T, Melnikova N, Davis SI, Jamison P. Incidence and descriptive epidemiology of mesothelioma in the United States, 1999–2002. Int J Occup Environ Health. 2007;13(4):398–403. doi: 10.1179/oeh.2007.13.4.398. [DOI] [PubMed] [Google Scholar]
- 17.US Cancer Statistics Working Group. United States Cancer Statistics: 1999–2008 incidence and mortality web-based report. Atlanta, GA: US Department of Health and Human Services, Centers for Disease Control and Prevention and National Cancer Institute; 2011. www.cdc.gov/uscs. [Google Scholar]
- 18.Fritz A, Percy C, Jack A, Parkin DM, Shanmugarathan S, Sobin L, et al., editors. International classification of diseases for oncology. 3rd ed. Geneva: World Health Organization; 2000. [Google Scholar]
- 19.National Cancer Institute. Surveillance Epidemiology and End Results (SEER) Program. Population estimates used in NCI’s SEER*Stat software. Bethesda, MD: National Cancer Institute; http://seer.cancer.gov/popdata/methods.html. [Google Scholar]
- 20.Centers for Disease Control and Prevention. National Vital Statistics System. US census populations with bridged race categories. http://www.cdc.gov/nchs/about/major/dvs/popbridge/popbridge.htm.
- 21.Anderson R, Rosenberg H. Age standardization of death rates: implementation of the year 2000 standard. Natl Vital Stat Rep. 1998;47(3):1–16. [PubMed] [Google Scholar]
- 22.Tiwari RC, Clegg LX, Zou Z. Efficient interval estimation for age-adjusted cancer rates. Stat Methods Med Res. 2006;15(6):547–69. doi: 10.1177/0962280206070621. [DOI] [PubMed] [Google Scholar]
- 23.NAACCR Latino Research Work Group. NAACCR guideline for enhancing Hispanic/Latino identification: revised NAACCR Hispanic/Latino identification algorithm [NHIA v2.1] Springfield, IL: North American Association of Central Cancer Registries; 2008. [Google Scholar]
- 24.Kim H-J, Fay MP, Feuer EJ, Midthune DN. Permutation tests for joinpoint regression with applications to cancer rates. Stat Med. 2000;19(3):335–51. doi: 10.1002/(sici)1097-0258(20000215)19:3<335::aid-sim336>3.0.co;2-z. [DOI] [PubMed] [Google Scholar]
- 25.Wingo PA, Jamison PM, Hiatt RA, Weir HK, Gargiullo PM, Hutton M, et al. Building the infrastructure for nationwide cancer surveillance and control — a comparison between the National Program of Cancer Registries (NPCR) and the Surveillance, Epidemiology, and End Results (SEER) Program (United States) Cancer Causes Control. 2003;14(2):175–93. doi: 10.1023/a:1023002322935. [DOI] [PubMed] [Google Scholar]
- 26.Merrill RM, Dearden KA. How representative are the Surveillance, Epidemiology, and End Results (SEER) program cancer data of the United States? Cancer Causes Control. 2004;15(10):1027–34. doi: 10.1007/s10552-004-1324-5. [DOI] [PubMed] [Google Scholar]
- 27.Lin R-T, Takahashi K, Karjalainen A, Hoshuyama T, Wilson D, Kameda T, et al. Ecological association between asbestos-related diseases and historical asbestos consumption: an international analysis. Lancet. 2007;369(9564):844–9. doi: 10.1016/S0140-6736(07)60412-7. [DOI] [PubMed] [Google Scholar]
- 28.Nishikawa K, Takahashi K, Karjalainen A, Wen CP, Furuya S, Hoshuyama T, et al. Recent mortality from pleural mesothelioma, historical patterns of asbestos use, and adoption of bans: a global assessment. Environ Health Perspect. 2008;116(12):1675–80. doi: 10.1289/ehp.11272. [DOI] [PMC free article] [PubMed] [Google Scholar]
- 29.Tossavainen A. Global use of asbestos and the incidence of mesothelioma. Int J Occup Environ Health. 2004;10(1):22–5. doi: 10.1179/oeh.2004.10.1.22. [DOI] [PubMed] [Google Scholar]
- 30.Delgermaa V, Takahashi K, Park EK, Le GV, Hara T, Sorahan T. Global mesothelioma deaths reported to the World Health Organization between 1994 and 2008. Bull World Health Organ. 2011;89(10):716–24. 724A–C. doi: 10.2471/BLT.11.086678. [DOI] [PMC free article] [PubMed] [Google Scholar]
- 31.Carbone M, Ly BH, Dodson RF, Pagano I, Morris PT, Dogan UA, et al. Malignant mesothelioma: facts, myths, and hypotheses. J Cell Physiol. 2012;227(1):44–58. doi: 10.1002/jcp.22724. [DOI] [PMC free article] [PubMed] [Google Scholar]
- 32.Agency for Toxic Substances and Disease Registry (ATSDR) Toxicological profile for asbestos (TP-61) Atlanta, GA: US Department of Health and Human Services, Public Health Service; 2001. [Google Scholar]
- 33.Concha-Barrientos M, Nelson D, Driscoll T, Steenland NK, Punnett L, Fingerhut MA, et al. Selected occupational risk factors. In: Ezzati M, Lopez AD, Rodgers A, Murray CJL, editors. Comparative quantification of health risks: global and regional burden of disease attribution to selected major risk factors. Geneva: World Health Organization; 2004. [Google Scholar]
- 34.US Department of Health, Education, and Welfare. Revised recommended asbestos standard. DHEW NIOSH Publication No. 77–169. Washington, DC: US Department of Health, Education, and Welfare, Centers for Disease Control, National Institute for Occupational Safety and Health; 1976. [Google Scholar]
- 35.Occupational Safety and Health Administration. Occupational exposure to asbestos, tremolite, anthophyllite and actinolite. Washington, DC: Occupational Safety and Health Administration; 1996. [Google Scholar]
- 36.Olsen NJ, Franklin PJ, Reid A, de Klerk NH, Threlfall TJ, Shilkin K, et al. Increasing incidence of malignant mesothelioma after exposure to asbestos during home maintenance and renovation. Med J Aust. 2011;195(5):271–4. doi: 10.5694/mja11.10125. [DOI] [PubMed] [Google Scholar]
- 37.Jemal A, Grauman D, Devesa S. Recent geographic patterns of lung cancer and mesothelioma mortality rates in 49 shipyard counties in the United States, 1970–94. Am J Ind Med. 2000;37(5):512–21. doi: 10.1002/(sici)1097-0274(200005)37:5<512::aid-ajim7>3.0.co;2-m. [DOI] [PubMed] [Google Scholar]
- 38.National Institute for Occupational Safety and Health. The work-related lung disease surveillance report, 2002. Vol. DHHS (NIOSH) number 2003–111. Atlanta, GA: US Department of Health and Human Services, Public Health Service, Centers for Disease Control and Prevention, National Institute for Occupational Safety and Health, Division of Respiratory Disease Studies; 2003. [Google Scholar]
- 39.Peipins LA, Lewin M, Campolucci S, Lybarger JA, Miller A, Middleton D, et al. Radiographic abnormalities and exposure to asbestos-contaminated vermiculite in the community of Libby, Montana, USA. Environ Health Perspect. 2003;111(14):1753–9. doi: 10.1289/ehp.6346. [DOI] [PMC free article] [PubMed] [Google Scholar]
- 40.Antao VC, Larson TC, Horton DK. Libby vermiculite exposure and risk of developing asbestos-related lung and pleural diseases. Curr Opin Pulm Med. 2012;18(2):161–7. doi: 10.1097/MCP.0b013e32834e897d. [DOI] [PMC free article] [PubMed] [Google Scholar]
- 41.International Agency for Research on Cancer. IARC monographs on the evaluation of carcinogenic risks to humans. Vol. 14. A review of human carcinogens: asbestos. Lyon: International Agency for Research on Cancer; 1977. [Google Scholar]
- 42.Kane MJ, Chahinian AP, Holland JF. Malignant mesothelioma in young adults. Cancer. 1990;65(6):1449–55. doi: 10.1002/1097-0142(19900315)65:6<1449::aid-cncr2820650633>3.0.co;2-0. [DOI] [PubMed] [Google Scholar]
- 43.Zarogoulidis P, Orfanidis M, Constadinidis TC, Eleutheriadou E, Kontakiotis T, Kerenidi T, et al. A 26-year-old male with mesothelioma due to asbestos exposure. Case Rep Med. 2011;2011 doi: 10.1155/2011/951732.951732 [DOI] [PMC free article] [PubMed] [Google Scholar]
- 44.Bitchatchi E, Kayser K, Perelman M, Richter ED. Mesothelioma and asbestosis in a young woman following occupational asbestos exposure: short latency and long survival: Case report. Diagn Pathol. 2010;5:81. doi: 10.1186/1746-1596-5-81. [DOI] [PMC free article] [PubMed] [Google Scholar]
- 45.Cioffredi L-A, Jänne PA, Jackman DM. Treatment of peritoneal mesothelioma in pediatric patients. Pediatr Blood Cancer. 2009;52(1):127–9. doi: 10.1002/pbc.21718. [DOI] [PubMed] [Google Scholar]
- 46.Vinikoor LC, Larson TC, Bateson TF, Birnbaum L. Exposure to asbestos-containing vermiculite ore and respiratory symptoms among individuals who were children while the mine was active in Libby, Montana. Environ Health Perspect. 2010;118(7):1033–8. doi: 10.1289/ehp.0901680. [DOI] [PMC free article] [PubMed] [Google Scholar]
- 47.Kilburn KH, Lilis R, Anderson HA, Boylen CT, Einstein HE, Johnson SJ, et al. Asbestos disease in family contacts of shipyard workers. Am J Public Health. 1985;75(6):615–7. doi: 10.2105/ajph.75.6.615. [DOI] [PMC free article] [PubMed] [Google Scholar]
- 48.Reid A, Franklin P, Olsen N, Sleith J, Samuel L, Aboagye-Sarfo P, et al. All-cause mortality and cancer incidence among adults exposed to blue asbestos during childhood. Am J Ind Med. doi: 10.1002/ajim.22103. e-pub ahead of print 2012 Aug 9. [DOI] [PubMed] [Google Scholar]
- 49.Boffetta P. Epidemiology of peritoneal mesothelioma: a review. Ann Oncol. 2007;18(6):985–90. doi: 10.1093/annonc/mdl345. [DOI] [PubMed] [Google Scholar]
- 50.Marinaccio A, Binazzi A, Di Marzio D, Scarselli A, Verardo M, Mirabelli D, et al. Incidence of extrapleural malignant mesothelioma and asbestos exposure, from the Italian national register. Occup Environ Med. 2010;67(11):760–5. doi: 10.1136/oem.2009.051466. [DOI] [PubMed] [Google Scholar]
- 51.Mensi C, Bonzini M, Macchione M, Sieno C, Riboldi L, Pesatori AC. Differences among peritoneal and pleural mesothelioma: data from the Lombardy Region Mesothelioma Register (Italy) Med Lav. 2011;102(5):409–16. [PubMed] [Google Scholar]
- 52.Carbone M, Yang H. Molecular pathways: targeting mechanisms of asbestos and erionite carcinogenesis in mesothelioma. Clin Cancer Res. 2012 Feb 1;18(3):598–604. doi: 10.1158/1078-0432.CCR-11-2259. [DOI] [PMC free article] [PubMed] [Google Scholar]
- 53.Goldberg S, Rey G, Luce D, Gilg Soit Ilg A, Rolland P, Brochard P, et al. Possible effect of environmental exposure to asbestos on geographical variation in mesothelioma rates. Occup Environ Med. 2010;67(6):417–21. doi: 10.1136/oem.2009.050336. [DOI] [PubMed] [Google Scholar]
- 54.Boffetta P, Stayner L. Pleural and peritoneal neoplasms. In: Schottenfeld D, Fraumeni JF, editors. Cancer epidemiology and prevention. 3rd ed. New York: Oxford University Press; 2006. pp. 659–73. [Google Scholar]
- 55.Maule MM, Magnani C, Dalmasso P, Mirabelli D, Merletti F, Biggeri A. Modeling mesothelioma risk associated with environmental asbestos exposure. Environ Health Perspect. 2007;115(7):1066–71. doi: 10.1289/ehp.9900. [DOI] [PMC free article] [PubMed] [Google Scholar]
- 56.Kurumatani N, Kumagai S. Mapping the risk of mesothelioma due to neighborhood asbestos exposure. Am J Respir Crit Care Med. 2008;178(6):624–9. doi: 10.1164/rccm.200801-063OC. [DOI] [PubMed] [Google Scholar]
- 57.Hansell A. Airborne environmental exposure to asbestos. Am J Respir Crit Care Med. 2008;178(6):556–7. doi: 10.1164/rccm.200806-859ED. [DOI] [PubMed] [Google Scholar]
- 58.Rake C, Gilham C, Hatch J, Darnton A, Hodgson J, Peto J. Occupational, domestic and environmental mesothelioma risks in the British population: a case–control study. Br J Cancer. 2009;100(7):1175–83. doi: 10.1038/sj.bjc.6604879. [DOI] [PMC free article] [PubMed] [Google Scholar]
- 59.Strauchen JA. Rarity of malignant mesothelioma prior to the widespread commercial introduction of asbestos: The Mount Sinai autopsy experience 1883–1910. Am J Ind Med. 2011;54(6):467–9. doi: 10.1002/ajim.20951. [DOI] [PubMed] [Google Scholar]
- 60.US Environmental Protection Agency. Asbestos ban and phaseout. 2010 http://www.epa.gov/asbestos/pubs/ban.html.
- 61.Virta R. 2010 minerals yearbook: asbestos. Reston, VA: US Geological Survey; 2011. http://minerals.usgs.gov/minerals/pubs/commodity/asbestos/myb1-2010-asbes.pdf. [Google Scholar]
- 62.Campbell NP, Kindler HL. Update on malignant pleural mesothelioma. Semin Respir Crit Care Med. 2011;32(1):102–10. doi: 10.1055/s-0031-1272874. [DOI] [PubMed] [Google Scholar]
- 63.World Health Organization. Elimination of asbestos-related diseases. 2006 http://whqlibdoc.who.int/hq/2006/WHO_SDE_OEH_06.03_eng.pdf.
- 64.LaDou J, Castleman B, Frank A, Gochfeld M, Greenberg M, Huff J, et al. The case for a global ban on asbestos. Environ Health Perspect. 2010;118(7):897–901. doi: 10.1289/ehp.1002285. [DOI] [PMC free article] [PubMed] [Google Scholar]