

Abstract
While a large number of laboratory methods for the detection of Cryptosporidium oocysts in faecal samples are now available, their efficacy for identifying asymptomatic cases of cryptosporidiosis is poorly understood. This study was carried out to determine a reliable screening test for epidemiological studies in livestock. In addition, three molecular tests were compared to identify Cryptosporidium species responsible for the infection in cattle, sheep and horses. A variety of diagnostic tests including microscopic (Kinyoun's staining), immunological (Direct Fluorescence Antibody tests or DFAT), enzyme-linked immunosorbent assay (ELISA), and molecular methods (nested PCR) were compared to assess their ability to detect Cryptosporidium in cattle, horse and sheep faecal samples. The results indicate that the sensitivity and specificity of each test is highly dependent on the input samples; while Kinyoun's and DFAT proved to be reliable screening tools for cattle samples, DFAT and PCR analysis (targeted at the 18S rRNA gene fragment) were more sensitive for screening sheep and horse samples. Finally different PCR primer sets targeted at the same region resulted in the preferential amplification of certain Cryptosporidium species when multiple species were present in the sample. Therefore, for identification of Cryptosporidium spp. in the event of asymptomatic cryptosporidiosis, the combination of different 18S rRNA nested PCR primer sets is recommended for further epidemiological applications and also tracking the sources of infection.
Keywords: Cryptosporidium, Cattle, Horse, Sheep, Diagnostic techniques, Molecular methods, Latent class analysis
1. Introduction
Numerous techniques have been used to detect Cryptosporidium infection in humans and animals. These include histology and ultrastructural examination of biopsy material for life-cycle stages, examination of faeces for the presence of oocysts and detection of Cryptosporidium antigens or DNA (Smith, 2008). Methods such as direct or indirect immunofluorescence staining techniques (DFAT and IFAT), detection of antigens using enzyme-linked immunosorbent assay (ELISA), as well as various molecular tests such as polymerase chain reaction (PCR), and loop mediated isothermal amplification (LAMP) are widely used to detect the parasite in faecal material (Jex et al., 2008; Kaushik et al., 2008; Morgan and Thompson, 1998; Plutzer and Karanis, 2009; Smith, 2008).
As faecal samples from clinical cases generally contain large numbers of oocysts and parasite antigenic material, even methods that have a low sensitivity can provide a positive diagnosis. In contrast, when testing samples containing few oocysts, as may be required for an epidemiological investigation, the use of an initial screening method (e.g. staining and microscopic analysis of slides), followed by a confirmatory method such as immunofluorescence or molecular approaches can augment confidence in the diagnosis (Smith, 2008). For this purpose the immunofluorescent staining of oocysts with fluorescein isothiocyanate-conjugated anti-Cryptosporidium monoclonal antibody (FITC-C-mAb) has been reported to be particularly specific (96–100%) and sensitive (98.5–100%) (Jex et al., 2008; Sterling and Arrowood, 1986). On the other hand, Cryptosporidium coproantigen can be detected in faecal samples even before excretion of oocysts has commenced. There are numerous studies on different ELISA's and immunochoromographic (IC) tests specific for coproantigen with a reported specificity and sensitivity of between 97 and 100% (Chalmers et al., 2011; Chan et al., 2000; Garcia and Shimizu, 1997; Johnston et al., 2003; Newman et al., 1993; Robert et al., 1990; Ungar, 1990). A further advantage of these coproantigen detection assays is that they can be used to test large numbers of samples in a rapid and cost-effective manner. However, for more detailed epidemiological studies, the assays are not suitable because they do not provide any information on the species or genotype of Cryptosporidium present (Garcia et al., 2003; Jex et al., 2008; Johnston et al., 2003). To date 29 Cryptosporidium genotypes have been described among which C. parvum, C. xiaoi, C. bovis, C. ryanae, C. andersoni and C. ubiquitum are known to be infective to livestock and horses.
More than two decades have passed since the first report of describing the detection of Cryptosporidium parvum by PCR (Laxer et al., 1991). These techniques have been developed to detect and differentiate Cryptosporidium species at species/genotype and subtype level (Morgan et al., 1995; Sulaiman et al., 1999; Widmer, 1998; Widmer et al., 1998). While it is well established that PCR assays aimed at different regions of the Cryptosporidium genome have different sensitivities and specificities, little is known about the behaviour and efficiency of different primer pairs aimed at the same target region (Smith, 2008).
A review by Plutzer and Karanis (2009) emphasises the importance of molecular tools to assess the zoonotic potential of various Cryptosporidium species and the sources of human infection. Application of various molecular approaches, their specificity and sensitivity in the detection of human cryptosporidiosis have already been studied (Jiang and Xiao, 2003; Smith, 2008). In addition a number of genomic loci have been identified as targets for the detection of species as well as for genotype identification of different Cryptosporidium isolates (Leetz et al., 2007; Plutzer et al., 2010).
There has been no direct evaluation of all assays used routinely in Ireland for testing asymptomatic cryptosporidiosis in animals. In addition to that the specificity and sensitivity of different molecular tests has not been applied for testing animal species such as cattle, sheep, and horses specifically in veterinary research. Therefore, our study aimed to evaluate commonly used assays such as microscopic examination, ELISA and PCR for detecting asymptomatic cryptosporidiosis in cattle, horse and sheep. Since there is no gold standard technique for detection of Cryptosporidium oocysts (Smith, 2008), we used latent class analysis (LCA) to construct a pseudo-gold standard to estimate the sensitivity and specificity of each test for the detection of Cryptosporidium oocysts.
Three published PCR protocols targeting the 18S rRNA gene fragment were compared to gain a better understanding of Cryptosporidium genotypes present in sub-clinical cases of horse, sheep, and cattle.
2. Materials and Methods
2.1. Experimental design
2.1.1. Comparison of conventional, immunological and molecular screening methods
First the sensitivity and specificity of one standard microscopic, two antibody-based and three nested PCR assays (targeted at the 18S rRNA gene locus) for the detection of Cryptosporidium in faecal samples (n = 182) from asymptomatic sheep (n = 66), cattle (n = 80), and horses (n = 36) were compared. Due to the absence of a gold standard for the detection of Cryptosporidium oocysts in faecal samples, the LCA statistical model was used to calculate the specificity and sensitivity of each test.
2.1.2. Comparison of three nested PCR protocols targeting the 18S rRNA gene locus
A separate set of samples (22 positive samples from cattle, 17 from horse, and 10 from sheep, respectively) were analysed with the same three PCR assays used earlier in order to determine their ability to amplify subclinical infections in the various animal hosts and identify the Cryptosporidium species present. The 49 samples had been found positive for the presence of Cryptosporidium oocysts by direct fluorescent antibody test (DFAT).
2.2. Sample collection, oocysts staining/labelling and microscopic examination
Overall 16 farms were sampled on a monthly basis from March to June 2009 and 2010. Nine farms including six mixed cattle and sheep and three mixed cattle and horse farms were located in the east of Ireland and seven farms (2 cattle, 3 sheep and 2 mixed cattle/sheep farms) in the west of the country. Faecal samples were collected on the ground and Cryptosporidium oocysts were concentrated using Sheather's flotation method (Smith, 2008). As it was mentioned in the Study design section, 182/231 (sheep (n = 66), cattle (n = 80) and horses (n = 36)) were submitted for analysis of different diagnostic methods and 49/231 were selected for analysis of three different 18S rRNA PCR protocols.
2.3. Kinyoun's carbol-fuchsin acid fast staining
Five microlitres of concentrated sample was added to a ten-well glass microscope slide (C.A.Hendley (Essex) Ltd., United Kingdom) and allowed to dry. Following fixing (100% methanol, 2 min), the slides were flooded with Kinyoun's carbol-fuchsin for 5 min. After a brief rinse with tap water, the slide was decolorised with acid alcohol (45–60 s) and rinsed again. Alcoholic methylene blue (1%, 1 min) was used as counterstain (Smith, 2008). All slides were screened at a magnification of 100×. In each slide a positive control containing Cryptosporidium oocysts isolated from a positive horse sample was included in one of the wells.
2.4. Direct fluorescent antibody test (DFAT)
Five microlitres concentrated sample were transferred to each well of a ten-well glass microscope slide and fixed by methanol. Twenty-five microlitres FITC-labelled anti-Cryptosporidium monoclonal antibody (CellLabs, Australia) were added to each well, the slides incubated at 37 °C in a humid chamber for 30 min and then rinsed in a bath of PBS. Subsequently the slide was drained and mounted with glycerol-based mounting fluid while still wet. All slides were screened using a fluorescence microscope (Nikon E400), initially at 20× magnification, then at 40× for confirmation. In each slide, a positive control with Cryptosporidium oocysts isolated from a positive-tested horse was included. For the negative control, the FITC antibody was added to a blank well on the slide (Smith, 2008). Spherical and sub-spherical structures, 4–8 μm in size, that stained a bright green fluorescent colour were identified as Cryptosporidium oocysts. All samples that contained one or more putative Cryptosporidium oocysts were considered positive. Together with samples that contained structures similar to Cryptosporidium oocysts, regardless of size, they were processed further for molecular analysis. The viablity of observed oocysts was not assessed in this experminet.
2.5. Enzyme-linked immunosorbent assay (ELISA)
A commercial ELISA kit (BIO-X Diagnostics, Belgium) was used to detect Cryptosporidium antigens following the manufacturer's instructions. The test was performed on faecal samples within a month after collection (until then they were maintained at 4 °C without preservative). The plate is coated with monoclonal antibody. Faecal samples were diluted and added to each coated well. After 1 hour incubation at 37 °C the conjugated monoclonal antibody was added. Following the incubation, the reaction was visualised by tetramethylbenzidine (TMB) and the results were read at 450 nm using Microplate ELISA reader (Thermo Scientific, USA).
2.6. DNA extraction
For the molecular tests DNA was extracted according to the method published by Boom et al., (1990) and McLauchlin et al., (1999). Briefly, approximately 200 μl of concentrated oocyst suspension mixed with 900 μl 10 M guanidinium thiocyanate in 0.1 M Tris–HCl (pH 6.4)–0.2 M EDTA (pH 8.0)–2% (w/v) Triton X-100, 0.3 g 0.5 mm diameter glass beads (Stratech Scientific, UK) and 60 μl isoamyl alcohol were homogenised in a Mini-Beadbeater (Stratech Scientific) for 2 min. The mixture was left at room temperature for 5 min, and then centrifuged (18,000 × g, 2 min). The supernatant was incubated with 100 μl of coarse activated silica at room temperature for 10 min with gentle agitation. Subsequently, the silica pellet was washed twice with 200 μl 10 M guanidinium thiocyanate in 0.1 M Tris–HCl (pH 6.4), twice with 200 μl of ice-cold 80% ethanol, and once with 200 μl ice-cold acetone at 13,000 × g for 20 s. After the final wash the pellet was dried under a vacuum at 45 °C for 10 min. The DNA was eluted into 150 μl nuclease free water after vortex mixing and incubation at 56 °C for 5 min. Following centrifugation at 18,000 × g for 2 min the supernatant was collected and stored in −20 °C. Prior to PCR amplification, all DNA extracts were purified by PVP (polyvinylpyrrolidone, Sigma) precipitation as follows: 50 μl extracted DNA was incubated with 150 μl PVP-TE (10% [w/v] PVP in TE buffer) for 10 min at room temperature. Subsequently 100 μl 2 M ammonium acetate and 600 μl isopropanol were added to the mixture and the DNA precipitated by incubating at −20 °C for 30 min. The DNA was pelleted by centrifugation (11,000 × g, 10 min), dried and reconstituted in 50 μl of water.
2.7. PCR amplification
Samples were screened using three nested PCR protocols, all of which target the same region of the 18S rRNA. Primer sequences and PCR conditions are provided in Table 1, taq polymerases were selected based on the published protocols by authors (Nichols et al., 2003, 2010; Ryan et al., 2003; Xiao et al. 1999, 2001).
Table 1.
Primers selected for amplification of 18S rRNA.
| Primer pair (product size) | Primer | Primer sequence (5′-3′) | Ref |
|---|---|---|---|
| Protocol 1 (840 bp) | XF1(Outer) fw | TTC-TAG-AGC-TAA-TAC-ATG-CG | Xiao et al., 1999, 2001 |
| XR1(Outer) rev | CCC-ATT-TCC-TTC-GAA-ACA-GGA | ||
| XF2(Inner) fw | GGA-AGG-GTT-GTA-TTT-ATT-AGA-TAA-AG | ||
| XR2(Inner) rev | AAG-GAG-TAA-GGA-ACA-ACC-TCC-A | ||
| Protocol 2 (587 bp) | 18SiCF2(outer) fw | GAC-ATA-TCA-TTC-AAG-TTT-CTG-ACC | Ryan et al., 2003 |
| 18SiCR2(outer) rev | CTG-AAG-GAG-TAA-GGA-ACA-ACC | ||
| 18SiCF1(Inner) fw | CCT-ATC- AGC-TTT-AGA-CGG-TAG-G | ||
| 18SiCR1(Inner) rev | TCT-AAG-AAT-TTC-ACC-TCT-GAC-TG | ||
| Protocol 3 (435 bp) | WR494 F(Outer) fw | TGA-GTK-AAG-TAT-AAA-CCC-CTT- TAC | Nichols et al., 2003, 2010 |
| XR1(Outer) rev | CCC-ATT-TCC-TTC-GAA-ACA-GGA | ||
| CPB-DIAGF(Inner) fw | AAG-CTC-GTA-GTT-GGA-TTT-CTG | ||
| CPB-DIAGR(Inner) rev | TAA-GGT-GCT-GAA-GGA-GTA-AGG |
All nested PCR products of the correct size were sent to GATC Biotech (Germany) for sequencing using the internal forward primers. If the sequence results were of poor quality, sequencing was repeated in the reverse. All sequences were compared against published data using a BLASTn search on PubMed (Altschul et al., 1990) to identify Cryptosporidium species. For further identification sequences were aligned with selected reference sequences using ClustalW program (Larkin et al., 2007)
2.8. Measurement of sensitivity of molecular tests
The sensitivity of each PCR protocol was determined based on the number of positive results observed from each test versus the overall number of positive results observed by combining all PCR protocols. PCR was considered positive if at least one of the three PCR protocols was reported positive.
2.9. Statistical models
PASW Statistics (formerly SPSS, Version 18) was used to measure the level of agreement between the methods. Pearson's chi-square and kappa tests were performed to measure the agreement between each diagnostic technique. Chi-squared test is significant when p-value is less than 0.05; kappa test is significant if kappa values are close to 1. Contingency tables and percentage agreements were used to determine total-, positive-, and negative-agreement between the tests.
As there is no gold standard for the detection of Cryptosporidium to measure the sensitivity and specificity of each test, LCA was performed to obtain the sensitivity and specificity of each test. LCA was constructed based on the status of Cryptosporidium infection (infected versus non-infected animals), which can be regarded as a pseudo-gold standard or as presumed true status of infection. LCA was conducted using the poLCA package in the statistics software R version 2.15 (R Core Team, 2012). LCA is based on the concept that observed results of different imperfect tests for the same infection are influenced by a latent common variable, the true infection status, which cannot be directly measured. In basic LCA models, the observed variables are assumed to be conditionally independent. In a group of hosts with unknown infection status, for whom results from several diagnostic tests are available, LCA models the probability of each combination of test results on the latent class and thereby provides an estimate of sensitivity and specificity for each of the diagnostic tests evaluated (Hui and Walter, 1980; Rindskopf and Rindskopf, 1986).
In order to understand the level of agreement between pairs of tests, raw measures of agreement between each individual test were measured using the P-values of chi-squared test, the kappa value of kappa's test (reported from SPSS output), the proportion of overall (PO), positive (PA) and agreement (PN) (Table 2). The measures of raw agreement (i.e. negative agreement (PN), positive agreement (PA) and overall agreement (PO)) indicated the number of instances in which two tests were in agreement regarding the status of a sample (i.e. positive or negative). The kappa test is used to assess the level of agreement between two tests. Pearson's chi-squared test was applied to evaluate how likely it is that any observed difference between the sets arose by chance. Both tests showed the statistical significant agreement between the results.
Table 2.
Raw measures of agreement between each two tests to detect Cryptosporidium in horse, sheep, and cattle samples.
| Chi-square test* (P-value) | Horse | Sheep | Cattle | ||||||
|---|---|---|---|---|---|---|---|---|---|
|
|
|
|
|||||||
| Kinyoun's | ELISA | PCR | Kinyoun's | ELISA | PCR | Kinyoun's | ELISA | PCR | |
| DFAT | 0.958 | 0.26 | 0.34 | 0.917 | 0.64 | 0.02 | 0.06 | 0.668 | 0.01 |
| Kinyoun's | 0.52 | 0.55 | 0.42 | 0.27 | 0.912 | 0.03 | |||
| ELISA | 0.05 | 0.75 | 0.65 | ||||||
| Kappa test**(κ) value | |||||||||
| DFAT | 0.008 | −0.147 | −0.13 | 0.009 | 0.05 | 0.37 | 0.287 | 0.04 | 0.34 |
| Kinyoun's | 0.09 | −0.07 | 0.07 | 0.10 | 0.01 | 0.33 | |||
| ELISA | −0.16 | −0.03 | 0.04 | ||||||
| PO ** | |||||||||
| DFAT | 0.63 | 0.63 | 0.41 | 0.51 | 0.75 | 0.83 | 0.68 | 0.68 | 0.72 |
| Kinyoun's | 0.77 | 0.44 | 0.54 | 0.56 | 0.57 | 0.68 | |||
| ELISA | 0.61 | 0.74 | 0.61 | ||||||
| PA ** | |||||||||
| DFAT | 0.23 | 0 | 0.27 | 0.23 | 0.2 | 0.47 | 0.48 | 0.24 | 0.52 |
| Kinyoun's | 0.2 | 0.23 | 0.28 | 0.32 | 0.26 | 0.57 | |||
| ELISA | 0 | 0.19 | 0.27 | ||||||
| PN ** | 0.76 | 0.77 | 0.51 | ||||||
| DFAT | 0.76 | 0.77 | 0.51 | 0.64 | 0.85 | 0.9 | 0.77 | 0.8 | 0.8 |
| Kinyoun's | 0.87 | 0.56 | 0.66 | 0.67 | 0.7 | 0.75 | |||
| ELISA | 0.56 | 0.84 | 0.73 | ||||||
p-value < 0.05 indicates there is a significant relationship between tests.
Values close to 1 indicate there is a significant relationship between tests.
3. Results
3.1. Comparison of conventional, immunological and molecular screening methods by host
The total numbers of positive samples, according to the various screening methods, are shown in Table 3. As it is illustrated, there is an association between the results obtained from both DFAT and PCR in cattle and sheep at 0.05 level of significance. Kinyoun's and DFAT showed to be associated in assessing cattle samples for presence of Cryptosporidium species. However, none of the diagnostic tests results illustrated significant agreement with each other to detect Cryptosporidium oocysts in horse samples. The number of instances in which the two tests agreed to report a positive or negative sample for detection of oocysts is presented in Table 2.
Table 3.
Percentage of positive results observed from each test.
| Sheep | Cattle | Horse | |
|---|---|---|---|
| Kinyoun's | 48.4% (32/66) | 38.5% (31/80) | 19.4% (7/36) |
| DFAT | 15.1% (10/66) | 22.5% (18/80) | 27.7% (10/36) |
| ELISA | 15.1% (10/66) | 18.7% (15/80) | 8.3% (3/36) |
| PCR | 16.6% (11/66) | 35% (28/80) | 52.7% (19/36) |
3.1.1. Cattle
According to the LCA model (Table 4), DFAT showed the best specificity (93%) for the detection of oocysts followed by PCR (84%), ELISA (82%) and microscopy of Kinyoun's stained slides (78%); PCR was the most sensitive test (78%), followed by examination of slides stained with Kinyoun's (76%) which in turn appeared to be more sensitive than DFAT (58%), or ELISA (22%) in cattle.
Table 4.
Specificity and sensitivity (%) of each test based on Latent Class Analysis.
| DFAT | Kinyoun's | ELISA | PCR | |
|---|---|---|---|---|
| Cattle | ||||
| Specificity | 93 | 78 | 82 | 84 |
| Sensitivity | 58 | 76 | 22 | 78 |
| Sheep | ||||
| Specificity | 80 | 84 | 24 | 10 |
| Sensitivity | 90 | 54 | 85 | 90 |
| Horse | ||||
| Specificity | 31 | 18 | 0 | 56 |
| Sensitivity | 100 | 66 | 0 | 100 |
3.1.2. Horse
Veronesi et al. (2010) demonstrated the effectiveness of DFAT for detecting Cryptosporidium oocysts in horse faecal samples. In the present study we found DFAT to be the most sensitive (100%) test but the specificity was somewhat lower (31%) for the detection of Cryptosporidium oocysts in horses. The highest specificity was observed by PCR (56%). However, measuring the level of agreement between DFAT and PCR for analyzing horse faecal samples, we found a low level of agreement in reporting positive samples.
3.1.3. Sheep
PCR found to be the the most sensitive and specific test to detect Cryptosporidium oocysts in all three hosts. As illustrated in Table 4 Kinyoun's staining showed the highest specificity in sheep compared to horse and cattle. However, the sensitivity of this test for assessing sheep samples is lower than the sensitivity observed in testing cattle and horses. DFAT provides the better reliability in screening sheep samples in terms of sensitivity (80%) and specificity (90%).
3.2. Comparison of different nested PCR protocols targeting the 18S rRNA gene locus
The sensitivity of the molecular tests was compared using DNA extracted from a different set of samples (horse, n = 17, sheep, n = 10, and cattle, n = 22). These samples were reported positive by DFAT screening. The combination of all three PCR assays identified 32 positive samples in total. PCR protocol 2 produced positive results in 31 samples whereas PCR protocol 1 and 3 resulted in amplification of cryptosporidial DNA in 11 and 10 samples, respectively.
Sequencing of the amplicons obtained with the three nested PCR protocols revealed the presence of a wide range of Cryptosporidium species in the samples. A number of samples (4/49) investigated in the present study appeared to carry multiple infections (Table 5). We found PCR protocol 2 provides a better sensitivity compared to protocols 1 and 3 in genotyping Cryptosporidium spp. in asymptomatic animal samples.
Table 5.
Sequencing results of the 49 animal samples selected for comparison of the three PCR protocols.
| Animal | Protocol 1 |
Protocol 2 |
Protocol 3 |
|---|---|---|---|
| Horse | – | Cryptosporidium spp. | – |
| Horse | – | Cryptosporidium spp. | – |
| Horse | – | Cryptosporidium spp. | – |
| Horse | – | Cryptosporidium spp. | – |
| Horse | – | C. parvum | N.S |
| Horse | C. andersoni | C. bovis | – |
| Horse | – | C. parvum | N.S |
| Horse | – | 0 | – |
| Horse | – | 0 | – |
| Horse | – | 0 | – |
| Horse | – | 0 | – |
| Horse | – | Cryptosporidium spp. | – |
| Horse | – | 0 | – |
| Horse | – | C. ryanae | – |
| Horse | N.S | C. ryanae | Cryptosporidium spp. |
| Horse | C. ryanae | C. ryanae | Cryptosporidium spp. |
| Horse | N.S | C. ryanae | C. parvum |
| Cattle | C. parvum | C. parvum/hominis | N.S |
| Cattle | – | Cryptosporidium spp. | – |
| Cattle | C. parvum | C. parvum | C. parvum |
| Cattle | – | C. parvum | – |
| Cattle | C. parvum | C. parvum | N.S |
| Cattle | – | C. ryanae | – |
| Cattle | – | N.S | – |
| Cattle | – | – | – |
| Cattle | – | – | – |
| Cattle | – | – | – |
| Cattle | C. bovis | C. bovis | – |
| Cattle | C. bovis | N.S | – |
| Cattle | – | – | – |
| Cattle | C. ryanae | Cryptosporidium spp. | – |
| Cattle | – | – | – |
| Cattle | – | – | – |
| Cattle | – | – | – |
| Cattle | – | C. ryanae | C. parvum |
| Cattle | – | – | – |
| Cattle | – | C. ryanae | – |
| Cattle | – | Cryptosporidium spp. | – |
| Cattle | – | – | – |
| Sheep | C. parvum | C. xiaoi/bovis | C. parvum |
| Sheep | – | – | – |
| Sheep | – | Cryptosporidium spp. | – |
| Sheep | – | Cryptosporidium spp. | – |
| Seep | – | C. parvum | – |
| Sheep | - | C. parvum | - |
| Sheep | – | C. parvum | – |
| Sheep | – | C. parvum | – |
| Sheep | – | C. parvum | – |
| Sheep | – | C. ubiquitum | – |
| Sheep | – | – | – |
| Sheep | – | – | – |
N.S Cryptosporidial DNA was amplified but the sequencing failed to provide information on Cryptosporidium genotype present in the sample.
– No DNA was amplified.
In some instances incomplete sequences were generated and it was not possible to identify some species. If less than 98% similarity match was found between the query sequence and reference sequences, the query sequence was identified as ‘Cryptosporidium spp.’ In some cases, it was not possible to distinguish between C. bovis and C. xiaoi or C. parvum and C. hominis due to the high sequence similarity in the 18S rRNA gene locus.
4. Discussion
4.1. Identification of a reliable test for the screening of animal faecal samples
Based on our findings, it is recommended to combine PCR and DFAT to screen livestock to maximise the chance of Cryptosporidium detection in asymptomatic cases. Our study also found reduced capacity of ELISA to identify presence of Cryptosporidium antigens in samples with low numbers of oocysts as well as false positive test results. This coincides with findings of Doing et al. (1999) and Johnston et al. (2003) both of which examined human stools samples.
Although traditional staining techniques have been reported to be less specific and sensitive (Clark, 1999; Morgan et al., 1998; Quilez et al., 1996), the present study shows examination of concentrated samples following Kinyoun's to be more specific in sheep (84%) than horses and cattle.
Clearly, the usefulness of antibody-based Cryptosporidium assays for detecting infections in animal samples requires more research, especially in light of the wide range of Cryptosporidium species that can infect animals. Most commercial assays were developed specifically for the detection of C. parvum and it is to be expected that their ability to detect other species or genotypes is highly variable. This study aimed to detect the whole range of Cryptosporidium species in three host animals and was not only focused on detection of C. parvum.
In agreement with the previous reports (Smith, 2008), our findings underline the better reliability of DFAT as a primary screening tool in veterinary diagnostics for the detection of Cryptosporidium oocysts in animal faecal samples compared to other methods assessed in this study. As was to be expected, the combination of three PCR protocols was the most sensitive and specific test for detecting Cryptosporidium oocysts in sheep and horse samples. For cattle samples, DFAT was found to be the most specific test while PCR was the most sensitive one.
4.2. Comparison of 3 PCR protocols
In a study by Leetz et al. (2007) it was concluded that PCR detection protocols for Cryptosporidium are not capable of detecting all isolates particularly in samples with low numbers of oocysts. The findings of this study and Leetz et al. (2007) highlight the difficulties in dealing with low oocyst numbers and/or low cryptosporidial DNA when working with environmental and/or faecal samples.
Since we are analysing three animal hosts, it is important to select a locus, which is conservative and can be easily amplified in a wide range of Cryptosporidium genotypes. On the other hand, too much similarity in the target sequence can make identification challenging.
Cryptosporidium genotypes have been characterised based on sequence differences in the small-subunit rRNAgene locus (18S rRNA), actin, COWP, and the 70-kDa heat shock protein (Plutzer and Karanis, 2009). Xiao et al. (1999) showed intraspecific variations in the nucleotide sequences of Cryptosporidium species and found differences within C. parvum isolates of human and bovine origin in four regions of 18S rRNA gene. Smith (2008) also stated the usefulness of 18S rRNA based molecular tests for identification of a wide range of Cryptosporidium genotypes. Although the locations of the primer sets within the 18S rRNA gene used in this study are very close to each other and in some cases even overlap (Fig. 1), different sensitivity of each protocol was obtained in this study. Analysing animal samples using protocol 2 (developed by Ryan et al., 2003) was the most sensitive test (96%) followed by nested PCR protocols 1 (34%) and 3 (31%). PCR products of the three protocols were sequenced to confirm the results and determine the specificity of all molecular tests for identification of Cryptosporidium species. Interestingly, different Cryptosporidium genotypes were amplified using each protocol (Table 5). PCR protocol 1 was repeated twice in order to increase the number of positive results, the results are combined together and presented in Table 5. The repeat resulted in an overall increase in the number of samples detected positive for Cryptosporidium species which was still lower than the number of positives by protocol 2.
Figure 1.
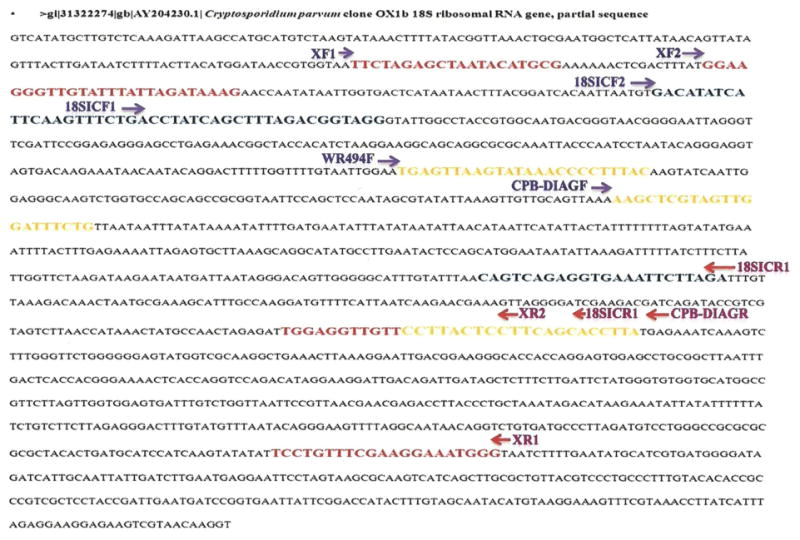
Location of primers on 18 S rRNA gene fragment of C. parvum Acc. AY204230.1.
We recommend application of DFAT and PCR for screening of sub-clinical horse samples. In addition to DFAT, Kinyoun's was found to be a suitable method for examination of cattle and sheep. This study also suggests that a combination of three nested PCR assays (protocols 1, 2, and 3) targeting the 18S rRNA gene locus provides a better understanding of the diversity of species in subclinical infections in livestock as well as the presence of mixed infections. However, the primers developed by Ryan et al. (2003) (protocol 2) was found to be the most reliable compared to the other primer sets (used in protocols 1 and 3) for screening animal faecal samples. Sequencing of the PCR products also confirmed the reliability of this protocol (Ryan et al., 2003). Our study highlights the difficulties in dealing with low oocyst numbers and/or low cryptosporidial DNA when working with environmental and/or faecal samples. Thus, the validation of protocols remains an important issue for further epidemiologic studies.
Highlights.
We analysed different diagnostic methods for the detection of Cryptosporidium in livestock.
Latent Class Analysis was used to as a pseudo-gold standard to assess the specificity and sensitivity.
The three published PCRs were compared to determine their ability to identify the Cryptosporidium spp.
We found the combination of DFAT and the three PCRs is necessary to detect asymptomatic infection.
Acknowledgments
This project was funded by Environmental Protection Agency, Ireland (2008-EH-MS-3-S3). The manuscript was completed when the corresponding author was supported by the National Center for Advancing Translational Sciences (NCATS), National Institutes of Health (NIH), Grant Number UL1 TR001064. The content is solely the responsibility of the authors and does not necessarily represent the official views of the NIH. We would like to thank farmers who kindly let us to have access to their farms during the sampling period. We are also thankful to Laura Garza Cuartero and Masoumeh Malek Mirzaee for their contribution to the lab work as well as Mr. Jonathan O'Malley.
References
- Altschul SF, Gish W, Miller W, Myers EW, Lipman DJ. Basic local alignment search tool. J Mol Biol. 1990;215:403–410. doi: 10.1016/S0022-2836(05)80360-2. [DOI] [PubMed] [Google Scholar]
- Boom R, Sol CJ, Salimans MM, Jansen CL, Wertheim-van Dillen PM, Van Der Noordda J. Rapid and simple method for purification of nucleic acids. J Clin Microbiol. 1990;28:495–503. doi: 10.1128/jcm.28.3.495-503.1990. [DOI] [PMC free article] [PubMed] [Google Scholar]
- Chalmers RM, Campbell BM, Crouch N, Charlett A, Davies AP. Comparison of diagnostic sensitivity and specificity of seven Cryptosporidium assays used in the UK. J Med Microbiol. 2011;60:1598–1604. doi: 10.1099/jmm.0.034181-0. [DOI] [PubMed] [Google Scholar]
- Chan R, Chen J, York MK, Setijono N, Kaplan RL, Graham F. Evaluation of a combination rapid immunoassay for detection of Giardia and Cryptosporidium antigens. J Clin Microbiol. 2000;38:393–394. doi: 10.1128/jcm.38.1.393-394.2000. [DOI] [PMC free article] [PubMed] [Google Scholar]
- Clark DP. New insights into human cryptosporidiosis. Clin Microbiol Rev. 1999;12:554–563. doi: 10.1128/cmr.12.4.554. [DOI] [PMC free article] [PubMed] [Google Scholar]
- Doing KM, Hamm JL, Jellison JA, Marquis JA, Kingsbury C. False-positive results obtained with the Alexon ProSpecT Cryptosporidium enzyme immunoassay. J Clin Microbiol. 1999;37:1582–1583. doi: 10.1128/jcm.37.5.1582-1583.1999. [DOI] [PMC free article] [PubMed] [Google Scholar]
- Garcia LS, Shimizu RY. Evaluation of nine immunoassay kits (enzyme immunoassay and direct fluorescence) for detection of Giardia lamblia and Cryptosporidium parvum in human fecal specimens. J Clin Microbiol. 1997;35:1526–1529. doi: 10.1128/jcm.35.6.1526-1529.1997. [DOI] [PMC free article] [PubMed] [Google Scholar]
- Garcia LS, Shimizu RY, Novak S, Carroll M, Chan F. Commercial assay for detection of Giardia lamblia and Cryptosporidium parvum antigens in human fecal specimens by rapid solid-phase qualitative immunochromatography. J Clin Microbiol. 2003;41:209–212. doi: 10.1128/JCM.41.1.209-212.2003. [DOI] [PMC free article] [PubMed] [Google Scholar]
- Hui SL, Walter SD. Estimating the error rates of diagnostic tests. Biometrics. 1980;36:167–171. [PubMed] [Google Scholar]
- Jex A, Smith H, Monis P, Campbell B, Gasser R. Cryptosporidium – biotechnological advances in the detection, diagnosis and analysis of genetic variation. Biotechnol Adv. 2008;26:304–317. doi: 10.1016/j.biotechadv.2008.02.003. [DOI] [PubMed] [Google Scholar]
- Jiang J, Xiao L. An evaluation of molecular diagnostic tools for the detection and differentiation of human pathogenic Cryptosporidium spp. J Eukaryot Microbiol. 2003;50:542–547. doi: 10.1111/j.1550-7408.2003.tb00623.x. [DOI] [PubMed] [Google Scholar]
- Johnston SP, Ballard MM, Beach MJ, Causer L, Wilkins PP. Evaluation of three commercial assays for detection of Giardia and Cryptosporidium organisms in fecal specimens. J Clin Microbiol. 2003;41:623–626. doi: 10.1128/JCM.41.2.623-626.2003. [DOI] [PMC free article] [PubMed] [Google Scholar]
- Kaushik K, Khurana S, Wanchu A, Malla N. Evaluation of staining techniques, antigen detection and nested PCR for the diagnosis of cryptosporidiosis in HIV seropositive and seronegative patients. Acta Trop. 2008;107:1–7. doi: 10.1016/j.actatropica.2008.02.007. [DOI] [PubMed] [Google Scholar]
- Larkin MA, Blackshields G, Brown NP, Chenna R, McGettigan PA, McWilliam H. ClustalW and ClustalX version 2. Bioinformatics. 2007;23(21):2947–2948. doi: 10.1093/bioinformatics/btm404. [DOI] [PubMed] [Google Scholar]
- Laxer MA, Timblin BK, Patel RJ. DNA sequences for the specific detection of Cryptosporidium parvum by the polymerase chain reaction. Am J Trop Med Hyg. 1991;45:688–694. doi: 10.4269/ajtmh.1991.45.688. [DOI] [PubMed] [Google Scholar]
- Leetz AS, Sotiriadou I, Ongerth J, Karanis P. An evaluation of primers amplifying DNA targets for the detection of Cryptosporidium spp. using C. parvum HNJ-1 Japanese isolate in water samples. Parasitol Res. 2007;101:951–962. doi: 10.1007/s00436-007-0567-y. [DOI] [PubMed] [Google Scholar]
- McLauchlin J, Pedraza-Diaz S, Amar-Hoetzeneder C, Nichols G. Genetic Characterization of Cryptosporidium strains from 218 patients with diarrhea diagnosed as having sporadic cryptosporidiosis. J Clin Microbiol. 1999;37:3153–3158. doi: 10.1128/jcm.37.10.3153-3158.1999. [DOI] [PMC free article] [PubMed] [Google Scholar]
- Morgan U, Thompson R. PCR detection of Cryptosporidium: the way forward? Parasitol Today. 1998;14:241–245. doi: 10.1016/s0169-4758(98)01247-2. [DOI] [PubMed] [Google Scholar]
- Morgan UM, Constantine CC, O'Donoghue P, Meloni BP, O'Brien PA, Thompson R. Molecular characterization of Cryptosporidium isolates from humans and other animals using random amplified polymorphic DNA analysis. Am J Trop Med Hyg. 1995;52:559–564. doi: 10.4269/ajtmh.1995.52.559. [DOI] [PubMed] [Google Scholar]
- Morgan UM, Pallant L, Dwyer B, Forbes D, Rich G, Thompson R. Comparison of PCR and microscopy for detection of Cryptosporidium parvum in human fecal specimens: clinical trial. J Clin Microbiol. 1998;36:995–998. doi: 10.1128/jcm.36.4.995-998.1998. [DOI] [PMC free article] [PubMed] [Google Scholar]
- Newman R, Jaeger K, Wuhib T, Lima A, Guerrant R, Sears C. Evaluation of an antigen capture enzyme-linked immunosorbent assay for detection of Cryptosporidium oocysts. J Clin Microbiol. 1993;31:2080–2084. doi: 10.1128/jcm.31.8.2080-2084.1993. [DOI] [PMC free article] [PubMed] [Google Scholar]
- Nichols R, Campbell B, Smith H. Identification of Cryptosporidium spp. oocysts in United Kingdom noncarbonated natural mineral waters and drinking waters by using a modified nested PCR-restriction fragment length polymorphism assay. App Env Microbiol. 2003;69:4183–4189. doi: 10.1128/AEM.69.7.4183-4189.2003. [DOI] [PMC free article] [PubMed] [Google Scholar]
- Nichols R, Connelly L, Sullivan C, Smith H. Identification of Cryptosporidium species and genotypes in Scottish raw and drinking waters during a one-year monitoring period. Appl Environ Microbiol. 2010;76:5977–5988. doi: 10.1128/AEM.00915-10. [DOI] [PMC free article] [PubMed] [Google Scholar]
- Plutzer J, Karanis P. Genetic polymorphism in Cryptosporidium species: an update. Vet Parasitol. 2009;165:187–199. doi: 10.1016/j.vetpar.2009.07.003. [DOI] [PubMed] [Google Scholar]
- Plutzer J, Törökné A, Karanis P. Combination of ARAD microfibre filtration and LAMP methodology for simple, rapid and cost effective detection of human pathogenic Giardia duodenalis and Cryptosporidium spp. in drinking water. Lett App Microbiol. 2010;50:82–88. doi: 10.1111/j.1472-765X.2009.02758.x. [DOI] [PubMed] [Google Scholar]
- Quilez J, Sánchez-Acebo C, Clavel A, Del Cacho E, Lopez-Bernad F. Comparison of an acid-fast stain and a monoclonal antibody-based immunofluorescence reagent for the detection of Cryptosporidium oocysts in faecal specimens from cattle and pigs. Vet Parasitol. 1996;67:75–81. doi: 10.1016/s0304-4017(96)01023-0. [DOI] [PubMed] [Google Scholar]
- R Core Team. R: A Language and Environment for Statistical Computing. R Foundation for Statistical Computing; Vienna, Austria: 2012. [Google Scholar]
- Rindskopf D, Rindskopf W. The value of latent class analysis in medical diagnosis. Stat Med. 1986;5:21–27. doi: 10.1002/sim.4780050105. [DOI] [PubMed] [Google Scholar]
- Robert B, Ginter A, Antoine H, Collard A, Coppe P. Diagnosis of bovine cryptosporidiosis by an enzyme-linked immunosorbent assay. Vet Parasitol. 1990;37:1–8. doi: 10.1016/0304-4017(90)90020-C. [DOI] [PMC free article] [PubMed] [Google Scholar]
- Ryan U, Xiao L, Read C, Zhou L, Lal AA, Pavlasek I. Identification of novel Cryptosporidium genotypes from the Czech Republic. App Env Microbiol. 2003;69:4302–4307. doi: 10.1128/AEM.69.7.4302-4307.2003. [DOI] [PMC free article] [PubMed] [Google Scholar]
- Smith H. Diagnostics. In: Fayer R, Xiao L, editors. Cryptosporidium and Cryptosporidiosis. CRC Press; Boca Raton, FL: 2008. pp. 173–207. [Google Scholar]
- Sterling CR, Arrowood MJ. Detection of Cryptosporidium sp. infections using a direct immunofluorescent assay. Pediatr Infect Dis. 1986;5:139–142. doi: 10.1097/00006454-198601001-00022. [DOI] [PubMed] [Google Scholar]
- Sulaiman IM, Xiao L, Lal AA. Evaluation of Cryptosporidium parvum genotyping techniques. App Env Microbiol. 1999;65:4431–4435. doi: 10.1128/aem.65.10.4431-4435.1999. [DOI] [PMC free article] [PubMed] [Google Scholar]
- Ungar B. Enzyme-linked immunoassay for detection of Cryptosporidium antigens in fecal specimens. J Clin Microbiol. 1990;28:2491–2495. doi: 10.1128/jcm.28.11.2491-2495.1990. [DOI] [PMC free article] [PubMed] [Google Scholar]
- Veronesi F, Passamonti F, Cacciò S, Diaferia M, Piergili Fioretti D. Epidemiological survey on equine Cryptosporidium and Giardia infections in Italy and molecular characterization of isolates. Zoonoses Public Health. 2010;57:510–517. doi: 10.1111/j.1863-2378.2009.01261.x. [DOI] [PubMed] [Google Scholar]
- Widmer G. Genetic heterogeneity and PCR detection of Cryptosporidium parvum. Adv Parasitol. 1998;40:223–239. doi: 10.1016/s0065-308x(08)60122-0. [DOI] [PubMed] [Google Scholar]
- Widmer G, Tzipori S, Fichtenbaum C, Griffiths J. Genotypic and phenotypic characterization of Cryptosporidium parvum isolates from people with AIDS. J Infect Dis. 1998;178:834–840. doi: 10.1086/515373. [DOI] [PubMed] [Google Scholar]
- Xiao L, Morgan UM, Limor J, Escalante A, Arrowood M, Shulaw W, et al. Genetic diversity within Cryptosporidium parvum and related Cryptosporidium species. App Env Microbiol. 1999;65:3386–3391. doi: 10.1128/aem.65.8.3386-3391.1999. [DOI] [PMC free article] [PubMed] [Google Scholar]
- Xiao L, Bern C, Limor J, Sulaiman I, Roberts J, Checkley W, et al. Identification of 5 types of Cryptosporidium parasites in children in Lima, Peru. J Infect Dis. 2001;183:492–497. doi: 10.1086/318090. [DOI] [PubMed] [Google Scholar]