

Abstract
Understanding the biology of Waldenström Macroglobulinemia is hindered by a lack of preclinical models. We report a novel cell line, RPCI-WM1, from a patient treated for WM. The cell line secreted human IgM (hIgM) with k-light chain restriction identical to the primary tumor. The cell line has a modal chromosomal number of 46 and harbors chromosomal changes such as deletion of 6q21, monoallelic deletion of 9p21 (CDKN2A), 13q14 (RB1) and 18q21 (BCL-2) with a consistent amplification of 14q32 (IgH) identical to its founding tumor sample. Clonal relationship was confirmed by identical CDR3 length and single nucleotide polymorphisms as well as a matching IgH sequence of the cell line and founding tumor. Both also harbor a heterozygous, non-synonymous mutation at amino acid 265 in MYD88 gene (L265P). The cell line expresses most of the cell surface markers present on the parent cells. Over all, RPCI-WM1 represents a valuable model to study WM.
Keywords: Waldenström Macroglobulinemia, cell line, preclinical, model
Introduction
Waldenström macroglobulinemia (WM) is a rare hematologic malignancy of B cell origin. Clinically, WM is characterized by bone marrow infiltration with small lymphocytic or lymphoplasmacytoid cells, hepatosplenomegaly and/or lymphadenopathy. An important hallmark of WM is the production of monoclonal IgM, which is often associated with increased serum viscosity and physical-chemical symptoms [1–3]. The median age at the time of diagnosis is 63 years, and there is a slightly higher incidence in males. While the precise etiology of WM remains enigmatic, it is believed that WM cells arise from post-germinal center B-lymphocytes, which have undergone somatic hypermutation and are transformed before isotype switching [4] and acquired a capability to secrete monoclonal IgM.
Immunophenotypically, the B cells in WM typically demonstrate surface expression of IgM+, CD5−, CD10−, CD19+, CD20+, CD22+, CD23−/dim+, CD25+, CD27+, FMC7+ and CD103− [5,6]. A recent report noted a single nucleotide change that resulted in a non-synonymous change in a single amino acid L265P in myeloid differentiation primary response gene (MYD88) in WM tumors and the cell lines [7]. It has also been shown to be a gain-of-function driver mutation [8] and was suggested to be a useful marker for the progression of Immunoglobulin M Monoclonal Gammopathies of Undetermined Significance (MGUS) to WM.
The clinical course of WM is heterogeneous. While many patients have an indolent disease and do not require treatment, symptomatic patients are treated with purine analogs (fludarabine and cladribine), alkylating agents (cyclophosphamide and chlorambucil), and/or rituximab, a chimeric anti-CD20 monoclonal antibody [9–16]. It is reported that IgM paraproteinemia persists, even after a successful therapy that decreases or eliminates the B lymphocytes from WM patient’s bone marrow, suggesting the persistence of a component of Lymphoplasmacytic lymphoma (LPL) [17]. Barakat et al reported that monotypic plasma cells persist in WM patients after therapy, suggesting a need of attention on post-therapy plasmacytosis in WM [18]. Further, acquired drug resistance is an emerging concern in WM, and the molecular mechanisms are poorly understood. This is due to a limited availability of reliable pre-clinical models of WM that represent the heterogeneity of the disease [19].
We report the development of a novel IgM-secreting, κ-immunoglobulin light chain restricted human WM cell line. RPCI-WM1 (Roswell Park Cancer Institute – Waldenströms Macroglobulinemia 1) was cultured (posthumously) from the lymph nodes of a female patient with WM. A comparative analysis of the tumor cells from the index patient and the derived cell line clearly demonstrates the clonal descent of the cell line from the index patient. The immunophenotypic properties indicate that the cell line resembles a distinct clone of the patient that retained the IgM secretion and several of the salient features of the disease. This model adds significant strength to the limited existing preclinical models in WM and enhances our capabilities to further understand the oncogenic processes engaged in development of lymphoplasmacytic lymphomas.
MATERIALS AND METHODS
The Roswell Park Cancer Institute - Waldenströms Macroglobulinemia 1 (RPCI-WM1) human cancer cell line was established from a female patient described below:
The index patient
Patient MM was a 48-year-old female, diagnosed with WM in 2002. At the time of her diagnosis, she presented with IgMκ monoclonal gammopathy in the serum (Figure 1B) that was associated with extensive lymphadenopathy, splenomegaly, and bone marrow involvement with small lymphocytes with plasmacytoid differentiation. Immunophenotypic characterization of the tumor cells by flow cytometry was consistent with a diagnosis of WM. The tumor cells expressed CD19+, CD20+, CD22+, and surface kappa light chain+, but lacked CD5, CD23 and CD138. The patient was treated with a series of different regimens over a period of several years. These included fludarabine, alone and then in combination with rituximab, a combination of bortezomib, pegylated liposomal doxorubicin, thalidomide, a combination of cyclophosphamide, dexamethasone and lenalidomide, rituximab alone and sildenafil. Despite all efforts, the patient succumbed to her disease six years after the initial diagnosis. The patient donated her tumor tissue for medical research, which was harvested immediately following her death.
Figure 1. Tumor cells from the WM patient retain their capability to secrete IgM with κ light chain restriction in the mouse xenograft and in the RPCI-WM1 cell line.

A. A typical subcutaneous WM tumor grew up to 2.0 cm in mice at the time of extraction.
B & C. IFE analysis of sera collected from the index patient and from primary, secondary and tertiary tumors tested positive for IgM, and κ light chain.
D. Mice bearing WM tumors showed a steady increase in the serum IgM levels as the tumor grew and reached a maximum of 280±40 mg/dL at the time of tumor extraction.
E. Supernatants from the RPCI-WM1 cell cultures grown in vitro also were found to be positive for IgM and κ light chain as determined by IFE.
F. H&E staining of RPCI-WM1 cells
G. RPCI-WM1 cell stained with anti-human IgM antibody followed by Alexa 594 conjugated secondary antibody for cytoplasmic IgM.
H. RPCI-WM1 cell stained with FITC-conjugated anti human Ig-kappa light chain antibody.
I. RT-PCR analysis of BCWM.1, MWCL-1 and RPCI-WM1 cells for EBV-LMP1. While both BCWM.1 (lane 1; top panel) and MWCL-1 (lane 2; top panel) cells are positive for LMP1 with a 221bp product, RPCI-WM1 cells are negative for the same. Lane 4 is without any template RNA. β-actin is used as a control that gave a 629bp product (lower panel).
Development of the RPCI-WM1 cell line
With prior informed consent from the patient and with the approval of Roswell Park Cancer Institute’s Institutional Review Board, tumor-bearing lymph nodes were collected from the patient posthumously. Lymph node tumor tissue of approximately 1 mm in size was implanted subcutaneously in severe combined immunodeficient (SCID) mice of 10–12 weeks of age. When tumors reached 1.5–2.0 cm, movement of the mice was visibly limited from tumor burden, and the animals were sacrificed. Tumor tissue was excised and paraffin embedded for histology, frozen in dimethyl sulfoxide (DMSO), preserved in RNAlater (Qiagen, Valencia, CA) for RNA analysis, and surgically re-implanted (1 mm pieces) into fresh mice (secondary tumors). The tumor tissue was collected from the mice, minced, filtered using a 70 μm cell strainer (Becton Dickinson, Bedford, MA), and the cells were cultured in RPMI-1640 medium containing 10% heat-inactivated fetal bovine serum (FBS) and 1% 10 000 U/mL penicillin and 10 000 μg/mL streptomycin (Mediatech, Manassas, VA). Cells were maintained at 37°C in an atmosphere containing 5% CO2. RPCI-WM1 cell growth and viabilities were determined by trypan blue exclusion using a Beckman Coulter Vi-Cell XR cell viability analyzer. Cell cultures were routinely tested for the presence of mycoplasma using MycoAlert mycoplasma detection ELISA kit [Lonza, Rockland, ME].
Detection and quantification of human IgM (h-IgM)
Immunofixation electrophoresis (IFE) analysis was performed on samples using Helena Laboratories Titan Gel IFE agarose gel plates (Helena Laboratories, Beaumont, TX) on Helena Laboratories SPIFE 3000 instrumentation. Antisera for IgM, kappa (κ) light chain, and lambda (λ) light chain (Helena Laboratories) were used to detect hIgM, κ and λ light chains respectively. Acid Violet stain was utilized to stain the gels. Quantitative IgM was measured on a Beckman Image nephelometer (Beckman coulter Instruments, Brea, CA) and reported in mg/dL. Cytospin preparations of the cells were stained with mouse-anti human IgM (Invitrogen) followed by Alexa594-conjugated anti-mouse IgG for immunofluorescence studies.
Immunophenotype analysis
The immunophenotypic characterization of the RPCI-WM1 cell line was performed using multi-parameter flow cytometry. Cells were labeled with directly conjugated monoclonal antibodies (mAbs) and analyzed using standard techniques [20]. Antibodies specific for CD2, CD3, CD4, CD5, CD7, CD8, CD10, CD11c, CD13, CD14, CD16, CD19, CD20, CD23, CD24, CD25, CD28, CD30, CD34, CD38, CD40, CD45RA, CD45RO, CD52, CD66b, CD70, CD79b, CD80, CD86, CD117, CD138, FCM7, and IgM were used as conjugates for fluorescein (FITC), phycoerythrin (PE), phycoerythrin-cyanine5 (PC5), peridinin chlorophyll-a protein cy5.5 (PCPCY5.5), PE (BC) or allophycocyanin (APC). Cytofluorometric analysis was performed using a FACS Calibur (BD BioSciences) flow cytometer equipped with 488 nm argon-ion and 635 nm red diode lasers. The data were acquired using CellQuest software and analyzed using WinList multiparameter analysis software (Verity Software House, Topsham, ME). For assessing viability of RPCI-WM1 cells in co-cultures with DCs, the cells were stained with PE-conjugated monoclonal anti-human CD11b (DC marker) antibody, Annexin V-FITC and 7AAD.
Spectral karyotype (SKY) analysis
Cells in log phase were treated with 0.06μg/ml of colcemid for 2 hours and metaphase chromosomes were prepared using air-drying methods. After sequential digestion with RNase and pepsin according to the procedure recommended by Applied Spectral Imaging, Inc. (ASI: Vista, CA 92081), the chromosomal DNA on slides was denatured in 70% formamide and then hybridized with a cocktail of human SKY paint probes tagged with various nucleotide analogues [21,22]. The slides were observed and scored under a Nikon fluorescent microscope.
SNP genotyping analysis
Genomic DNA was isolated from the tumor cells of the index patient and the RPCI-WM1 cell line using Gentra Puregene genomic DNA purification kit (Qiagen, Valencia, CA). SNP genotyping was performed using the MassARRAY Compact system (Sequenom, San Diego, CA) [23] using 22 single-nucleotide polymorphisms (SNPs) that have previously been reported to detect distinct genotype profiles from different human DNA samples. Real time genotyping calls were performed by the MassARRAY typer software (Sequenom, San Diego, CA) and written to an Oracle 8i database. The relationship between the index patient and RPCI-WM1 cell line was determined by comparing the SNP results from the respective DNA samples.
DNA fragment analysis of IgH V/D/J rearrangement
Genomic DNA from RPCI.WM1 cells and the index patient tumor cells was prepared using DNA Puregene genomic DNA purification kit (Qiagen, Valencia, CA). Molecular studies of gene rearrangements in the immunoglobulin heavy chain (IGH) loci were performed using IVS IGH kit (InVioScribe, San Diego, CA) following manufacturer’s protocol. PCR was performed with 300ng of DNA per reaction and the products were mixed with size standards and formamide, denatured, and subjected to electrophoresis on an ABI 3130xl Genetic Analyzer (Life Sciences, Foster City, CA). The automatically collected data were analyzed using Gene Mapper version 4.0 software as described in the manufacturer’s manual.
Array comparative genomic hybridization (aCGH) analysis
One microgram of genomic DNA was labeled using Bioarray Kit (Enzo Life Sciences, Farmingdale, NY) prior to subsequent hybridization to a RPCI 21K BAC array (Roswell Park Cancer Institute) using a GeneTAC hybridization station (DigiLabs, Inc., Palo Alto, CA). Sex-mismatched pooled DNA from 20 healthy donors was used as reference DNA. After hybridization, the arrayed slides were scanned on a Genepix 4200A Scanner (Molecular Devices, Silicon Valley, CA). Image analysis was performed using ImaGene (version 8.0.0) software from BioDiscovery, Inc. The mapping data for each BAC was found by querying the human genome sequence at http://genome.ucsc.edu [24].
Fluorescent in situ hybridization (FISH) analysis
FISH analysis was done on index patient cells and RPCI-WM1 cells fixed in Carnoy’s fixative. Commercially available probes from Abbott Molecular Inc. (Abbott Park, IL) were used according to manufacturer’s recommendations. The Vysis LSI P16 (SpectrumOrange)/centromere enumeration probe (CEP) 9 (SpectrumGreen) probe set was used to identify deletions of the P16 locus on chromosome 9p21. Vysis LSI 13 (SpectrumGreen) probe was used to identify RB1 on chromosome 13q14. Vysis LSI BCL-2 dual color break apart rearrangement probe was used to identify Bcl-2 at 18q21 locus. LSI IGH dual color break apart probe was used to identify IGH at locus 14q32. For the 6q21 locus, a BAC clone (RP11-165E15) made in the Institute was fluorescent labeled and used. Slides were visualized and analyzed on a Nikon Microscope using the CytoVision Program (Applied Imaging, Inc Grand Rapids, MI.).
RT-PCR analysis
RNA was isolated from RPCI-WM1 cells using TRIzol® Reagent (Life Technologies, Grand Island, NY) following the manufacturer’s protocol. A 0.2μg aliquot of RNA was then subjected to RT-PCR using the SuperScript III™ One-Step RT-PCR System with Platinum® Taq DNA polymerase (Invitrogen, Grand Island, NY). Amplification conditions of LMP1 consisted of an initial denaturation step of 94°C for five minutes, followed by 30 successive cycles of 30 seconds at 94°C (denaturing), 40 seconds at 57°C (annealing), and 40 seconds at 72°C (extension). Reactions included a negative control that lacked any template. The following primers (Integrated DNA Technologies, San Diego, CA) were used: LMP1 (forward) 5′-CGT TAT GAG TGA CTG GAC TGG A-3′ (reverse) 5′-TGA ACA GCA CAA TTC CAA GG-3′, 221-bp product; β-actin (forward) 5′-GGA CTT CGA GCA AGA GAT GG-3′ (reverse) 5′-CAC CTT CAC CGT TCC AGT TT-3′, 629-bp product. For MYD88, the primers used were (forward) 5′-TGCCAGGGGTACTTAGATGG-3′ and (reverse)5′-GAAGTTGGCATCTCCAGGAA-3′ with a 398-bp product.
Statistical analysis
Student’s t-test analysis was used to obtain P values as a means of assessing significant differences between treatments.
RESULTS
In an effort to develop a preclinical model of WM, tumor tissue from the index patient was implanted into SCID mice. Tissue obtained from the resulting xenografted tumors were harvested and cultured in-vitro for development of a WM cell line.
Development of the mouse Xenograft model of WM
We hypothesized that the tumors from lymph nodes would have a suitable inherent microenvironment to aid in initial growth of the tumor cells until they became acclimatized to that of the host mouse. Thus, pieces of tumor (rather than isolated tumor cells) of approximately 1.0 mm size were subcutaneously implanted in host mice. During the first passage, 25% of the SCID mice developed subcutaneous tumors in 14 weeks. Once the tumor reached a size of 1.5–2.0 cm, movement of the mice was visibly limited and the animals were sacrificed (Figure 1A). The tumor tissue was collected and re-implanted subcutaneously into new mice (approximately 1.0 mm size pieces). The mice developed the tumors (secondary) within eight weeks. The process was repeated using secondary tumors. Tertiary tumors developed from the secondary tumors in much less time (four weeks) suggesting that once the tumor is attuned to the host microenvironment, its growth rate increases. The tumorigenic potential of the neoplasm was assessed by freezing tumor pieces from different passages in freezing medium for varying duration (up to one year) and retesting their ability to form tumors in mice. These tumor pieces were observed to retain their tumorigenic potential and grew at the same rate as the tumor tissue they from which they were derived, suggesting that the xenograft had attained a stable and tumorigenic stage for its use as a preclinical xenograft model for WM.
Tumor cells from the index patient secreted monoclonal IgM with κ light chain restriction (Figure 1B). To validate this in the mouse xenograft model of WM, blood was collected by cardiac puncture from mice harboring the WM tumor at the time of tumor collection; the presence of h-IgM and κ light chain was determined by serum IFE analysis and the IgM levels were further quantified. All tumors obtained from different passages secreted monoclonal h-IgM with κ light chain restriction, suggesting that the tumors are indeed derived from human tissue with the ability to secrete h-IgMκ consistent with the index patient (Figure 1C). Increase in h-IgMκ levels in mouse serum correlated with the time and tumor size during tumor development in the mouse, acquiring a plateau at an average maximum of 280.0±40 mg/dL corresponding with animal morbidity and time of tumor collection (Figure 1D).
Development of a WM cell line in-vitro
The tumor tissue from the mice xenograft model was used to develop a cell line. Tumor chunks obtained were processed as previously described and cultured in-vitro with growth medium changed every 72h. Initial evidence of in-vitro cell proliferation was observed after 8–10 weeks of culture. The proliferation rate was highest for tertiary, second highest for secondary tumors, and lowest for cells from the primary tumors. A sustained proliferation was consistently observed in cells derived from a secondary tumor, and the cell line was isolated and characterized from it. This clone was named as RPCI-WM1 and the cells were noted to be non-adherent, growing in clusters and secreted h-IgMκ in the supernatant and showed significant cytoplasmic hIgM with a positive staining for membrane kappa light chain (Figure 1E–H). RPCI-WM1 cells show a doubling time of around 34h in RPMI-1640 containing 10% heat inactivated Fetal Bovine Serum and maintained proliferative potential in-vitro through several (at least 20 continuous) passages. Cells are grown in standard culture flask, at minimum density of 0.2million cells/ml and a maximum density of 1 million cells/ml. Furthermore, the cells were frozen in liquid nitrogen and revived in culture without alteration in growth patterns. This indicates that the tumor cells from the index patient required a passage through the mouse to attain the ability of sustained proliferation. The cell line was negative for the Epstein-Barr Virus (EBV) latent membrane protein-1 (LMP1) confirming that RPCI-WM1 cells are not EBV transformed (Figure 1I). Further, when injected subcutaneously into mice, RPCI-WM1 cells formed tumors in four weeks, indicating that the cell line retained its ability to form tumors in mice.
Characterization of the RPCI-WM1 cell line
Cytogenetic analysis
Spectral karyotype analyses were performed at different passages. In view of the types/numbers of marker chromosomes, as well as the level of heterogeneity, the RPCI-WM1 cell line appears to have attained durable chromosomal stability in culture, indicating a highly monoclonal origin. Importantly, more than 95% of the cells analyzed were found to show a modal chromosomal number of 46. The common markers observed in these cells were deletion of a part of chromosome 3, der(6)t(6;9), rcpt(8;22), der(9)t(6;9), dup(11), der(14)t(3;14), der(19)t(5;19), two rcpt(18;19), der(18)t(3;10;14;18) and del(X) (Figure 2A).
Figure 2. Cytogenetic parameters indicate that RPCI-WM1 cells are derived from a WM patient tumor.
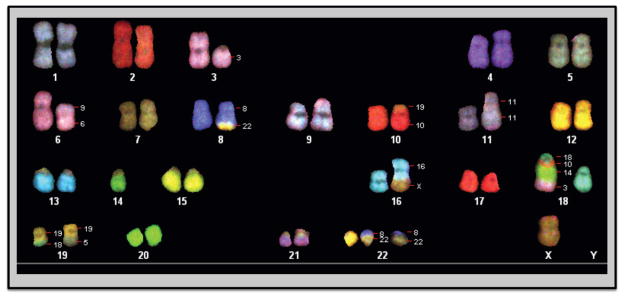

A. Spectral Karyotyping (SKY) analysis. Chromosomes were prepared from RPCI-WM1 cells after treatment with 0.06ug/ml of colcemid and SKY analysis was performed on metaphase chromosomes. Deletion of a part of chromosome 3, der(6)t(6;9), rcpt(8;22), der(9)t(6;9), dup(11), der(14)t(3;14), der(19)t(5;19), two rcpt(18;19), der(18)t(3;10;14;18) and del(X).
B (i–vi). Array comparative genomic hybridization (aCGH) analysis. aCGH analysis was performed to compare characteristics of the index patient with RPCI-WM1. Loss of chromosomal material was observed at 6q21-22, 9p21 and 13q14-21 in both patient tumor cells (i, iii and v) and RPCI-WM1 cells (ii, iv and vi).
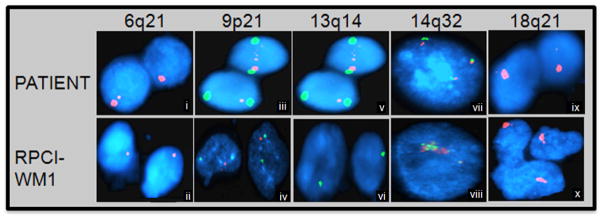
C (i–x). FISH analysis confirmed molecular aberrations in primary patient cells and the resulting cell line (RPCI-WM1) using specific regional marker gene probes. An in house BAC probe (RP11-165E15) was used to probe the 6q21-22 region (i & ii). A Vysis LSI P16 (SpectrumOrange) (SO)/CEP 9 (SpectrumGreen) (SG) probe set was used to identify deletions of the P16 locus at 9p21 (iii & iv). A Vysis LSI 13 (SG) probe, that detects RB1, maps the 13q14 region (v & vi). LSI IGH dual color break apart probe was used to identify IgH at locus 14q32 (vii& viii). A Vysis LSI BCL-2 dual color break- apart rearrangement probe was used to identify BCL-2 at 18q21 locus (ix & x). Slides were visualized and analyzed on a Nikon Microscope using the CytoVision Program. Consistent with the primary patient sample (I, iii, v, vii, ix), RPCI-WM1 cells (ii, iv, vi, viii, x) also show similar changes suggesting a cytogenetic relation between the two.
Array comparative genomic hybridization (aCGH) analysis was performed on both RPCI-WM1 and index patient cells. Several chromosomal changes were observed, and significantly, most of the changes observed in the index patient were reproduced in the cell line. Deletion of chromosome 6q21-22 was found in both the patient and the cell line (Figure 2Bi & ii). This deletion has been widely reported and is the most common chromosomal abnormality that differentiates WM from MGUS [25]. Other changes such as a deletion in chromosomal locus 9p21, that harbors the cell cycle regulatory gene CDKN2A encoding for p16INK4 and p14(ARF) were seen in both the patient cells and RPCI-WM1 cell line (Figure 2Biii & iv). Moreover, data from aCGH analysis revealed a loss of the 13q14 locus, where the retinoblastoma-1 gene (RB1) is located in the cell line as well the index patient’s cells (Figure 2Bv & vi). Apart from these, aCGH analysis of RPCI-WM1 shows a significant amplification at 14q32 where the IgH gene is located and a loss at chromosome 18q21-22, where the BCL-2 gene resides. These changes were not detected in the patient tumor cells.
We validated the changes detected on aCGH analysis using FISH (Fluorescent In Situ Hybridization) studies (Figures 2C [i–x]). The data confirmed the deletion of the CDKN2A locus (29/100 cells in the patient, 96/100 cells in the cell line) and the RB1 locus at 13q14 (19/100 cells in the patient, 94/100 cells in the cell line), along with a deletion of 6q21. Using a probe for the IgH gene, FISH analysis demonstrated amplification of this gene in both the index patient and the cell line. For BCL-2, the probe detected a monoallelic deletion in 28 and 97% of the index patient and RPCI-WM1 cells, respectively. Hence, these cytogenetic analyses clearly demonstrate that the developed cell line, RPCI-WM1, represents the index patient tumor cells.
Clonal relationship between RPCI-WM1 cell line and the index patient
Cytogenetic analyses identified similarities between the index patient and RPCI-WM1. We performed SNP genotyping and IgH CDR3 length analysis after FR1c/JHc amplification in both the patient tumor cells and the cell line to further confirm evolution of the RPCI-WM1 clone from the patient. SNP analysis was performed to demonstrate the identical DNA fingerprints using predetermined SNPs. This analysis was repeated several times, each time using no less than 20 SNPs during the course of cell line establishment. In all the studies, the cell line shares 100% of the genotype calls with those found in the index patient confirming the derivation of RP CI-WM1 from the index patient (Table I). CDR3 length analysis was performed to evaluate the clonal relationship of the cell line with the index patient. Both the patient and the cell line have an identical monoclonal peak at position 347.49, suggesting a clear clonal relationship between the patient and the cell line (Figure 3A). Further, IgVH sequence homology between the index patient and the cell line was also confirmed (Figure 3B). VH6-1 was found to be the specific gene of use with 93.27% sequence identity. These results confirm the clonal evolution of the RPCI-WM1 cells from the founding tumor cells of the index patient.
Table I. SNP genotyping shows the genetic identity of the index patients’ cells and the RPCI-WM1 cell line.
Genomic DNA from the index patient tumor cells and the cell line were subjected to SNP genotyping that was done by the MassARRAY compact system and software (SEQUINOM) using 22 predetermined human SNPs. A 100% match rate was observed between the cell line and the parental tumor cells.
| SNP PROBE | PATIENT | RPCI-WM1 |
|---|---|---|
| rs10380 | CT | CT |
| rs1042602 | CA | CA |
| rs1051266 | G | G |
| rs1143693 | G | G |
| rs1421085 | C | C |
| rs146026 | TC | TC |
| rs16383 | DEL | DEL |
| rs1801198 | C | C |
| rs1801394 | A | A |
| rs1950902 | CT | CT |
| rs202676 | T | T |
| rs223830 | T | T |
| rs2274976 | G | G |
| rs285 | CT | CT |
| rs3176921 | T | T |
| rs3733890 | GA | GA |
| rs3751812 | T | T |
| rs4884 | CT | CT |
| rs6003 | A | A |
| rs722098 | A | A |
| rs723632 | G | G |
| rs736394 | CT | CT |
| Matched | 22 |
Figure 3. Molecular analysis demonstrates the clonal evolution of the RPCI-WM1 cell line from the index patient.


A. PCR amplification of genomic DNA using FR1c/JHc primers is shown.
Electrophoresis of the product was performed using ABI 3130xl genetic analyzer and the analysis was done using Gene Mapper version 4.0 software. The X-axis represents the length of DNA fragment and both the cell line (top panel) and the index patient (lower panel) show similar size product at 347.4 demonstrating the clonal evolution of the cell line from the index patient. B. Sequence alignment and matched with IgVH6.1 when compared with the germline configurations using IMGT/V-QUEST software version 3.2.24.
Mutational analysis of MYD88
Recently, Treon et al identified a sequence variant for MYD88 in WM patients as well as in two of the established cell lines, BCWM.1 and MWCL-1 cells and proposed this variant distinguishes WM disease from IgM MGUS or MM [7]. To evaluate if RPCI-WM1 harbors a similar variant for MYD88, we sequenced the genomic DNA of the index patient as well as RPCI-WM1 cells. There is a heterozygous mutation in both the index patient as well as the cell line similar to that reported (Figure 4). This observation further validates that RPCI-WM1 is representative of WM.
Figure 4. RPCI-WM1 cells harbor a non-synonymous and heterozygous variant of MYD88.
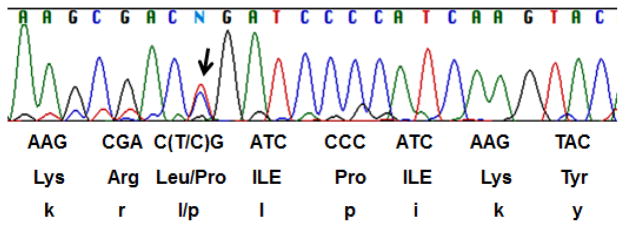
Genomic DNA from both the index patient tumor cells and RPCI-WM1 cells using primers for MYD88 and the product was purified and sequenced. Both the samples showed a heterozygous mutation and the region of chromatogram with the mutation (T to C; indicated as N) from the cell line is shown.
Immunophenotypic analysis
Immunophenotypic characterization of both index patient cells and RPCI-WM1 was performed to evaluate the distribution of cell surface molecules. The cell line expressed most of the cell surface molecules typically present on WM cells and the pattern was similar to that found on the parental patient WM cells. Both expressed surface molecules such as CD38, CD40, CD45RA CD70, CD80, IgM (Figure 4), and did not express CD2, CD3, CD4, CD5, CD7, ?CD8, CD11c, CD13, CD10, CD14, CD16, CD23, CD30, CD34, CD66b, CD117 and CD138 (data not shown). The cell line differed from the index patient cells by an expressional loss of CD19, CD20, CD24, CD52 and CD79b.
DISCUSSION
We report the establishment and characterization of a novel human WM cell line, RPCI-WM1, generated from a patient with advanced stage relapsed/refractory WM. Lymph nodes were used to develop subcutaneous tumors in mice from which the cell line was established. The cell line was tested for its genetic and chromosomal stability over several passages by DNA fingerprinting and spectral karyotyping (SKY) analyses and found to have attained stability in vitro. RPCI-WM1 cells showed a doubling time of 34h in culture. Secretion of a monoclonal IgM protein is a defining hallmark of WM, and approximately 80% of cases are κ light chain restricted [2,26]. Both the index patient and the derived RPCI-WM1 cell line secrete κ light chain restricted IgM monoclonal protein. Additional analysis such as IgM serum detection and quantification, IgH CDR length, IgH sequence analyses and DNA fingerprinting were conducted to confirm the clonal relationship between the cell line and the founding tumor.
The chromosomal architecture of RPCI-WM1 was compared with that of the founding tumor using aCGH analysis. Both samples show identical chromosomal deletions in 6q21, 9p21, and 13q14, thus providing further evidence of a molecular resemblance. Both the index patient and RPCI-WM1 cells share other chromosomal anomalies, such as deletions of 9p21 (encodes for p16INK4) and 13q14 loci (encodes for the RB protein). These proteins are key cell cycle regulatory elements and their disruption leads to uncontrolled cell proliferation. Both also have been implicated in WM and other hematologic malignancies [27,28]. Interestingly, aCGH surveys of RPCI-WM1 reveal an amplification of chromosomal material at the 14q32 region and a loss of material in the 18q21-22 locations, which are not detected on the aCGH analysis of the index tumor. However, analysis with FISH probes specific for genes present in the 14q32 (IgH gene) and 18q21-22 (BCL-2 gene) regions show the respective genes are found to be upregulated (IgH gene) and also downregulated (BCL-2) in the index tumor cells, albeit less frequently. Furthermore, aCGH analysis of the cell line shows amplification of chromosome 11q14.1-q22.3, and was validated by FISH analysis using a probe for ATM gene that is located at 11q22.3 (Data not shown).
Deletion of chromosome 6q21-22 was proposed to be a secondary event in the progression of WM and is found in approximately 50% of WM patients. Its presence is used to distinguish WM from MGUS [25]. This region harbors important genes such as PRDM1, a master regulator of B-cell differentiation; the loss of which has been implicated in the pathogenesis of diffuse large B-cell lymphoma [29]. This region also harbors AIM1, a tumor suppressor that is lost in malignant melanoma [30] and in natural killer cell malignancies [31]. Both the cell line and the patient tumor cells were also found to harbor a heterozygous variant of MYD88 that codes for a non-synonymous change in single amino acid L265P in this protein. L265P mutation was shown to be a gain-of-function driver mutation that enhances the pro-oncogenic functions of MYD88 in tumor cells [8].
The RPCI-WM1 cell line is immunophenotypically and cytogenetically similar to the WM cells of the index patient from which they were derived. The two differ in that the cell line is negative for CD19, CD20, CD24, CD25, CD52 and CD79b while the parent tumor cells are positive for these markers. In particular, more than 80% of the founding tumor cells are positive for CD19 and CD20 markers. Although the reason for the loss of CD19 and CD20 in RPCI-WM1 is not currently known, it is possible that the RPCI-WM1 is derived from a CD19 and CD20 double negative tumor clone existing in the patient (and represented approximately 20% of the cells implanted in the mice). In this context, it is noteworthy to mention a recent observation by Barakat et al [18] that monotypic plasma cells persist even after therapy in WM patients. The immunophenotypic characterization of the persisting clone suggests that the therapy-resistant plasma cell can be double negative for both CD19 and CD20. Thus it is possible that RPCI-WM1 is a unique clonal consequence of aggressive therapy that retained all the features of a WM tumor except for the two important cell surface markers. We are also pursuing our investigation to evaluate if the loss of these two markers is a phenomenon happened during establishment of the cell line.
Finally, as the origin of immortalization is a concern in the development of cell lines [32], RPCI-WM1 was inspected for expression of EBV-LMP1 and was negative. This observation demonstrates that an inherent capability, not a virus-mediated transformation, is responsible for the sustained proliferative potential of RPCI-WM1 cells in-vitro as well as in mice. In conclusion, RPCI-WM1, as a pre-clinical model of WM, is a molecularly validated cell line that will prove useful for understanding disease etiology and in developing targeted therapies in the battle against this poorly understood malignancy.
Figure 5. Immunophenotypic characterization of the index patient tumor cells and the RPCI-WM1 cell line.
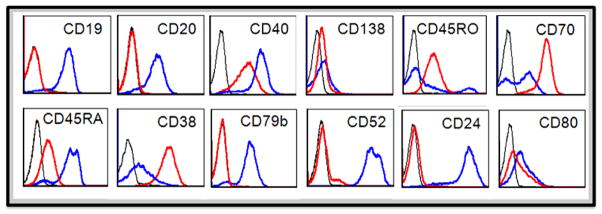
Fluorescein (FITC), phycoerythrin (PE), phycoerythrin-cyanine5 (PC5), peridinin chlorophyll-a protein cy5.5 (PCPCY5.5), PE (BC) or allophycocyanin (APC) conjugates of various antibodies were used. Expression of the markers is compared between the patient sample (blue) and RPCI-WM1 cell line (red). Isotype controls (black) for respective antibodies were also shown.
Acknowledgments
We are very grateful to the patient and her family for graciously donating her tumor tissue. This work is partly supported by the Waterfall Waldenström Macroglobulinemia Research Fund (ACK), the Leukemia and Lymphoma Society (ACK is a Leukemia and Lymphoma Society Scholar in Clinical Research), R01 CA121044-01 and R01 CA097243 (KL and JN). This research was also supported, in part, by the NCI Cancer Center Support Grant to the Roswell Park Cancer Institute [P30 CA016056] (NJN). Additional support was provided in part by the Roswell Park Alliance Foundation, “Rapid Tissue Acquisition Program” and the Roswell Park Cancer Institute Shared Resource, “Mouse Tumor Model Resource (MTMR)” [BAF]. We are grateful to Ms. Kiersten Marie Miles for her contribution to this project.
Footnotes
- Kasyapa S. Chitta – design of experiments and writing of the manuscript.
- Aneel Paulus – data analysis, writing and review of the manuscript.
- Sikander Ailawadhi – patient contribution and manuscript review.
- Barbara A. Foster – conduct of animal model experiments.
- Michael T. Moser – conduct of animal model experiments.
- Aisha Masood – data analysis and writing of the manuscript.
- Taimur Sher – writing and review of the manuscript.
- Kena C. Miller – patient contribution.
- Dan M. Iancu – conduct and analysis of light chain detection assay.
- Jeffrey Conroy – conduct of SNP analysis, aCGH analysis and writing of the manuscript
- Norma J. Nowak – conduct of CGH analysis experiments and writing the manuscript.
- Sheila N. Sait - conduct of cytogenetic analysis and writing of the manuscript.
- Petr Starostik – conduct of molecular analyses and writing the manuscript.
- Morton Coleman – data analysis and writing the manuscript.
- Richard Furman – data analysis and writing of the manuscript.
- Peter Martin-date analysis and writing the manuscript
- Kelvin Lee – design of experiments, data analysis and writing of the manuscript.
- Asher A. Chanan-Khan – overall planning, design and conduct of the project, data analysis, manuscript writing and final approval of the manuscript.
Declaration of Interests: See ICMJE Forms for Disclosure of Potential Conflicts of Interest
References
- 1.Vijay A, Gertz MA. Waldenstrom macroglobulinemia. Blood. 2007;109:5096–103. doi: 10.1182/blood-2006-11-055012. [DOI] [PubMed] [Google Scholar]
- 2.Stone MJ, Pascual V. Pathophysiology of Waldenstrom’s macroglobulinemia. Haematologica. 2010;95:359–64. doi: 10.3324/haematol.2009.017251. [DOI] [PMC free article] [PubMed] [Google Scholar]
- 3.Owen RG, Treon SP, Al-Katib A, Fonseca R, Greipp PR, McMaster ML, Morra E, Pangalis GA, San Miguel JF, Branagan AR, et al. Clinicopathological definition of Waldenstrom’s macroglobulinemia: consensus panel recommendations from the Second International Workshop on Waldenstrom’s Macroglobulinemia. Seminars in oncology. 2003;30:110–5. doi: 10.1053/sonc.2003.50082. [DOI] [PubMed] [Google Scholar]
- 4.Walsh SH, Laurell A, Sundstrom G, Roos G, Sundstrom C, Rosenquist R. Lymphoplasmacytic lymphoma/Waldenstrom’s macroglobulinemia derives from an extensively hypermutated B cell that lacks ongoing somatic hypermutation. Leuk Res. 2005;29:729–34. doi: 10.1016/j.leukres.2004.12.008. [DOI] [PubMed] [Google Scholar]
- 5.Dimopoulos MA, Kyle RA, Anagnostopoulos A, Treon SP. Diagnosis and management of Waldenstrom’s macroglobulinemia. J Clin Oncol. 2005;23:1564–77. doi: 10.1200/JCO.2005.03.144. [DOI] [PubMed] [Google Scholar]
- 6.Kriangkum J, Taylor BJ, Treon SP, Mant MJ, Reiman T, Belch AR, Pilarski LM. Molecular characterization of Waldenstrom’s macroglobulinemia reveals frequent occurrence of two B-cell clones having distinct IgH VDJ sequences. Clinical cancer research : an official journal of the American Association for Cancer Research. 2007;13:2005–13. doi: 10.1158/1078-0432.CCR-06-2788. [DOI] [PubMed] [Google Scholar]
- 7.Xu L, Sohani A, Arcaini L, Hunter Z, Yang G, Zhou Y, Liu X, Cao Y, Manning RJ, Patterson CJ, et al. A Somatic Variant in MYD88 (L265P) Revealed by Whole Genome Sequencing Differentiates Lymphoplasmacytic Lymphoma From Marginal Zone Lymphomas. 53rd Annual Meeting and Exposition of the American Society of Hematology; San Diego, California: San Diego Convention Center; 2011. [Google Scholar]
- 8.Ngo VN, Young RM, Schmitz R, Jhavar S, Xiao W, Lim KH, Kohlhammer H, Xu W, Yang Y, Zhao H, et al. Oncogenically active MYD88 mutations in human lymphoma. Nature. 2011;470:115–9. doi: 10.1038/nature09671. [DOI] [PMC free article] [PubMed] [Google Scholar]
- 9.Dhodapkar MV, Jacobson JL, Gertz MA, Crowley JJ, Barlogie B. Prognostic factors and response to fludarabine therapy in Waldenstrom’s macroglobulinemia: an update of a US intergroup trial (SW0G S9003) Semin Oncol. 2003;30:220–5. doi: 10.1053/sonc.2003.50050. [DOI] [PubMed] [Google Scholar]
- 10.Treon SP, Hunter Z, Barnagan AR. CHOP plus rituximab therapy in Waldenstrom’s macroglobulinemia. Clin Lymphoma. 2005;5:273–7. doi: 10.3816/clm.2005.n.015. [DOI] [PubMed] [Google Scholar]
- 11.Ioakimidis L, Patterson CJ, Hunter ZR, Soumerai JD, Manning RJ, Turnbull B, Sheehy P, Treon SP. Comparative outcomes following CP-R, CVP-R, and CHOP-R in Waldenstrom’s macroglobulinemia. Clin Lymphoma Myeloma. 2009;9:62–6. doi: 10.3816/CLM.2009.n.016. [DOI] [PubMed] [Google Scholar]
- 12.Treon SP. How I treat Waldenstrom macroglobulinemia. Blood. 2009;114:2375–85. doi: 10.1182/blood-2009-05-174359. [DOI] [PubMed] [Google Scholar]
- 13.Treon SP, Branagan AR, Ioakimidis L, Soumerai JD, Patterson CJ, Turnbull B, Wasi P, Emmanouilides C, Frankel SR, Lister A, et al. Long-term outcomes to fludarabine and rituximab in Waldenstrom macroglobulinemia. Blood. 2009;113:3673–8. doi: 10.1182/blood-2008-09-177329. [DOI] [PMC free article] [PubMed] [Google Scholar]
- 14.Gertz MA, Rue M, Blood E, Kaminer LS, Vesole DH, Greipp PR. Multicenter phase 2 trial of rituximab for Waldenstrom macroglobulinemia (WM): an Eastern Cooperative Oncology Group Study (E3A98) Leuk Lymphoma. 2004;45:2047–55. doi: 10.1080/10428190410001714043. [DOI] [PubMed] [Google Scholar]
- 15.Treon SP, Ioakimidis L, Soumerai JD, Patterson CJ, Sheehy P, Nelson M, Willen M, Matous J, Mattern J, 2nd, Diener JG, et al. Primary therapy of Waldenstrom macroglobulinemia with bortezomib, dexamethasone, and rituximab: WMCTG clinical trial 05-180. J Clin Oncol. 2009;27:3830–5. doi: 10.1200/JCO.2008.20.4677. [DOI] [PMC free article] [PubMed] [Google Scholar]
- 16.Dimopoulos MA, Gertz MA, Kastritis E, Garcia-Sanz R, Kimby EK, Leblond V, Fermand JP, Merlini G, Morel P, Morra E, et al. Update on treatment recommendations from the Fourth International Workshop on Waldenstrom’s Macroglobulinemia. J Clin Oncol. 2009;27:120–6. doi: 10.1200/JCO.2008.17.7865. [DOI] [PubMed] [Google Scholar]
- 17.Varghese AM, Rawstron AC, Ashcroft AJ, Moreton P, Owen RG. Assessment of bone marrow response in Waldenstrom’s macroglobulinemia. Clinical lymphoma & myeloma. 2009;9:53–5. doi: 10.3816/CLM.2009.n.013. [DOI] [PubMed] [Google Scholar]
- 18.Barakat FH, Medeiros LJ, Wei EX, Konoplev S, Lin P, Jorgensen JL. Residual monotypic plasma cells in patients with waldenstrom macroglobulinemia after therapy. American journal of clinical pathology. 2011;135:365–73. doi: 10.1309/AJCP15YFULCZHZVH. [DOI] [PubMed] [Google Scholar]
- 19.Drexler HG. Guide to Leukemia-Lymphoma Cell Lines. Braunschweig; 2010. [Google Scholar]
- 20.Muirhead KA, Wallace PK, Schmitt TC, Frescatore RL, Franco JA, Horan PK. Methodological considerations for implementation of lymphocyte subset analysis in a clinical reference laboratory. Ann N Y Acad Sci. 1986;468:113–27. doi: 10.1111/j.1749-6632.1986.tb42034.x. [DOI] [PubMed] [Google Scholar]
- 21.Matsui S, Faitar SL, Rossi MR, Cowell JK. Application of spectral karyotyping to the analysis of the human chromosome complement of interspecies somatic cell hybrids. Cancer Genet Cytogenet. 2003;142:30–5. doi: 10.1016/s0165-4608(02)00730-6. [DOI] [PubMed] [Google Scholar]
- 22.Ried T, Koehler M, Padilla-Nash H, Schroek E. Chromosome analysis by spectral karyotyping. In: Spector DL, Goldman RD, Leinwand LA, editors. Cells: a Laboratory Manual. New York: CSHL Press; 1997. [Google Scholar]
- 23.Tang K, Fu DJ, Julien D, Braun A, Cantor CR, Koster H. Chip-based genotyping by mass spectrometry. Proc Natl Acad Sci U S A. 1999;96:10016–20. doi: 10.1073/pnas.96.18.10016. [DOI] [PMC free article] [PubMed] [Google Scholar]
- 24.UCSC. UCSC Genome Bioinformatics Site [Internet] 2012 2012 04/18/2012] Available from: http://genome.ucsc.edu/index.html.
- 25.Schop RF, Van Wier SA, Xu R, Ghobrial I, Ahmann GJ, Greipp PR, Kyle RA, Dispenzieri A, Lacy MQ, Rajkumar SV, et al. 6q deletion discriminates Waldenstrom macroglobulinemia from IgM monoclonal gammopathy of undetermined significance. Cancer Genet Cytogenet. 2006;169:150–3. doi: 10.1016/j.cancergencyto.2006.04.009. [DOI] [PubMed] [Google Scholar]
- 26.Berger F, Isaacson PG, Piris MA, et al. Lymphoplasmacytic lymphoma/Waldenström macroglobulinemia. In: Jaffe ES, Harris NL, Stein H, et al., editors. Pathology and Genetics of Tumours of Haematopoietic and Lymphoid Tissues. Lyon: IARC Press; 2001. pp. 132–4. [Google Scholar]
- 27.Quesnel B, Preudhomme C, Fenaux P. p16ink4a gene and hematological malignancies. Leuk Lymphoma. 1996;22:11–24. doi: 10.3109/10428199609051724. [DOI] [PubMed] [Google Scholar]
- 28.Bergh G, Ehinger M, Olofsson T, Baldetorp B, Johnsson E, Brycke H, Lindgren G, Olsson I, Gullberg U. Altered expression of the retinoblastoma tumor-suppressor gene in leukemic cell lines inhibits induction of differentiation but not G1-accumulation. Blood. 1997;89:2938–50. [PubMed] [Google Scholar]
- 29.Tam W, Gomez M, Chadburn A, Lee JW, Chan WC, Knowles DM. Mutational analysis of PRDM1 indicates a tumor-suppressor role in diffuse large B-cell lymphomas. Blood. 2006;107:4090–100. doi: 10.1182/blood-2005-09-3778. [DOI] [PubMed] [Google Scholar]
- 30.Ray ME, Wistow G, Su YA, Meltzer PS, Trent JM. AIM1, a novel non-lens member of the betagamma-crystallin superfamily, is associated with the control of tumorigenicity in human malignant melanoma. Proc Natl Acad Sci U S A. 1997;94:3229–34. doi: 10.1073/pnas.94.7.3229. [DOI] [PMC free article] [PubMed] [Google Scholar]
- 31.Iqbal J, Kucuk C, Deleeuw RJ, Srivastava G, Tam W, Geng H, Klinkebiel D, Christman JK, Patel K, Cao K, et al. Genomic analyses reveal global functional alterations that promote tumor growth and novel tumor suppressor genes in natural killer-cell malignancies. Leukemia. 2009;23:1139–51. doi: 10.1038/leu.2009.3. [DOI] [PubMed] [Google Scholar]
- 32.Drexler HG, MacLeod RA. Malignant hematopoietic cell lines: in vitro models for the study of Waldenstrom’s macroglobulinemia. Leuk Res. 2008;32:1669–73. doi: 10.1016/j.leukres.2008.04.016. [DOI] [PubMed] [Google Scholar]