

Abstract
Mutant isocitrate dehydrogenase (IDH) 1 and 2 proteins alter the epigenetic landscape in acute myeloid leukemia (AML) cells through production of the oncometabolite (R)-2-hydroxyglutarate (2-HG). Here we performed a large-scale RNA interference (RNAi) screen to identify genes that are synthetic lethal to the IDH1R132H mutation in AML and identified the anti-apoptotic gene BCL-2. IDH1- and IDH2-mutant primary human AML cells were more sensitive than IDH1/2 wild-type cells to ABT-199, a highly specific BCL-2 inhibitor that is currently in clinical trials for hematologic malignancies, both ex vivo and in xenotransplant models. This sensitization effect was induced by (R)-2-HG–mediated inhibition of the activity of cytochrome c oxidase (COX) in the mitochondrial electron transport chain (ETC); suppression of COX activity lowered the mitochondrial threshold to trigger apoptosis upon BCL-2 inhibition. Our findings indicate that IDH1/2 mutation status may identify patients that are likely to respond to pharmacologic BCL-2 inhibition and form the rational basis for combining agents that disrupt ETC activity with ABT-199 in future clinical studies.
IDH1 and IDH2 are enzymes in the citric acid cycle that catalyze the oxidative decarboxylation of isocitrate, producing α-ketoglutarate (α-KG) and NADPH in the process1. In 2009, a mutation in the IDH1 gene was identified by whole-genome sequencing of an AML sample2. Several studies confirmed that this mutation is recurrent and occurs not only in the cytosolic IDH1 enzyme but also in IDH2, its mitochondrial homolog3–5. Approximately 15% of AML patients have mutations in either IDH1 or IDH2 (ref. 6).
The mutant enzymes gain a neomorphic activity that catalyzes the conversion of α-KG to (R)-2-HG7, resulting in an intracellular concentration of (R)-2-HG that is over 100-fold higher in IDH1/2 mutant cells than in wild-type cells4,8. (R)-2-HG is a competitive inhibitor of multiple α-KG–dependent dioxygenases, including TET2 and the Jumonji C domain–containing histone demethylases9. As inhibition of these enzymes can lead to epigenetic dysregulation10,11, IDH1 and IDH2 mutant proteins may promote cellular transformation through epigenetic alterations.
Mutations in IDH1/2 are acquired early in the progression from normal hematopoietic stem/progenitor cells (HSPCs) to frank leukemia12–15, and studies of paired diagnosis and relapse samples demonstrated that IDH1/2 mutations are stable during disease evolution16,17, indicating that a population of IDH1/2 mutant cells survive initial chemotherapy and contribute to relapse. These findings provide a strong rationale for therapeutic targeting of mutated IDH proteins.
One approach is to specifically block the neomorphic activity of the mutant enzyme without affecting the activity of wild-type IDH. Small-molecule inhibitors specific for mutant IDH enzymes have recently been developed and are in early-phase clinical trials18,19. Here we use an alternative approach to target mutant cells. Often referred to as synthetic lethality, this strategy is based on the concept of non-oncogene addiction, wherein cells expressing a particular oncogenic mutation exhibit heightened dependence on a subset of non-oncogenes for survival20.
To identify non-oncogenes that are synthetic lethal to the R132H mutation in IDH1, we performed a pooled lentiviral RNAi screen in the THP-1 AML cell line engineered to express either wild-type IDH1 or mutant IDH1R132H along with a GFP marker under the control of a doxycycline-inducible promoter (Supplementary Fig. 1a–c). IDH1R132H expression was confirmed by intracellular flow cytometry using a monoclonal antibody specific for the mutant protein (Supplementary Fig. 1d). The stoichiometric ratio of mutant to endogenous wild-type IDH1 was estimated to be ~0.8:1 after 3 d of doxycycline induction (data not shown). Mutant IDH1 expression resulted in an ~150-fold increase in intracellular 2-HG concentration as compared with an ~2-fold increase after wild-type IDH1 expression (Supplementary Fig. 1e). This degree of 2-HG accumulation is similar to that measured in primary AML and glioma samples harboring IDH1 or IDH2 mutations4,8.
We next transduced the cell lines with a lentiviral shRNA library obtained through the DECIPHER Open Source RNAi Screening Project (http://www.decipherproject.net/). The library targeted 5,043 human genes with 27,500 unique shRNAs (five or six redundant shRNA constructs per gene). The genes were selected from curated pathway databases (for example, KEGG and Reactome), the CSHL Cancer 1000 list, the Cancer Genome Atlas and known US Food and Drug Administration–approved drug targets. Each shRNA construct was tagged with a unique barcode sequence, which allowed for downstream identification by DNA sequencing. Following transduction, the cells were cultured in doxycycline for 12 d to deplete shRNAs that targeted genes synthetic lethal to mutant IDH1R132H. The relative abundance of each shRNA construct was subsequently determined by high-throughput sequencing of the barcode sequences. Among the top synthetic lethal gene hits were two anti-apoptotic BCL-2 family member genes, BCL2L2 (also known as BCL-W) and BCL-2 (Fig. 1a and Supplementary Table 1). These findings led us to hypothesize that mutant IDH1 increases AML cell dependency on BCL-W and BCL-2 for survival. We focused our subsequent studies on BCL-2 because an orally bioavailable BH3 mimetic, ABT-199, which is a highly specific BCL-2 inhibitor, had recently been developed21.
Figure 1.
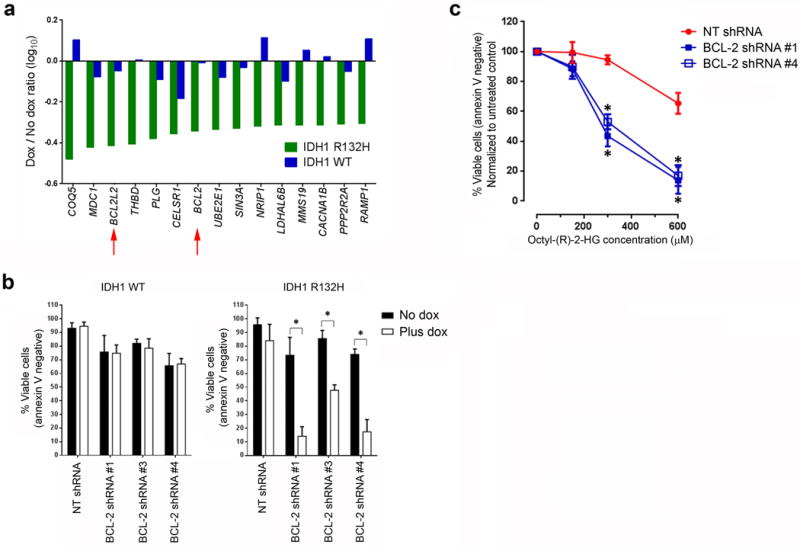
Identification of BCL-2 as synthetic lethal to mutant IDH1. (a) The 15 synthetic lethal gene hits. The log10 of the drop-out ratio (number of barcode reads in the presence of dox to the number of reads in the absence of dox) in mutant IDH1R132H-expressing cells (green bars) or in wild-type IDH1-expressing cells (blue bars) is shown. The red arrows highlight two antiapoptotic members of the BCL-2 family. (b) Viability of the engineered THP-1 cell lines transduced with lentiviral vectors encoding the indicated shRNAs and induced to express either wild-type or mutant IDH1R132H for seven days. The means of three biological replicates are shown. (c) Viability of parental THP-1 cells transduced with lentiviral vectors encoding the indicated shRNAs and treated with the indicated concentrations of octyl-(R)-2-HG for two days. The means of three biological replicates are shown. NT, non-targeting. *P < 0.05. Statistical significance (P) was determined by Student’s t-test. All error bars represent sd.
To confirm that BCL-2 knockdown is synthetic lethal to the R132H mutation in IDH1, we transduced the cell lines with three BCL-2 shRNA lentiviral constructs different from those in the library. Induction of IDH1R132H but not wild-type IDH1 expression resulted in a significant decrease in cell viability after BCL-2 knockdown (Fig. 1b). The degree of BCL-2 knockdown correlated with the extent of apoptosis, consistent with an on-target effect (Supplementary Fig. 2). To determine whether the higher intracellular (R)-2-HG concentrations caused by mutant IDH1 activity were sufficient to sensitize cells to BCL-2 knockdown, we exposed parental THP-1 cells transduced with two BCL-2 shRNA lentiviral constructs to increasing concentrations of a cell-permeable precursor of (R)-2-HG, octyl-(R)-2-HG. The intracellular (R)-2-HG concentrations were increased by ~120-fold after exposure to 300 μM octyl-(R)-2-HG for 48 h (data not shown). Treatment with octyl-(R)-2-HG at concentrations previously shown to inhibit intracellular α-KG–dependent dioxygenases9 and block differentiation11 sensitized cells to BCL-2 knockdown in a dose-dependent manner (Fig. 1c).
To determine whether pharmacologic inhibition of BCL-2 with ABT-199 recapitulates the synthetic lethal phenotype, we determined the ABT-199 half-maximum inhibitory concentration (IC50) for the cell lines in the presence or absence of doxycycline. Induction of IDH1R132H but not wild-type IDH1 decreased the ABT-199 IC50 from 807 nM to 60 nM (Fig. 2a). Transduction of THP-1 cells with lentiviral vectors encoding mutant IDH2R140Q or IDH2R172K similarly increased sensitivity to ABT-199 (Supplementary Fig. 3a). Treatment with octyl-(R)-2-HG also decreased the ABT-199 IC50 (Fig. 2b). To confirm that this effect is not restricted to THP-1 cells, we determined the effect of octyl-(R)-2-HG on ABT-199 sensitivity in seven additional AML cell lines, including lines that were previously found to be resistant to the drug22; we observed an increase in sensitivity to varying degrees in all seven lines with octyl-(R)-2-HG treatment (Supplementary Fig. 3b). Octyl-(R)-2-HG treatment also sensitized IDH1/2 wild-type primary AML blasts (Fig. 2c) and cord blood CD34+ HSPCs (Supplementary Fig. 3c) to ABT-199. Notably, octyl-(R)-2-HG treatment did not sensitize THP-1 or KG-1 cells to doxorubicin or cytarabine (Supplementary Fig. 3d), indicating that the effects of (R)-2-HG are not simply due to a nonspecific priming to cytotoxic agents but rather to a specific induction of BCL-2 dependence. Treatment of the engineered THP-1 cells with AGI-5198, a specific IDH1R132H inhibitor19, partially rescued mutant IDH1 expressing cells from ABT-199–induced apoptosis (Fig. 2d), providing further evidence that the neomorphic activity of mutant IDH1 is necessary for the synthetic lethal phenotype.
Figure 2.
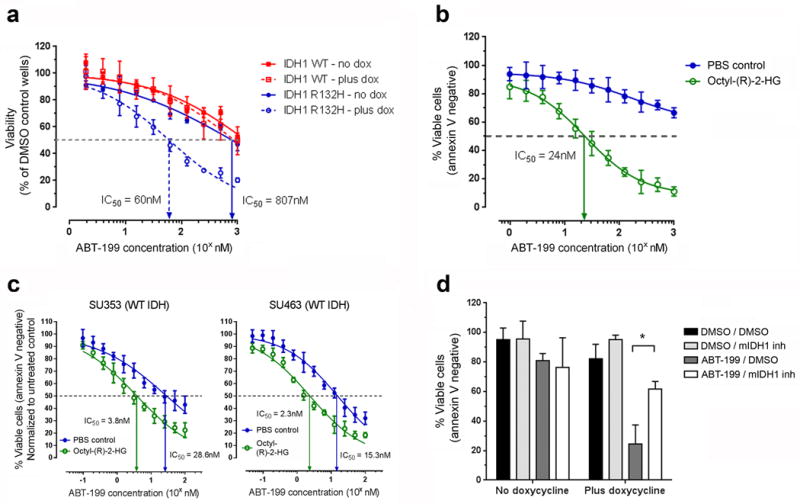
(R)-2-HG sensitizes AML cells to pharmacologic BCL-2 inhibition. (a) Viability of the engineered THP-1 cell lines cultured in the absence or presence of doxycycline (dox) and treated with serial dilutions of ABT-199 for 5 days. (b) Viability of parental THP-1 cells treated with serial dilutions of ABT-199 in the presence of 300 μM of octyl-(R)-2-HG or PBS (vehicle control) for two days. (c) Viability of FACS-sorted blasts from the indicated primary AML samples treated with serial dilutions of ABT-199 in the presence of octyl-(R)-2-HG (250 μM for SU353 and 500 μM for SU463) or PBS (vehicle control) for 24 hours. (d) Viability of the engineered mutant IDH1R132H–expressing THP-1 cell line treated with DMSO, ABT-199 (200 nM) and/or the mutant IDH1 inhibitor (mIDH1 inh; AGI-5198 at 10 μM) for five days either in the absence or presence of doxycycline. The data shown in this figure are the means of three biological replicates. *P < 0.05. Statistical significance (P) was determined by Student’s t-test. All error bars represent sd.
Next, we investigated the impact of IDH1/2 mutations on primary human AML blast sensitivity to ABT-199. We first purified the blast population from 33 primary human AML peripheral blood or bone marrow samples of known IDH1/2 mutation status to over 99% purity using fluorescence-activated cell sorting (FACS; Supplementary Fig. 4). The clinical characteristics, cytogenetics and mutation status of IDH1/2, FLT3 and NPM1 for each sample are shown in Supplementary Table 2. We cultured the purified blast population for 24 h in an ex vivo system that maintained an average viability of ~70% in vehicle-treated control cultures (data not shown). The ABT-199 IC50 of these samples varied over 3 logs, consistent with previously published results (Fig. 3a)22. Blasts harboring IDH1 or IDH2 mutations were significantly more sensitive than blasts with wild-type IDH1/2 (IC50 = 1.58 ± 0.76 nM for mutant IDH1, 6.68 ± 2.5 nM for mutant IDH2 versus 37.8 ± 14 nM for wild-type (mean ± sem); P < 0.05 for both comparisons). Healthy cord blood CD34+ HSPCs were highly resistant to ABT-199 treatment ex vivo (IC50 = 221 ± 30.97 nM), suggesting a wide in vivo therapeutic index; this is supported by the lack of major hematopoietic toxicity in patients treated with ABT-199 in early-phase clinical trials21,23.
Figure 3.
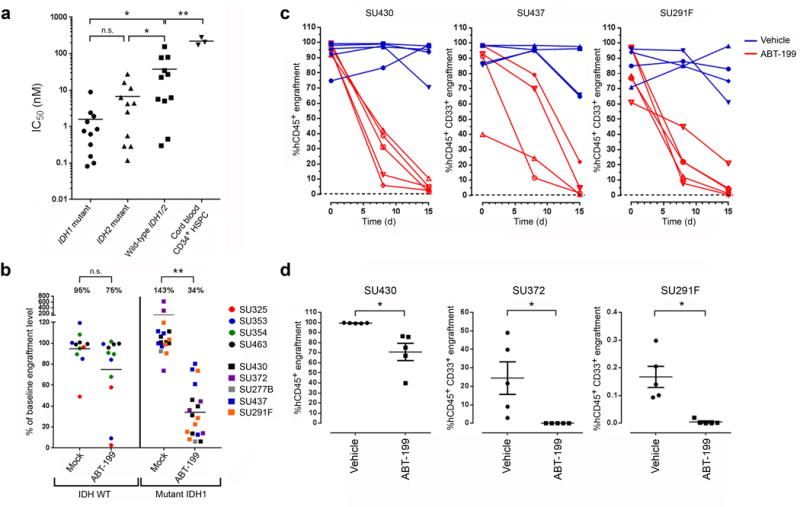
ABT-199 targets IDH1/2 mutant primary human AML cells. (a) ABT-199 IC50 values of FACS-purified AML blasts (n = 11 for each group) and CD34+ enriched cord blood HSPCs (n = 3). (b) Change in AML bone marrow (BM) engraftment level relative to baseline in NSG mice transplanted with the indicated primary human AML samples and treated with either vehicle (mock) or ABT-199 daily for seven consecutive days. Each data point represents an individual mouse (n = 11 for the mock-treated WT IDH1/2 group; n = 12 for the ABT-199–treated WT IDH1/2 group; n = 17 for the mock-treated mutant IDH1 group; n = 18 for the ABT-199 treated mutant IDH1 group). (c) AML BM engraftment levels in NSG mice transplanted with the indicated primary samples and treated with vehicle or ABT-199 daily for 14 consecutive days (days 1–14). Each line represents serial measurements from an individual mouse. (d) AML BM engraftment levels in secondary NSG recipients 7 weeks after transplantation with BM cells obtained from primary NSG recipients that were engrafted with the indicated IDH1 mutant samples and treated with vehicle or ABT-199 for 7 consecutive days (SU372), 14 consecutive days (SU291F), or 21 consecutive days (SU430). Each data point represents an individual mouse. All horizontal lines represent the mean. All error bars represent sem. NS, not significant. *P ≤ 0.05, ** P < 0.001. Statistical significance (P) was determined by Student’s t-test.
To investigate the activity of ABT-199 against AML in vivo, we transplanted wild-type IDH1/2 or mutant IDH1 primary human AML cells into sublethally irradiated adult NOD/SCID/Il2rg−/− (NSG) mice and determined the baseline level of human leukemic engraftment in the bone marrow by femoral aspiration at 9 to 22 weeks after transplant. Bone marrow chimerism exceeded 80% in most cases, indicating a large burden of disease, similar to the clinical situation (Supplementary Table 3). Engrafted mice were then treated with either ABT-199 at a dose of 100 mg/kg/d or vehicle control for seven consecutive days by oral administration. This dose was chosen on the basis of previously published studies using this compound in mice21,22. A post-treatment engraftment analysis was performed in the opposite femur 24 h after the last dose. The engraftment of IDH1 mutant samples significantly decreased after ABT-199 treatment compared with vehicle control treatment (Fig. 3b and Supplementary Table 3). ABT-199 treatment did not significantly reduce the engraftment of wild-type IDH1/2 samples (Fig. 3b and Supplementary Table 3), demonstrating that IDH1 mutant AML cells are more sensitive to ABT-199 in vivo. In three of the IDH1 mutant samples, we extended the duration of treatment to 14 consecutive days and observed further reductions in engraftment (Fig. 3c). ABT-199 treatment did not cause any mortality during the treatment period and resulted in only small decreases in weight and hemoglobin level compared with vehicle treatment (Supplementary Fig. 5). Platelet counts were not significantly affected by ABT-199 treatment (P > 0.05; Supplementary Fig. 5).
Leukemic stem cells (LSCs) can self-renew and transplant disease in xenotransplant recipients24. This subpopulation is resistant to chemotherapy and contributes to disease relapse25,26. To determine whether ABT-199 treatment affected the survival of LSCs in the xenotransplants, we collected bone marrow cells from ABT-199–treated or vehicle-treated mice engrafted with IDH1 mutant samples and transplanted them into secondary sublethally irradiated NSG recipients. Bone marrow cells from ABT-199–treated animals either failed to engraft (subjects SU372 and SU291F) or engrafted at significantly lower levels (SU430) in secondary recipients compared with the engraftment levels of vehicle-treated cells (Fig. 3d). This finding suggests that ABT-199 treatment targets not only IDH1 mutant human AML blasts but also LSCs in vivo. These findings are potentially clinically relevant as ABT-199 treatment resulted in improved survival in some of the primary and secondary xenotransplant recipients (Supplementary Fig. 6a,b). It is worth noting that subject SU430 had a highly aggressive disease that was primary refractory to five different regimens of induction chemotherapy.
The multidomain proapoptotic BCL-2 family members, BAX and BAK, initiate apoptosis by causing mitochondrial outer membrane permeabilization (MOMP) following an activating conformational change27. This results in the release of cytochrome c from the mitochondria into the cytosol and collapse of the mitochondrial transmembrane potential (ΔΨmito). BH3 mimetics such as ABT-199 can trigger this process by disrupting the binding between the BH3 domain of proapoptotic proteins and the hydrophobic cleft of antiapoptotic proteins such as BCL-2 (refs. 21, 27). To confirm that this process occurs in mutant cells treated with ABT-199, we measured the release of cytochrome c into the cytosol and the collapse of ΔΨmito as surrogate markers of MOMP. ABT-199 treatment resulted in greater cytochrome c release in THP-1 cells pretreated with octyl-(R)-2-HG or induced to express mutant IDH1R132H than in untreated or uninduced cells, respectively (Fig. 4a). Collapse of ΔΨmito was measured by BH3 profiling28. Treatment with ABT-199 or the BH3 peptide derived from BAD, which binds and inactivates BCL-2, BCL-XL and BCL-W29, triggered collapse of ΔΨmito in cells pretreated with octyl-(R)-2-HG but not in untreated cells (Fig. 4b). In contrast, treatment with the NOXAA BH3 peptide, which binds and inactivates MCL-1 (ref. 30), failed to trigger collapse of ΔΨmito in cells pretreated with octyl-(R)-2-HG, indicating a lack of dependence of these cells on MCL-1, which has been shown to be required for development and sustained growth of AML31.
Figure 4.
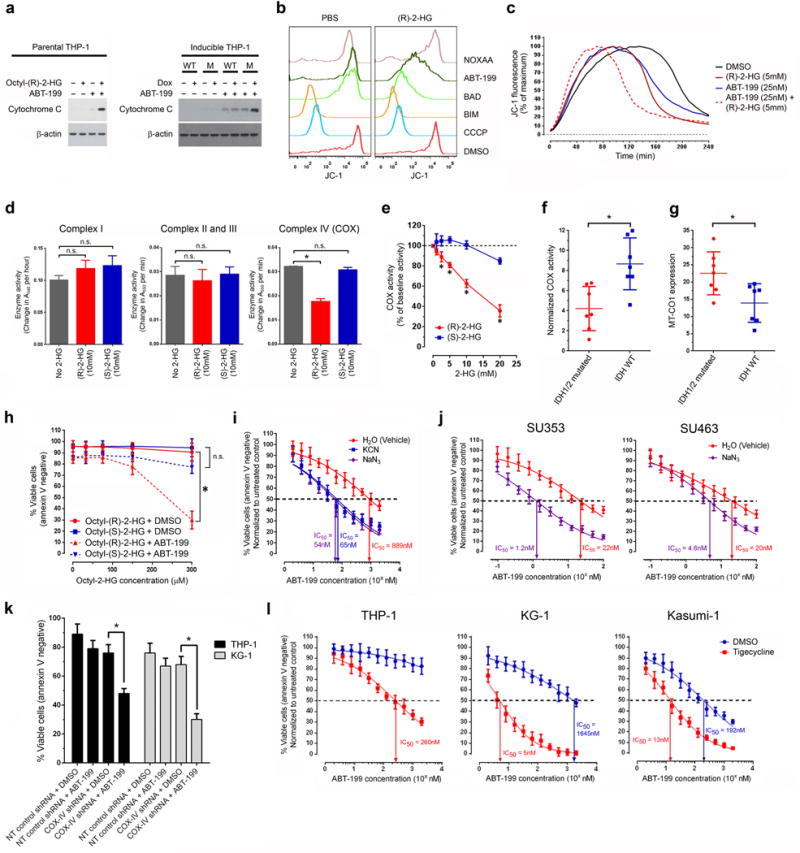
(R)-2-HG–mediated inhibition of cytochrome c oxidase activity induces BCL-2 dependence. (a) Western blot for cytochrome C in the cytosolic fraction of THP-1 cells treated with DMSO (−) or ABT-199 (+) at 200 nM for 6 h. Left panel, parental cells were either untreated (–) or pretreated with octyl-(R)-2-HG (+) at 300 μM for 24 h. Right panel, engineered THP-1 cell lines were either untreated (–) or pretreated with doxycycline (+) for 72 h to induce expression of either WT IDH1 (WT) or mutant IDH1R132H (M). β-actin, loading control. The data shown are representative of two experiments. (b) BH3 profiling assay of parental THP-1 cells pretreated with PBS (control) or octyl-(R)-2-HG (300 μM) for 24 h using the membrane potential–sensitive probe JC-1 (5,5′,6,6′-tetrachloro-1,1′,3,3′-tetraethyl-imidacarbocyanine iodide)28. The data shown are representative of two experiments. (c) Time-course fluorescence of the membrane potential–sensitive probe JC-1 in purified mitochondria treated with the indicated compounds. The data shown are representative of three experiments. (d) Enzymatic activities of complex I, II, III and IV (COX) of the electron transport chain (ETC) in the absence or presence of (R)-2-HG or (S)-2-HG. (e) COX activity in the presence of (R)-2-HG or (S)-2-HG at the indicated concentrations. (f) COX activity normalized to MT-CO1 expression in FACS-sorted blasts of primary AML samples. Each data point represents an individual sample (n = 7 for each group). Horizontal line, mean. (g) MT-CO1 expression in the blast population of primary AML samples. Each data point represents an individual sample (n = 7 for each group). Horizontal line, mean. (h) Viability of parental THP-1 cells treated with DMSO (vehicle control) or ABT-199 (200nM) for 48 hours in the presence of either octyl-(S)-2-HG or octyl-(R)-2-HG at the indicated concentrations. (i) Viability of parental THP-1 cells treated with serial dilutions of ABT-199 for 48 hours in the absence or presence of sodium azide (NaN3; 2.5 mM) or potassium cyanide (KCN; 5 mM). (j) Viability of FACS-purified blasts from the indicated wild-type IDH1/2 primary AML samples with serial dilutions of ABT-199 for 48 hours in the absence or presence of sodium azide (NaN3; 5 mM). (k) Viability of parental THP-1 and KG-1 cells transduced with lentiviral vectors encoding the indicated shRNAs and treated with DMSO (vehicle control) or ABT-199 at 200 nM for 48 hours. (l) Viability of parental THP-1, KG-1 and Kasumi-1 cells pretreated with DMSO (vehicle control) or tigecycline (10 μM for THP-1, KG-1 and 2.5 μM for Kasumi-1) for 48 h followed by treatment with serial dilutions of ABT-199 at the indicated concentrations for 24 h. Unless otherwise indicated, the data shown in this figure are the means of three biological replicates. NS, not significant. * P < 0.05. Statistical significance (P) was determined by Student’s t-test. All error bars represent sd.
A possible explanation for the induction of BCL-2 dependence after expression of mutant IDH1/2 or exposure to high intracellular (R)-2-HG concentrations is a change in the balance between antiapoptotic and proapoptotic BCL-2 family members. However, we detected no substantive changes in expression of a panel of antiapoptotic or proapoptotic proteins, including BCL-2, MCL-1 and BCL-xL, which have previously been shown to influence sensitivity to ABT-199 (Supplementary Fig. 7a)21,22.
Given that mutant IDH1/2 expression can reduce glutathione levels32,33 and that BCL-2 may have antioxidant activity34, we hypothesized that a severe compromise in cellular defenses against oxidative stress could underlie the synthetic lethal phenotype. However, treatment with a panel of ten different antioxidants that act on a variety of reactive oxygen species (ROS) failed to reverse the synthetic lethal phenotype, indicating that excessive oxidative stress is unlikely to be the mechanism (Supplementary Fig. 7b).
The synthetic lethal phenotype could be recapitulated in isolated mitochondria, as treatment of purified mitochondria with both (R)-2-HG and ABT-199 collapsed the ΔΨmito at an earlier time point than treatment with (R)-2-HG or ABT-199 alone (Fig. 4c). The effect of (R)-2-HG was enantiomer specific as treatment with (S)-2-HG had no effect on the time of ΔΨmito collapse (Supplementary Fig. 8a). These findings suggest that the target mediating the synthetic lethal phenotype is localized to the mitochondria, the target is differentially affected by the two enantiomers of 2-HG and changes in the epigenome and expression of nuclear-encoded genes are not required for the synthetic lethal phenotype.
Considering these criteria and prior reports demonstrating an inhibitory effect on COX activity of (R)-2-HG but not (S)-2-HG35–37, we next focused on the effect of unmodified (R)-2-HG on the enzymatic activity of individual components in the ETC. ETC dysfunction can potentially alter the threshold for apoptosis38,39. In addition, the IDH1 mutation has recently been reported to sensitize cells to hypoxia and ETC inhibition, suggestive of ETC dysfunction in mutant cells40. (R)-2-HG at concentrations found in IDH1/2 mutant cells (ranging from 1 mM to as high as 30 mM4,8,41) inhibited the in vitro enzymatic activity of complex IV (also referred to as COX) in a dose-dependent manner but had no effect on the activity of complex I (NADH dehydrogenase), II (succinate dehydrogenase), III (cytochrome bc1 complex) or V (ATP synthase) (Fig. 4d,e and Supplementary Fig. 8b). This effect was enantiomer specific, as (S)-2-HG was significantly less potent in inhibiting COX activity (Fig. 4d,e). Our findings differ from previous reports of an inhibitory effect of (R)-2-HG on complex V activity36,42.
To understand how (R)-2-HG inhibits COX activity, we determined whether 2-HG alters the absorbance spectrum of the COX complex, which contains two heme a moieties (a and a3) and two copper atoms (CuA and CuB)43. The iron-containing heme moieties exhibit distinct light absorbance properties that are influenced by the peripheral substituents on the porphyrin ring, the valence state of the metal atoms and their molecular surroundings44. COX in the oxidized state has an absorbance peak at ~415 nm in the Soret region (390–480 nm), which shifts to ~440 nm with reduction (Supplementary Fig. 9a)45. COX inhibitors such as cyanide block enzyme activity by binding the binuclear center formed by heme a3 and CuB and interfere with oxygen reduction at that site45–47. This binding can lead to changes in the spectral properties of the enzyme by perturbing the electronic state of the heme iron44–46. Addition of purified (R)-2-HG at 30 mM to reduced COX resulted in loss of the 440-nm absorbance peak and shift of the Soret maximum to ~420–425 nm, an effect that was not observed with (S)-2-HG (Supplementary Fig. 9a). This effect was dependent on the enzyme being in a partially or fully reduced state as the metabolite failed to alter the absorbance spectrum of fully oxidized COX (Supplementary Fig. 9a). Next, we determined whether the spectral changes induced by (R)-2-HG could be reversed by cyanide, which had no effect on the 440-nm absorbance peak of reduced COX (Supplementary Fig. 9a). Addition of cyanide to the preformed COX:(R)-2-HG complex resulted in the reappearance of the 440-nm absorbance peak (Supplementary Fig. 9b), suggesting displacement of (R)-2-HG by cyanide. On the basis of our spectroscopic studies and the known binding site of cyanide, we propose that (R)-2-HG inhibits COX activity by binding a site at or adjacent to the binuclear center formed by heme a3 and CuB, resulting in interference with the reduction of oxygen.
To confirm that COX activity is decreased in intact primary AML cells harboring IDH1/2 mutations, we determined the rate of oxygen consumption driven by N,N,N′,N′-tetramethyl-p-phenylenediamine (TMPD) as a measure of COX activity using the Seahorse extracellular flux analyzer. COX activity in THP-1 cells pretreated with octyl-(R)-2-HG was reduced compared with untreated cells (Supplementary Fig. 10a). This change was not the result of a decrease in mitochondrial mass (Supplementary Fig. 10b). To control for differences in mitochondrial mass and the level of COX expression in blasts sorted from 14 different primary AML samples of known IDH1/2 mutation status (Supplementary Table 4), we quantified the level of MT-CO1, one of the mitochondrially encoded COX subunits required for catalytic activity, by intracellular flow cytometry and normalized the measured COX activity to MT-CO1 expression. Normalized COX activity in AML blasts harboring IDH1 or IDH2 mutations was significantly decreased compared with wild-type IDH1/2 blasts (Fig. 4f). Notably, the level of MT-CO1 expression was significantly higher in IDH1/2 mutant samples (Fig. 4g), suggesting a compensatory response to COX inhibition. The above findings led us to further investigate the role of COX in mediating the synthetic lethal phenotype.
Previous studies have shown that the S enantiomer of 2-HG is equally or more potent than the R enantiomer in inhibiting the activity of α-KG–dependent dioxygenases9,48. In contrast, we found that the R enantiomer was more potent than the S enantiomer in inhibiting COX activity (Fig. 4d,e). This differential effect on COX activity allowed us to probe whether COX inhibition is necessary for the synthetic lethal phenotype using the two enantiomers of 2-HG. Treatment of parental THP-1 AML cells with octyl-(S)-2-HG failed to sensitize them to ABT-199, in contrast to octyl-(R)-2-HG (Fig. 4h).
To determine whether COX inhibition is sufficient to induce BCL-2 dependence, we treated cells with COX inhibitors, sodium azide (NaN3) or potassium cyanide (KCN), at nontoxic concentrations; this treatment sensitized THP-1, KG-1 and Kasumi-1 AML cells and sorted primary AML blasts with wild-type IDH1/2 to the pro-apoptotic effect of ABT-199 (Fig. 4i,j and Supplementary Fig. 11). Given that azide and cyanide are known to inhibit the activity of other metal-containing enzymes (for example, catalase and superoxide dismutase), we used two alternative strategies to suppress COX activity to confirm specificity of the effect. First we transduced THP-1 and KG-1 cells with a lentiviral shRNA construct targeting subunit IV of COX (COX4I1), which is encoded in the nucleus and required for proper assembly of the COX complex49. This shRNA resulted in reduced COX activity and increased sensitivity to BCL-2 inhibition with ABT-199 (Fig. 4 and Supplementary Fig. 12a,b). Next we treated THP-1, KG-1 and Kasumi-1 cells with tigecycline, an antibiotic that interferes with mitochondrial translation resulting in decreased expression of mitochondrial-encoded proteins including the catalytic subunits (MT-CO1 and MT-CO2) of the COX complex50. Tigecycline treatment reduced the expression of MT-CO1, decreased COX activity and sensitized cells to ABT-199 (Fig. 4 and Supplementary Fig. 13a,b).
On the basis of these findings, we propose a model in which (R)-2-HG accumulation in IDH1/2 mutant AML cells directly inhibits COX and, consequently, increases the dependency on BCL-2 to prevent activation of MOMP and apoptosis. According to this model, COX inhibition mimics a state of oxygen deprivation, which can, in turn, activate BAX/BAK to trigger MOMP, as observed in hypoxia- or anoxia-induced cell death51–53. However, BCL-2 can maintain cell viability by antagonizing BAX/BAK activation, as has been shown to occur in the setting of hypoxia53–55. Treatment with the BH3 mimetic ABT-199 disrupts the complex formation between BCL-2 and BAX/BAK and consequently unleashes the full activation of the multidomain proapoptotic proteins, leading to apoptosis (Supplementary Fig. 14).
Our findings open up the intriguing possibility that IDH1/2 mutations contribute to leukemogenesis not only through epigenetic changes but also through dysregulation of mitochondrial function. The presence of recurrent mutations in mitochondrial genes that encode components of the ETC, including COX subunits in AML and other cancers, suggests that the effect of (R)-2-HG on mitochondrial respiration may promote oncogenesis56,57. Regardless of its precise role in oncogenesis, we showed that this effect has notable therapeutic implications as it induces dependence on BCL-2 for survival and sensitivity to ABT-199 treatment. Although BCL-2 inhibition has previously been shown to be effective in killing AML cells22,58–60, the level of sensitivity varies greatly between patients, and specific mutations that determine sensitivity have not been previously identified. Our results indicate that IDH1/2 mutation status is one factor that affects ABT-199 sensitivity and may be useful in identifying patients that are likely to respond to pharmacologic BCL-2 inhibition. In addition, our findings form the rational basis for combining agents that disrupt the activity of COX and perhaps other components of the ETC with ABT-199 to target resistant cancer cells and maximize the clinical utility of this promising drug.
Methods
Methods and any associated references are available in the online version of the paper.
Online Methods
AML cell lines and reagents
THP-1, Kasumi-1, KG-1, OCI-AML3, NB4, U937, and HEL AML cell lines were cultured in RPMI-1640 medium (Life Technologies, Grand Island, NY) with 10% FBS (FBS), 2 mM GlutaMAX (Life Technologies) and 25 mM HEPES. TF-1 cells were cultured the above medium supplemented with GM-CSF at 2ng/ml. The identity of each cell line was authenticated by short tandem repeat (STR) analysis (Bio-Synthesis, Lewisville, TX). Testing for mycoplasma was routinely performed to rule out contamination using an ELISA-based detection kit (Roche Life Science, Indianapolis, IN).
The unmodified and octyl esters of (R)-2-HG and (S)-2-HG were purchased from Toronto Research Chemicals (Toronto, Ontario, Canada). Stock solutions were made by dissolving the unmodified metabolites in water to 666 mM and the octyl esters in phosphate-buffered saline (PBS) to 50 mM. A stock solution of ABT-199 (ChemieTek, Indianapolis, IN) for in vitro studies was made by dissolving the compound in dimethyl sulfoxide (DMSO) to 10 mM. A stock solution of the mutant IDH1 inhibitor, AGI-5198 (Xcessbio, San Diego, CA) was made by dissolving the compound in DMSO to 10 mM. Sodium azide and potassium cyanide were purchased from Sigma (St. Louis, MO), and stock solutions were prepared in water. A stock solution of tigecycline (Selleckchem, Houston, TX) was made by dissolving the compound in DMSO to 10 mM. Doxorubicin and cytarabine were purchased from Sigma.
Construction of cDNA expression lentiviral vectors
The complementary DNA (cDNA) clone of human IDH1 (GenBank accession code: NM_005896) was purchased from Thermo Scientific (Pittsburg, PA) in the pCMV-SPORT6 vector. The arginine-to-histidine substitution at amino acid position 132 of IDH1 (p.R132H; c.395G>A) was generated using the QuikChange II site-directed mutagenesis kit (Agilent Technologies, Santa Clara, CA) per manufacturer’s instructions. The open reading frame of wild-type or mutant IDH1 was PCR amplified and cloned into the pCDH-EF1-MCS-T2A-GFP vector (System Biosciences, Mountain View, CA) between the BstBI and NotI sites in the multiple cloning site (MCS) and upstream of the T2A ‘self-cleaving’ peptide sequence. The IDH1-T2A-GFP cassette was subsequently PCR amplified and cloned into the doxycycline-inducible pTRIPZ vector carrying a nontargeting shRNA control sequence (Thermo Scientific) between the AgeI and ClaI sites, replacing the turboRFP reporter gene in the parental vector. The vector also constitutively expressed a puromycin resistance gene.
The complementary DNA (cDNA) clone of human IDH2 (GenBank accession code NM_002168) was purchased from Thermo Scientific in the pOTB7 vector. The arginine-to-glutamine substitution at amino acid position 140 (p.R140Q; c.419G>A) and the arginine-to-lysine substitution at position 172 (p.R172K; c515G>A) of IDH2 were generated using the QuikChange II site-directed mutagenesis kit (Agilent Technologies). The open reading frame of wild-type or mutant IDH2 was PCR amplified and cloned into the pCDH-EF1-MCS-T2A-GFP vector (System Biosciences) between the BstBI and NotI sites in the MCS and upstream of the T2A self-cleaving peptide sequence.
Construction of BCL-2 and COX-IV shRNA expression lentiviral vectors
The human BCL-2 (GenBank accession code: NM_000633) shRNA target sequences were selected using the BLOCK-iT RNAi Designer tool (Life Technologies). Knockdown efficiency of BCL-2 shRNA constructs was determined using intracellular flow cytometry. The human COX-IV isoform 1 (GenBank accession code NM_001861.3) shRNA target sequence was adapted from a previously published 19-nt sequence that successfully targeted mouse COX-IV49. A pair of DNA oligonucleotides containing the sense target sequence followed by a loop sequence (5′-TCAAGAG-3′) and the reverse complement of the sense sequence were synthesized and annealed at 50 μM in annealing buffer (10 mM Tris-HCl pH 8.0, 50 mM NaCl, 1mM EDTA) at 95 °C for 10 min, followed by a slow cooling over 1 h to room temperature. The double-stranded DNA template was then cloned into the pRSI9 DECIPHER shRNA expression vector (Cellecta, Mountain View, CA) digested with BsbI.
The BCL-2 sequences targeted by shRNA vectors used in this study were: 5′-GGGATCGTTGCCTTATGCATTTGTT-3′ (shRNA #1); 5′-TAGCTGGATTATAACTCCTCTTCTT-3′ (shRNA #3); 5′-GCATTGTCAGTGATGTACCATGAAA-3′(shRNA #4). The COX-IV isoform 1 target sequence used in this study was 5′- agagctttgctgagatgaa – 3′. The nontargeting control sequence used in this study was 5′-GCACTACCAGAGCTAACTCAGATAGTACT-3′.
Lentivirus production
The 293TN producer cell line (System Biosciences, Mountain View, CA) was grown in Advanced DMEM (Life Technologies) with 10% FBS and 2 mM GlutaMAX. One day before transfection, 8 to 9 million cells were plated in a 150-mm tissue-culture dish. On the day of transfection, 13.5 μg of the lentiviral expression plasmid was combined with 8.8 μg of the packaging vector psPAX2 and 4.7 μg of the envelope expressing plasmid pCMV-VSV-G. The DNA mixture was diluted in Opti-MEM I medium (Life Technologies), mixed with 293fectin transfection reagent (Life Technologies) at a ratio of 3 μl per 1 μg of DNA and added to the plated 293TN cells. Viral supernatant was collected at 48 h and 72 h after transfection, filtered through a 0.45-μm PVDF filter and concentrated using PEG-it (System Biosciences) per the manufacturer’s protocol. The concentrated lentiviral particles were resuspended in HBSS with 25 mM HEPES and stored at –80 °C.
Lentivirus transduction
Wells in a 12-well non-tissue-culture-treated plate were coated with 0.5 ml of RetroNectin per well (Clontech Laboratories, Mountain View, CA) at 100 μg/ml in PBS for 2 h at room temperature (RT). The wells were then blocked with a 2% (w/v) solution of bovine serum albumin (BSA) in PBS for 30 min at RT. The BSA solution was then aspirated, and lentiviral particles in HBSS with 25 mM HEPES were added to each well at a volume of 0.5 ml. The plate was then centrifuged at 3,700 r.p.m. for 2 h at RT to promote attachment of the lentiviral particles to RetroNectin. After aspirating the supernatant, 1 to 4 million cells were added to each well in 1 ml of medium. The plate was centrifuged again at 1,300 r.p.m. for 10 min at RT to promote interaction between the cells and lentiviral particles and then transferred to a 37 °C incubator to initiate lentiviral infection.
Generation of inducible THP-1 cell lines
THP-1 cells were transduced with lentiviral particles made using the doxycycline inducible pTRIPZ vector modified to express either wild-type IDH1 or mutant IDH1R132H along with a GFP marker. The cells were then treated with puromycin (Invivogen, San Diego, CA) at 1 μg/ml to select for transduced cells. A small fraction (<5%) of the puromycin-resistant cells were GFP-positive, presumably owing to leakiness in the inducible system, and these cells were removed by FACS sorting. The GFP-negative population was then subjected to a short 12-h induction with doxycycline at 2 μg/ml. The resulting GFP-positive population was sorted to > 99% purity by FACS and subsequently maintained in medium containing puromycin at 1–2 μg/ml in the absence of doxycycline.
Synthetic lethal RNAi screen
The IDH1 WT and R132H inducible THP-1 cell lines were transduced with the DECIPHER 27K Pooled shRNA lentivirus library–Human Module 1 (Cellecta). The library contains 27,500 unique shRNA constructs targeting 5,043 human genes (approximately five or six redundant shRNAs per gene) in the pRSI9 shRNA expression vector. The vector contains the following elements: (i) U6 RNA polymerase III promoter driving shRNA expression, (ii) 18-nucleotide DNA barcode sequence and (iii) UbiC promoter driving RFP expression to mark transduced cells. For each inducible cell line, 12 million cells were transduced at an efficiency of 30% to ensure that ~90% of the transduced cells were single integrants according to the Poisson distribution. The number of transduced cells was approximately 100-fold the complexity of the library. Three days after transduction, each cell population was divided into two flasks. Doxycycline was added to one of the flasks at a final concentration of 2 μg/ml to induce expression of either wild-type or mutant IDH1R132H. The cells were expanded and selected in culture for 12 additional days. During this period, the number of transduced cells in each flask was maintained at >1,000-fold the complexity of the library. After the selection period, the cells were centrifuged, and the resulting cell pellet was snap-frozen in a dry-ice/ethanol bath. The samples were submitted to Cellecta, Inc. for genomic DNA extraction, bar code amplification, high-throughput sequencing and deconvolution. Twenty million barcode reads were performed for each sample.
Algorithm to identify synthetic lethal gene hits
The following algorithm was used to identify synthetic lethal gene hits: (i) shRNA constructs with less than 100 barcode reads in the THP-1 R132H no-doxycycline sample were excluded for further analysis to minimize noise associated with inadequate baseline representation. (ii) The remaining constructs with a drop-out ratio (the number of reads in the presence of doxycycline divided by the number of reads in the absence of doxycycline in THP-1 R132H cells) of less than 0.6 were considered shRNA hits. (iii) Genes with less than three redundant shRNA hits were excluded. (iv) genes with a mean drop-out ratio of less than 0.5 for the shRNA hits were considered gene hits. Of the 5,043 genes in the library, 15 genes (0.29%) were considered synthetic lethal hits using this algorithm.
Annexin V staining
The percentage of apoptotic cells in a sample was determined by Annexin V staining. Cells were washed once in 1× Annexin binding buffer (BD Biosciences, San Jose, CA) and resuspended in 100 μl of buffer containing 5 μl of Annexin V conjugated to Alexa Fluor 647 (Life Technologies). The cells were stained at RT for 15 min followed by analysis on a flow cytometer.
Cell viability measurement using Presto Blue
Cells cultured in 96-well tissue cultures plates were vigorously resuspended by pipetting. Ninety microliters of cells from each well were transferred to a new 96-well flat clear-bottom plate. Ten microliters of the Presto Blue Cell Viability reagent (Life Technologies) were added to each well. The plates were incubated at 37 °C for 2–4 h and then analyzed using a fluorescence plate reader with excitation set at 535 nm and emission at 615 nm. The background fluorescence value of medium only wells was subtracted from each reading.
Primary human samples
Human AML samples were obtained from patients at the Stanford Medical Center with informed consent, according to Institutional Review Board (IRB)-approved protocols (Stanford IRB no. 18329 and no. 6453). Cord blood samples were obtained from patients at the Lucile Packard Children’s Hospital with informed consent, according to IRB-approved protocols (Stanford IRB no. 5637). Mononuclear cells from each sample were isolated by Ficoll separation and cryopreserved in liquid nitrogen.
All of the primary samples used in this study were tested for mutations in FLT3, NPM1, IDH1 and IDH2 by the Stanford Anatomic Pathology and Clinical Laboratories. IDH1/2 mutations were detected using SNaPshot methodology (Life Technologies).
FACS sorting for the blast population in primary AML samples
Primary AML samples were thawed and cultured in EGM-2 medium (Lonza, Hopkinton, MA) for 24 h before sorting for the viable blast population. This medium has previously been shown to support survival and growth of primary AML cells61. The cells were then stained with an anti-human CD45 antibody conjugated to BD Horizon V450 (clone HI30; BD Biosciences) in FACS buffer (PBS with 2% FBS and 2mM EDTA). After staining for CD45, the cells were washed in 1× annexin V binding buffer and stained with annexin V conjugated to Alexa Fluor 647 as described above. The annexin V–negative blast population (as determined by CD45 versus side scatter profile) was sorted to >99% purity by FACS using a FACSAria II (Becton-Dickenson, San Jose, CA) (Supplementary Fig. 4). The sorted cells were cultured in EGM-2 medium and used to determine ABT-199 IC50 or oxygen consumption rates.
CD34+ HSPC enrichment from cord blood
CD34+ HSPCs were enriched from freshly thawed cord blood samples by magnetic separation using CD34 microbeads (Miltenyi Biotec, San Diego, CA) per manufacturer’s protocol and cultured in HPGM medium (Lonza) supplemented with FLT3 ligand, thrombopoietin, and stem cell factor. The cytokines were all purchased from Peprotech (Rocky Hill, NJ) and used at 100 ng/ml. After culturing the cells at a density of ~1–2 million cells per ml for 48 h, the cells were used to determine the ABT-199 IC50.
Animal care
All mouse experiments were conducted according to an Institutional Animal Care and Use Committee–approved protocol (Stanford Administrative Panel on Laboratory Animal Care no. 22264) and in adherence to the National Institutes of Health’s Guide for the Care and Use of Laboratory Animals.
NSG xenotransplantation
Freshly thawed primary AML samples were subjected to T cell depletion using anti-CD3 magnetic beads (Miltenyi Biotec). T cell depletion has previously been shown to enhance the engraftment of AML cells in NSG hosts by limiting polyclonal donor T cell expansion due to xenogeneic graft versus host disease62. One to five million T cell –depleted cells were transplanted intravenously into 6- to 12-week-old NSG mice conditioned with 200 rad of irradiation. Both female and male mice were used. Up to five mice were transplanted for each treatment group if a sufficient amount of primary patient material was available. A fewer number of mice were used if the sample was limiting. The number of mice used for the experiments shown in Figure 3b,c and the gender of these animals are detailed in Supplementary Table 3. In the experiment shown in Figure 3d, total bone marrow cells were collected from one primary recipient mouse in each treatment group, and equivalent numbers of cells (6 × 10⁵ cells for SU372, 1 × 10⁶ cells for SU430 and SU291F) were transplanted into each secondary recipient mouse. Six- to twelve-week old female NSG mice conditioned with 200 rad of irradiation were used as secondary recipients with five animals in each group. Animals were block randomized to either mock (control) or ABT-199 treatment. Investigators were not blinded to treatment group assignment.
ABT-199 treatment
For in vivo treatment studies, ABT-199 was resuspended in 60% Phosal 50 PG (American Lecithin Company, Oxford, CT), 30% PEG-400 (Sigma), and 10% ethanol to a final concentration of 10 mg/ml. The drug was administered by oral gavage at a dose of 100 mg per kg per day. In the experiment shown in Figure 3b, ABT-199 treatment was started 9 to 22 weeks after transplantation of human AML cells into NSG mice.
Bone marrow engraftment analysis
Bone marrow cells were collected by aspiration of the femur using a 27-gauge needle and stained for 30 min at 4 °C with the following fluorophore-conjugated monoclonal antibodies: mTER199-PE-Cy5 (dilution 1:50; clone TER-199, eBioscience), mCD45-PE-Cy7 (dilution 1:50; clone A20, eBioscience), hCD45-V450 (dilution 1:25; clone HI30, BD), hCD33-PE (dilution 1:50; clone WM53, BD), hCD19-APC (dilution 1:50; clone HIB19, BD), and hCD3-APC-Cy7 (dilution 1:20; clone SK7, BD). Viable cells were identified by propidium iodide exclusion. The human leukemic population was identified as mTER199−, mCD45−, hCD45+, hCD33+, hCD19−, and hCD3−.
BH3 profiling assay
BH3 profiling assays were performed as previously described63. In the experiment shown in Figure 4b, cells were treated with BH3 peptides (NOXAA, BAD, or BIM) at a final concentration of 100 μM, carbonyl cyanide m-chlorophenyl hydrazine (CCCP) at 10 μM or ABT-199 at 250 nM.
Measurement of mitochondrial respiratory chain enzymatic activities
Enzymatic activity of complex I, II, III and V were measured using the MitoTox OXPHOS activity assay kit (MitoSciences, Eugene, OR) per manufacturer’s protocol. The change in absorbance at 340 nm or 550 nm from 60–120 min was used to calculate the activity of complex I or combined activity of II and III, respectively. The change in absorbance at 340 nm from 30–60 min was used to calculate the activity of complex V.
Activity of cytochrome c oxidase was measured using the COX assay kit (CYTOCOX1; Sigma) per manufacturer’s protocol. The change in absorbance at 550 nm in the first 60 s was used to calculate activity of cytochrome C oxidase. Purified (R)-2-HG or (S)-2-HG dissolved in water was added to each assay to determine their effects on enzyme activity.
Absorption spectroscopic analysis of cytochrome c oxidase
Oxidized cytochrome c oxidase (Sigma) was diluted in 0.1 M phosphate buffer (pH 7.4) at a concentration of 500 μg/ml. For the reduction of COX, sodium dithionite (Sigma) dissolved in 0.1 M phosphate buffer (pH 7.4) was added to the enzyme solution at a final concentration of 50 mM. Purified (R)-2-HG (30 mM final concentration), (S)-2-HG (30 mM final concentration), or potassium cyanide (10 mM final concentration) dissolved in water was then added to the oxidized or reduced enzyme solution. After incubation at room temperature for 1 h, the absorbance spectrum of the enzyme solution was measured from 390 nm to 490 nm at 1-nm steps in a cuvette using a SpectraMax M3 plate reader (Molecular Devices, Sunnyvale, CA). For the displacement studies, potassium cyanide (10 mM final concentration) was then added to the solution of reduced COX preincubated with (R)-2-HG. The absorbance spectrum of the solution was measured again following a 1-h incubation at room temperature.
Determination of cytochrome c oxidase activity in intact cells using the Seahorse extracellular flux analyzer
AML cell lines or FACS-sorted primary cells were resuspended in XF Assay Medium (Seahorse Bioscience, North Billerica, MA) containing 2g/l glucose and 5 mM HEPES (pH adjusted to 7.4). Two hours before analysis, 150,000 (cell lines) or 500,000 (primary samples) cells were added to each well in a 96-well XF assay plate precoated with Cell-Tak (Corning). The plate was centrifuged to attach cells to the bottom of the well and incubated at 37 °C without supplemental CO2. Oxygen consumption rates (OCR) were measured using the Seahorse 96F extracellular flux analyzer every 8 min. OCR measurements were collected at baseline and after the addition of carbonyl cyanide-4-(trifluoromethoxy)phenylhydrazone (FCCP) at 0.15 μM (final concentration in well), antimycin A (AA) at 2.5μM, N,N,N′,N′-tetramethyl-p-phenylenediamine/sodium ascorbate (TMPD/A) at 0.25 mM/1.25 mM and sodium azide (NaN3) at 20 mM. Specific COX activity was calculated as the difference between the maximum OCR reading following addition of TMPD/A, which drives COX activity, and the minimum OCR reading following addition of azide, which irreversibly inhibits COX activity.
Assay for collapse of the transmembrane potential in isolated mitochondria
Functional mitochondria from 20 million THP-1 cells were purified using the Qproteome mitochondria isolation kit (Qiagen, Valencia, CA) per manufacturer’s protocol and resuspended in 1 ml of DTEB (Derived from trehalose experimental buffer; 135 mM trehalose, 50 mM KCL, 20 μM EDTA, 20 μM EGTA, 0.1% BSA, 5 mM succinate, 10 mM HEPES, pH 7.5)63. The resuspended mitochondria were then added to DTEB containing JC-1 (5,5′,6,6′-tetrachloro-1,1′,3,3′-tetraethyl-imidacarbocyanine iodide; 1 μM final concentration, Life Technologies) and 2-mercaptoethanol (5 mM final concentration). DMSO, unmodified (R)-2-HG (5 mM final concentration), unmodified (S)-2-HG (5 mM concentration), and/or ABT-199 (25 nM final concentration) were then added. The mixture was immediately transferred to wells (200 μl per well) in a black untreated 96-well plate. Kinetic fluorescence measurements with excitation set at 545 nm and emission at 590 nm were made every 5 min for 4 h at 30 °C on a SpectraMax M3 plate reader (Molecular Devices).
MitoTracker Green FM staining
Cells were resuspended in complete medium containing 100 nM of MitoTracker Green FM (Life Technologies) and incubated at 37 °C for 30 min. The cells were then resuspended in FACS buffer before analysis on a flow cytometer.
Western blotting
Standard western blotting techniques were performed. A mouse monoclonal BCL-2 antibody (clone 6C8; BD Biosciences) was used at a dilution of 1:1,000. A rabbit monoclonal antibody against BAX (clone DE211, Cell Signaling Technology, Beverly, MA) was used at a dilution of 1:1,000. A rabbit monoclonal antibody against BAK (clone D2D3, Cell Signaling Technology) was used at a dilution of 1:1,000. A rabbit monoclonal antibody against BIM (clone C34C5, Cell Signaling Technology) was used at a dilution of 1:1,000. A rabbit polyclonal antibody against BIK (Cell Signaling Technology) was used at a dilution of 1:1,000. A rabbit polyclonal antibody against BID (Cell Signaling Technology) was used at a dilution of 1:1,000. A rabbit monoclonal antibody against NOXA (clone EPR9735(B), Abcam, Cambridge, MA) was used at a dilution of 1:1,000. A rabbit polyclonal antibody against MCL-1 (Santa Cruz Biotechnology, Dallas, TX) was used at a dilution of 1:100. A rabbit monoclonal antibody against BCL-xL (clone 54H6, Cell Signaling Technology) was used at a dilution of 1:1,000. A rabbit polyclonal antibody against the 2A peptide (Millipore, Hayward, CA) was used at a dilution of 1:1,000. The specificity of the anti-2A antibody was confirmed on the basis of the lack of staining in lysates obtained from cells that did not express 2A-tagged proteins (Supplementary Fig. 1c). A rabbit monoclonal cytochrome c antibody (clone D18C7; Cell Signaling Technology) was used a dilution of 1:1,000. A rabbit monoclonal COX IV (clone 3E11; Cell Signaling Technology) was used at a dilution of 1:2,000. A mouse monoclonal β-actin antibody (clone 8H10D10; Cell Signaling Technology) was used at a dilution of 1:5,000. Standard secondary antibodies conjugated to HRP were used following incubation with primary antibodies. The cytosolic fraction used for detection of cytochrome c release following ABT-199 treatment was prepared as previously described64.
Intracellular flow cytometry staining
Cells were fixed in 2% paraformaldehyde in PBS for 10 min at 37 °C and permeabilized in 90% methanol chilled to –20 °C for 30 min. The cells were then washed in PBS with 2% BSA, stained with a primary antibody for 1 h at RT and, if necessary, stained with a secondary antibody for 30 min at RT. The stained cells were analyzed immediately on a flow cytometer. The following primary antibodies were used for intracellular staining: (i) monoclonal mutant IDH1 R132H antibody (clone H09; Dianova, Hamburg, Germany) at 2 μg/ml, (ii) monoclonal BCL-2 antibody (clone Bcl-2/100; BD Biosciences) conjugated to V450 at 1:20 dilution, and (iii) monoclonal MT-CO1 antibody (clone 1D6E1A8; MitoSciences) conjugated to Alexa Fluor 488 at 1:100 dilution. For quantification of MT-CO1 expression of primary AML samples in Figure 4g, an IgG2a isotype control antibody conjugated to Alexa Fluor 488 was used to determine background nonspecific fluorescence staining. MT-CO1 expression was determined as the mean fluorescence intensity (MFI) ratio of specific MT-CO1 staining to isotype control staining. A goat anti-mouse IgG antibody conjugated to Alexa Fluor 647 (0.5 μg/ml) was used as secondary antibody for mutant IDH1R132H detection.
2-HG measurement
Cell pellets were rapidly quenched in 80% methanol chilled to –80 °C, incubated in a dry ice and ethanol bath for 40 min, and centrifuged at 20,000g for 20 min at 4 °C. The supernatant was transferred to a new tube and dried under vacuum. The dried extracts were redissolved in a 1:1 mixture of acetonitrile and N-methyl-N-tert-butyldimethylsilyltrifluoroacetamide (MTBSTFA; Regis) and heated for 75 min at 70 °C to derivatize before gas chromatography-mass spectrometry (GC-MS) analysis. GC-MS analysis was performed as described previously65. Identification of the 2-HG and glutamate peaks was confirmed using purified metabolites purchased from Toronto Research Chemicals and Sigma, respectively. Signal intensities were quantified by integration of peak areas.
Complete blood counts
Peripheral venous blood was obtained from the mouse tail using standard techniques and analyzed using the HemaTrue Veterinary Hematology Analyzer (Heska, Loveland, CO) per manufacturer’s instructions.
Statistical analysis
Unless otherwise stated, P values comparing two means was calculated using the two-tailed unpaired Student’s t-test in Prism version 6 (GraphPad Software, Inc. La Jolla, CA). A P-value less than 0.05 was considered statistically significant. For Figures 3a, 4f, and 4g, the Shapiro-Wilk test was used to verify normality, and the F-test was used to verify equal variance. For Figure 3b,d, and Supplementary Fig. 5, the two-tailed unpaired Student’s t-test with Welch’s correction was used owing to unequal variance between the two comparison groups. IC50 values were determined using the dose response (inhibition) function in Prism version 6.0. The data were normalized and fitted using a variable Hill Slope model. P values comparing two Kaplan-Meier survival curves was calculated using the log-rank (Mantel-Cox) test in Prism version 6.0. For Figure 3a, sample size was determined based on achieving 80% power with a type I error rate of 5% and a magnitude of effect of ~75–80%.
Supplementary Material
Acknowledgments
We acknowledge the Hematology Division Tissue Bank and the patients for donating their samples. We acknowledge A. Giaccia for providing access to the Seahorse extracellular flux analyzer. S.M.C. is supported by a Stanford University School of Medicine Dean’s Postdoctoral Fellowship and an American Society of Hematology Scholar Award. R.M. holds a Career Award for Medical Scientists from the Burroughs Wellcome Fund and is a New York Stem Cell Foundation Robertson Investigator. This research was supported by the Burroughs Wellcome Fund, the New York Stem Cell Foundation, and a NIH grant R01CA188055 to R.M.
Footnotes
Note: Any Supplementary Information and Source Data files are available in the online version of the paper.
Author contributions
S.M.C., D.T. and R.M. designed experiments. S.M.C., D.T., M.R.C.-Z., S.X., S.R., W.-J.H. and F.Z. performed the experiments. S.M.C., B.C.M., D.A.T. and R.M. analyzed and interpreted the data. S.M.C. and R.M. wrote the manuscript.
Competing financial interests
The authors declare no competing financial interests.
References
- 1.Raimundo N, Baysal BE, Shadel GS. Revisiting the TCA cycle: signaling to tumor formation. Trends Mol Med. 2011;17:641–649. doi: 10.1016/j.molmed.2011.06.001. [DOI] [PMC free article] [PubMed] [Google Scholar]
- 2.Mardis ER, et al. Recurring mutations found by sequencing an acute myeloid leukemia genome. N Engl J Med. 2009;361:1058–1066. doi: 10.1056/NEJMoa0903840. [DOI] [PMC free article] [PubMed] [Google Scholar]
- 3.Yan H, et al. IDH1 and IDH2 mutations in gliomas. N Engl J Med. 2009;360:765–773. doi: 10.1056/NEJMoa0808710. [DOI] [PMC free article] [PubMed] [Google Scholar]
- 4.Gross S, et al. Cancer-associated metabolite 2-hydroxyglutarate accumulates in acute myelogenous leukemia with isocitrate dehydrogenase 1 and 2 mutations. J Exp Med. 2010;207:339–344. doi: 10.1084/jem.20092506. [DOI] [PMC free article] [PubMed] [Google Scholar]
- 5.Parsons DW, et al. An integrated genomic analysis of human glioblastoma multiforme. Science. 2008;321:1807–1812. doi: 10.1126/science.1164382. [DOI] [PMC free article] [PubMed] [Google Scholar]
- 6.Patel JP, et al. Prognostic relevance of integrated genetic profiling in acute myeloid leukemia. N Engl J Med. 2012;366:1079–1089. doi: 10.1056/NEJMoa1112304. [DOI] [PMC free article] [PubMed] [Google Scholar]
- 7.Ward PS, et al. The common feature of leukemia-associated IDH1 and IDH2 mutations is a neomorphic enzyme activity converting α-ketoglutarate to 2-hydroxyglutarate. Cancer Cell. 2010;17:225–234. doi: 10.1016/j.ccr.2010.01.020. [DOI] [PMC free article] [PubMed] [Google Scholar]
- 8.Dang L, et al. Cancer-associated IDH1 mutations produce 2-hydroxyglutarate. Nature. 2009;462:739–744. doi: 10.1038/nature08617. [DOI] [PMC free article] [PubMed] [Google Scholar]
- 9.Xu W, et al. Oncometabolite 2-hydroxyglutarate is a competitive inhibitor of α-ketoglutarate–dependent dioxygenases. Cancer Cell. 2011;19:17–30. doi: 10.1016/j.ccr.2010.12.014. [DOI] [PMC free article] [PubMed] [Google Scholar]
- 10.Figueroa ME, et al. Leukemic IDH1 and IDH2 mutations result in a hypermethylation phenotype, disrupt TET2 function, and impair hematopoietic differentiation. Cancer Cell. 2010;18:553–567. doi: 10.1016/j.ccr.2010.11.015. [DOI] [PMC free article] [PubMed] [Google Scholar]
- 11.Lu C, et al. IDH mutation impairs histone demethylation and results in a block to cell differentiation. Nature. 2012;483:474–478. doi: 10.1038/nature10860. [DOI] [PMC free article] [PubMed] [Google Scholar]
- 12.Shlush LI, et al. Identification of pre-leukaemic haematopoietic stem cells in acute leukaemia. Nature. 2014;506:328–333. doi: 10.1038/nature13038. [DOI] [PMC free article] [PubMed] [Google Scholar]
- 13.Corces-Zimmerman MR, Hong WJ, Weissman IL, Medeiros BC, Majeti R. Preleukemic mutations in human acute myeloid leukemia affect epigenetic regulators and persist in remission. Proc Natl Acad Sci USA. 2014;111:2548–2553. doi: 10.1073/pnas.1324297111. [DOI] [PMC free article] [PubMed] [Google Scholar]
- 14.Chan SM, Majeti R. Role of DNMT3A, TET2, and IDH1/2 mutations in pre-leukemic stem cells in acute myeloid leukemia. Int J Hematol. 2013;98:648–657. doi: 10.1007/s12185-013-1407-8. [DOI] [PMC free article] [PubMed] [Google Scholar]
- 15.Jan M, et al. Clonal evolution of preleukemic hematopoietic stem cells precedes human acute myeloid leukemia. Sci Transl Med. 2012;4:149ra118. doi: 10.1126/scitranslmed.3004315. [DOI] [PMC free article] [PubMed] [Google Scholar]
- 16.Chou WC, et al. The prognostic impact and stability of Isocitrate dehydrogenase 2 mutation in adult patients with acute myeloid leukemia. Leukemia. 2011;25:246–253. doi: 10.1038/leu.2010.267. [DOI] [PubMed] [Google Scholar]
- 17.Chou WC, et al. Distinct clinical and biologic characteristics in adult acute myeloid leukemia bearing the isocitrate dehydrogenase 1 mutation. Blood. 2010;115:2749–2754. doi: 10.1182/blood-2009-11-253070. [DOI] [PubMed] [Google Scholar]
- 18.Wang F, et al. Targeted inhibition of mutant IDH2 in leukemia cells induces cellular differentiation. Science. 2013;340:622–626. doi: 10.1126/science.1234769. [DOI] [PubMed] [Google Scholar]
- 19.Rohle D, et al. An inhibitor of mutant IDH1 delays growth and promotes differentiation of glioma cells. Science. 2013;340:626–630. doi: 10.1126/science.1236062. [DOI] [PMC free article] [PubMed] [Google Scholar]
- 20.Luo J, Solimini NL, Elledge SJ. Principles of cancer therapy: oncogene and non-oncogene addiction. Cell. 2009;136:823–837. doi: 10.1016/j.cell.2009.02.024. [DOI] [PMC free article] [PubMed] [Google Scholar]
- 21.Souers AJ, et al. ABT-199, a potent and selective BCL-2 inhibitor, achieves antitumor activity while sparing platelets. Nat Med. 2013;19:202–208. doi: 10.1038/nm.3048. [DOI] [PubMed] [Google Scholar]
- 22.Pan R, et al. Selective BCL-2 inhibition by ABT-199 causes on target cell death in acute myeloid leukemia. Cancer Discov. 2014;4:362–375. doi: 10.1158/2159-8290.CD-13-0609. [DOI] [PMC free article] [PubMed] [Google Scholar]
- 23.BCL-2 inhibitor yields high response in CLL and SLL. Cancer Discov. 2014;4:OF5. doi: 10.1158/2159-8290.CD-NB2013-178. [DOI] [PubMed] [Google Scholar]
- 24.Dick JE. Stem cell concepts renew cancer research. Blood. 2008;112:4793–4807. doi: 10.1182/blood-2008-08-077941. [DOI] [PubMed] [Google Scholar]
- 25.Saito Y, et al. Induction of cell cycle entry eliminates human leukemia stem cells in a mouse model of AML. Nat Biotechnol. 2010;28:275–280. doi: 10.1038/nbt.1607. [DOI] [PMC free article] [PubMed] [Google Scholar]
- 26.Craddock C, et al. Azacitidine fails to eradicate leukemic stem/progenitor cell populations in patients with acute myeloid leukemia and myelodysplasia. Leukemia. 2013;27:1028–1036. doi: 10.1038/leu.2012.312. [DOI] [PubMed] [Google Scholar]
- 27.Ni Chonghaile T, Letai A. Mimicking the BH3 domain to kill cancer cells. Oncogene. 2008;27(Suppl 1):S149–S157. doi: 10.1038/onc.2009.52. [DOI] [PMC free article] [PubMed] [Google Scholar]
- 28.Ryan J, Letai A. BH3 profiling in whole cells by fluorimeter or FACS. Methods. 2013;61:156–164. doi: 10.1016/j.ymeth.2013.04.006. [DOI] [PMC free article] [PubMed] [Google Scholar]
- 29.Danial NN. BAD: undertaker by night, candyman by day. Oncogene. 2008;27(Suppl 1):S53–S70. doi: 10.1038/onc.2009.44. [DOI] [PubMed] [Google Scholar]
- 30.Ploner C, Kofler R, Villunger A. Noxa: at the tip of the balance between life and death. Oncogene. 2008;27(Suppl 1):S84–S92. doi: 10.1038/onc.2009.46. [DOI] [PMC free article] [PubMed] [Google Scholar]
- 31.Glaser SP, et al. Anti-apoptotic Mcl-1 is essential for the development and sustained growth of acute myeloid leukemia. Genes Dev. 2012;26:120–125. doi: 10.1101/gad.182980.111. [DOI] [PMC free article] [PubMed] [Google Scholar]
- 32.Shi J, et al. An IDH1 mutation inhibits growth of glioma cells via GSH depletion and ROS generation. Neurol Sci. 2014;35:839–845. doi: 10.1007/s10072-013-1607-2. [DOI] [PubMed] [Google Scholar]
- 33.Mohrenz IV, et al. Isocitrate dehydrogenase 1 mutant R132H sensitizes glioma cells to BCNU-induced oxidative stress and cell death. Apoptosis. 2013;18:1416–1425. doi: 10.1007/s10495-013-0877-8. [DOI] [PubMed] [Google Scholar]
- 34.Hockenbery DM, Oltvai ZN, Yin XM, Milliman CL, Korsmeyer SJ. Bcl-2 functions in an antioxidant pathway to prevent apoptosis. Cell. 1993;75:241–251. doi: 10.1016/0092-8674(93)80066-n. [DOI] [PubMed] [Google Scholar]
- 35.da Silva CG, et al. Inhibition of cytochrome c oxidase activity in rat cerebral cortex and human skeletal muscle by d-2-hydroxyglutaric acid in vitro. Biochim Biophys Acta. 2002;1586:81–91. doi: 10.1016/s0925-4439(01)00088-6. [DOI] [PubMed] [Google Scholar]
- 36.Latini A, et al. Mitochondrial energy metabolism is markedly impaired by d-2-hydroxyglutaric acid in rat tissues. Mol Genet Metab. 2005;86:188–199. doi: 10.1016/j.ymgme.2005.05.002. [DOI] [PubMed] [Google Scholar]
- 37.Wajne M, et al. D-2-Hydroxyglutaric aciduria in a patient with a severe clinical phenotype and unusual MRI findings. J Inherit Metab Dis. 2002;25:28–34. doi: 10.1023/a:1015165212965. [DOI] [PubMed] [Google Scholar]
- 38.Rohlena J, Dong LF, Neuzil J. Targeting the mitochondrial electron transport chain complexes for the induction of apoptosis and cancer treatment. Curr Pharm Biotechnol. 2013;14:377–389. doi: 10.2174/1389201011314030011. [DOI] [PubMed] [Google Scholar]
- 39.Rohlena J, Dong LF, Ralph SJ, Neuzil J. Anticancer drugs targeting the mitochondrial electron transport chain. Antioxid Redox Signal. 2011;15:2951–2974. doi: 10.1089/ars.2011.3990. [DOI] [PubMed] [Google Scholar]
- 40.Grassian AR, et al. IDH1 mutations alter citric acid cycle metabolism and increase dependence on oxidative mitochondrial metabolism. Cancer Res. 2014;74:3317–3331. doi: 10.1158/0008-5472.CAN-14-0772-T. [DOI] [PMC free article] [PubMed] [Google Scholar]
- 41.Choi C, et al. 2-hydroxyglutarate detection by magnetic resonance spectroscopy in IDH-mutated patients with gliomas. Nat Med. 2012;18:624–629. doi: 10.1038/nm.2682. [DOI] [PMC free article] [PubMed] [Google Scholar]
- 42.Kölker S, et al. NMDA receptor activation and respiratory chain complex V inhibition contribute to neurodegeneration in d-2-hydroxyglutaric aciduria. Eur J Neurosci. 2002;16:21–28. doi: 10.1046/j.1460-9568.2002.02055.x. [DOI] [PubMed] [Google Scholar]
- 43.Capaldi RA. Structure and function of cytochrome c oxidase. Annu Rev Biochem. 1990;59:569–596. doi: 10.1146/annurev.bi.59.070190.003033. [DOI] [PubMed] [Google Scholar]
- 44.Sherman D, Kotake S, Ishibe N, Copeland RA. Resolution of the electronic transitions of cytochrome c oxidase: evidence for two conformational states of ferrous cytochrome α. Proc Natl Acad Sci USA. 1991;88:4265–4269. doi: 10.1073/pnas.88.10.4265. [DOI] [PMC free article] [PubMed] [Google Scholar]
- 45.Nicholls P, Hildebrandt V. Binding of ligands and spectral shifts in cytochrome c oxidase. Biochem J. 1978;173:65–72. doi: 10.1042/bj1730065. [DOI] [PMC free article] [PubMed] [Google Scholar]
- 46.Yoshikawa S, Mochizuki M, Zhao XJ, Caughey WS. Effects of overall oxidation state on infrared spectra of heme a3 cyanide in bovine heart cytochrome c oxidase. Evidence of novel mechanistic roles for CuB J Biol Chem. 1995;270:4270–4279. doi: 10.1074/jbc.270.9.4270. [DOI] [PubMed] [Google Scholar]
- 47.Way JL. Cyanide intoxication and its mechanism of antagonism. Annu Rev Pharmacol Toxicol. 1984;24:451–481. doi: 10.1146/annurev.pa.24.040184.002315. [DOI] [PubMed] [Google Scholar]
- 48.Koivunen P, et al. Transformation by the (R)-enantiomer of 2-hydroxyglutarate linked to EGLN activation. Nature. 2012;483:484–488. doi: 10.1038/nature10898. [DOI] [PMC free article] [PubMed] [Google Scholar]
- 49.Li Y, Park JS, Deng JH, Bai Y. Cytochrome c oxidase subunit IV is essential for assembly and respiratory function of the enzyme complex. J Bioenerg Biomembr. 2006;38:283–291. doi: 10.1007/s10863-006-9052-z. [DOI] [PMC free article] [PubMed] [Google Scholar]
- 50.Skrtić M, et al. Inhibition of mitochondrial translation as a therapeutic strategy for human acute myeloid leukemia. Cancer Cell. 2011;20:674–688. doi: 10.1016/j.ccr.2011.10.015. [DOI] [PMC free article] [PubMed] [Google Scholar]
- 51.McClintock DS, et al. Bcl-2 family members and functional electron transport chain regulate oxygen deprivation-induced cell death. Mol Cell Biol. 2002;22:94–104. doi: 10.1128/MCB.22.1.94-104.2002. [DOI] [PMC free article] [PubMed] [Google Scholar]
- 52.Saikumar P, et al. Role of hypoxia-induced Bax translocation and cytochrome c release in reoxygenation injury. Oncogene. 1998;17:3401–3415. doi: 10.1038/sj.onc.1202590. [DOI] [PubMed] [Google Scholar]
- 53.Hetschko H, et al. BH3 mimetics reactivate autophagic cell death in anoxia-resistant malignant glioma cells. Neoplasia. 2008;10:873–885. doi: 10.1593/neo.07842. [DOI] [PMC free article] [PubMed] [Google Scholar]
- 54.Shimizu S, et al. Prevention of hypoxia-induced cell death by Bcl-2 and Bcl-xL. Nature. 1995;374:811–813. doi: 10.1038/374811a0. [DOI] [PubMed] [Google Scholar]
- 55.Shroff EH, Snyder C, Chandel NS. Role of Bcl-2 family members in anoxia induced cell death. Cell Cycle. 2007;6:807–809. doi: 10.4161/cc.6.7.4044. [DOI] [PubMed] [Google Scholar]
- 56.Silkjaer T, et al. Characterization and prognostic significance of mitochondrial DNA variations in acute myeloid leukemia. Eur J Haematol. 2013;90:385–396. doi: 10.1111/ejh.12090. [DOI] [PubMed] [Google Scholar]
- 57.Larman TC, et al. Spectrum of somatic mitochondrial mutations in five cancers. Proc Natl Acad Sci USA. 2012;109:14087–14091. doi: 10.1073/pnas.1211502109. [DOI] [PMC free article] [PubMed] [Google Scholar]
- 58.Vo TT, et al. Relative mitochondrial priming of myeloblasts and normal HSCs determines chemotherapeutic success in AML. Cell. 2012;151:344–355. doi: 10.1016/j.cell.2012.08.038. [DOI] [PMC free article] [PubMed] [Google Scholar]
- 59.Konopleva M, et al. Mechanisms of apoptosis sensitivity and resistance to the BH3 mimetic ABT-737 in acute myeloid leukemia. Cancer Cell. 2006;10:375–388. doi: 10.1016/j.ccr.2006.10.006. [DOI] [PubMed] [Google Scholar]
- 60.Lagadinou ED, et al. BCL-2 inhibition targets oxidative phosphorylation and selectively eradicates quiescent human leukemia stem cells. Cell Stem Cell. 2013;12:329–341. doi: 10.1016/j.stem.2012.12.013. [DOI] [PMC free article] [PubMed] [Google Scholar]
- 61.Xu Q, Thompson JE, Carroll M. mTOR regulates cell survival after etoposide treatment in primary AML cells Blood. 2005;106:4261–4268. doi: 10.1182/blood-2004-11-4468. [DOI] [PMC free article] [PubMed] [Google Scholar]
- 62.von Bonin M, et al. In vivo expansion of co-transplanted T cells impacts on tumor re-initiating activity of human acute myeloid leukemia in NSG mice. PLoS ONE. 2013;8:e60680. doi: 10.1371/journal.pone.0060680. [DOI] [PMC free article] [PubMed] [Google Scholar]
- 63.Ryan J, Letai A. BH3 profiling in whole cells by fluorimeter or FACS. Methods. 2013;61:156–164. doi: 10.1016/j.ymeth.2013.04.006. [DOI] [PMC free article] [PubMed] [Google Scholar]
- 64.Chen J, et al. The Bcl-2/Bcl-XL/Bcl-w inhibitor, navitoclax, enhances the activity of chemotherapeutic agents in vitro and in vivo. Mol Cancer Ther. 2011;10:2340–2349. doi: 10.1158/1535-7163.MCT-11-0415. [DOI] [PubMed] [Google Scholar]
- 65.Ward PS, et al. The common feature of leukemia-associated IDH1 and IDH2 mutations is a neomorphic enzyme activity converting α-ketoglutarate to 2-hydroxyglutarate. Cancer Cell. 2010;17:225–234. doi: 10.1016/j.ccr.2010.01.020. [DOI] [PMC free article] [PubMed] [Google Scholar]
Associated Data
This section collects any data citations, data availability statements, or supplementary materials included in this article.