Abstract
Faster peritoneal transport has been associated with an increased risk of therapy failure and patient mortality. However, faster transport can the result of many factors. Peritoneal protein clearance (PPC) has been proposed to distinguish faster peritoneal transport attributable to inflammatory conditions, as protein clearance reflects large-pore flow, which increases during inflammation. We followed a cohort of 300 peritoneal dialysis patients, and after adjustments for age and comorbidity, higher PPC was associated with increased risk of death (hazard ratio: 1.81; 95% confidence interval: 1.11 to 2.95), even after patients underwent transplantation or transferred to hemodialysis.
Keywords: Bioimpedance, survival, extracellular fluid, peritoneal protein loss, fast transporter
Early reports suggested that treatment failure and mortality are increased for peritoneal dialysis (PD) patients with faster peritoneal transport status (1). However, after the introduction of automated PD (APD) cyclers and icodextrin, subsequent studies reported no differences in patient outcomes (2) or hydration (3) with transport status.
Faster peritoneal transport status can be a result of increased vascular supply, which might be generalized or localized, and which has been reported to be associated with larger body size, comorbidity, local and systemic inflammation, and older age (4). Peritoneal protein clearance (PPC) has been proposed to distinguish faster transport that is a result of inflammatory conditions, because protein clearance is a measure of large-pore flow and depends predominantly on the number of large pores, which increases during inflammation (4). As such, PPC has been suggested to be a marker for increased vascular permeability and has been reported to be associated with increased mortality in PD patients in some, but not all, studies (5–7). In view of the discrepancies between those reports, we reviewed PPC in a cohort of patients starting PD.
Methods
This retrospective audit was performed according to the UK National Health Service audit and clinical service development guidelines.
The study enrolled 300 consecutive patients who attended for a peritoneal equilibration test (PET) and adequacy assessment 6 – weeks after training for PD. The PET used 2 L of 22.7 g/L dextrose solution (8,9), and dialysis adequacy was calculated by the standard Watson formulae using total body water (10). Dialysate bags were weighed before and after the PET, by regularly calibrated scales (MPPS-250: Marsden, Henley-on-Thames, UK). Height was measured using a standard wall-mounted measure (Sigmeas 1, Doherty signature range: Edward Doherty, Beverley, UK), and body surface area was estimated using the standard Du Bois and Du Bois formulae (11). A blood sample was taken at the midpoint of the dwell.
Effluent creatinine was measured using a kinetic enzymatic method to prevent glucose interference (P module analyzer: Roche Integra, Roche Diagnostics, Lewes, UK). Serum and dialysate sodium were measured using a two-point ion potentiometer, and albumin was measured by the bromcresol green method (P module analyzer). Serum total protein was measured by a modified biuret method (colorimetric assay based on divalent copper reacting in alkaline solution with protein peptide bonds to form a characteristic purple-colored biuret complex, measured by increased absorbance at 546 nm), and effluent protein was measured using pyrogallol red, which complexes with proteins in an acid environment containing molybdate ions (measured by absorbance at 600 nm). The latter method is linear up to 2.14 g/L (higher-concentration samples were diluted to bring them into range). Results are expressed as milliliters of plasma cleared daily (6).
The PPC was calculated by measuring the protein content in each of the drained effluent bags during a 24-hour collection. Blood pressure was recorded (Dinamap GE Pro 400: Critikon, Tampa, USA) in the supine position, after patients had rested before the start of the PET. Intracellular water, extracellular water (ECW), total body water (TBW), and body composition were measured using multi-frequency bioimpedance after the abdomen had been drained at the end of the PET (InBody 720: BioSpace, Seoul, Korea) in a standardized manner (12,13). For body composition, standard two-dimensional transthoracic echocardiograms (Philips IE33: Philips Medical Systems, Eindhoven, Netherlands) were reviewed (14). Left ventricular hypertrophy was classified as mild (left ventricular mass index of 96 – 108 g/m2 for women and 116 – 131 g/m2 for men), moderate (109 – 121 g/m2 for women and 132 – 148 g/m2 for men), or severe (≥122 g/m2 for women and ≥149 g/m2 for men). Comorbidity was assessed using the Davies score (15). No patient had experienced a peritonitis episode within the preceding 3 months.
Statistical Analysis
Results are expressed as mean ± standard deviation, median and interquartile range, or percentage. The analyses used the chi-square test with a Yates correction and the Student t-test for parametric data, and the Mann-Whitney U-test for nonparametric data. Simple correlation analysis was used to determine associates of PPC, with nonparametric variables being log-transformed when entered into a backward stepwise multiple regression model if p < 0.1 (and retained if significant and if confidence limits did not cross the line of unity), unless the variables improved the model fit. Survival analysis was then performed, initially by log-rank test, with censoring at study end. Cox proportional hazards analysis was used to model survival with multiple predictors. Variables were retained in the model when the 95% confidence intervals for the estimate did not include zero or when an improvement in model fit was observed (as demonstrated by the -2 log likelihood). The model was checked to ensure that it did not violate the proportional hazards assumption. Statistical analyses were performed using GraphPad Prism (version 6.0: GraphPad, San Diego, CA, USA), SPSS Statistics (version 17: SPSS, Chicago, IL, USA), and Stata (version 11: StataCorp LP, College Station, TX, USA) software. Statistical significance was accepted at or below the 5% level.
Results
We reviewed the records of 300 consecutive adult patients [median age at PD start: 57.0 years (range: 44 – 66 years); 47.7% men; 29.0% with diabetes; and 56.3% white]. Before starting PD, 12% had experienced a myocardial infarction; 6.7%, coronary artery bypass surgery; 10.7%, coronary artery stenting; 7.0%, transient ischemic attack or stroke; and 4%, congestive cardiac failure. Antihypertensives had been prescribed to 68.4% [median: 1 (range: 0 – 2)]—most commonly, calcium channel blockers (29%), followed by beta-blockers (28%), angiotensin II receptor blockers (27.3%), and angiotensin converting-enzyme inhibitors (24.3%). Diuretics were prescribed to 73.3% of patients, and statins, to 62.1%.
Continuous ambulatory PD (CAPD) was started by patient choice in 28.7% of the cohort; the rest were started on automated cyclers (APD), with 18% on the cycler overnight with no daytime exchange, and the remainder using a daytime exchange. During a median follow-up of 62 months (range: 29.3 – 86 months) censored at 31 December 2012, 24% of patients died. Median duration of PD was 28 months (range: 15.3 – 50 months), with 37.3% of patients undergoing transplantation, and 30.3% transferring to hemodialysis.
Median daily PPC was 78.8 mL (interquartile range: 53.7 – 105.3 mL). Because mortality appeared to increase in patients with a PPC above the 75th centile, patients were divided into groups with daily values below and above that threshold, termed “low PPC” (range: 4.2 – 104.9 mL) and “high PPC” (range: 105.3 – 284.1 mL). Patients with a high PPC were more likely to be male, heavier, with a greater ECW/TBW ratio, and using the CAPD modality (Table 1). At 3 mg/L (range: 1 – 7 mg/L) compared with 4 mg/L (2 – 12 mg/L), C-reactive protein was not statistically higher in the high PPC group. Furthermore, diabetes, Davies comorbidity score, cardiac history, blood pressure, antihypertensive medication, and echocardiography findings were not different between the groups.
TABLE 1.
Characteristicsa of the Study Patients by Peritoneal Protein Clearance Group
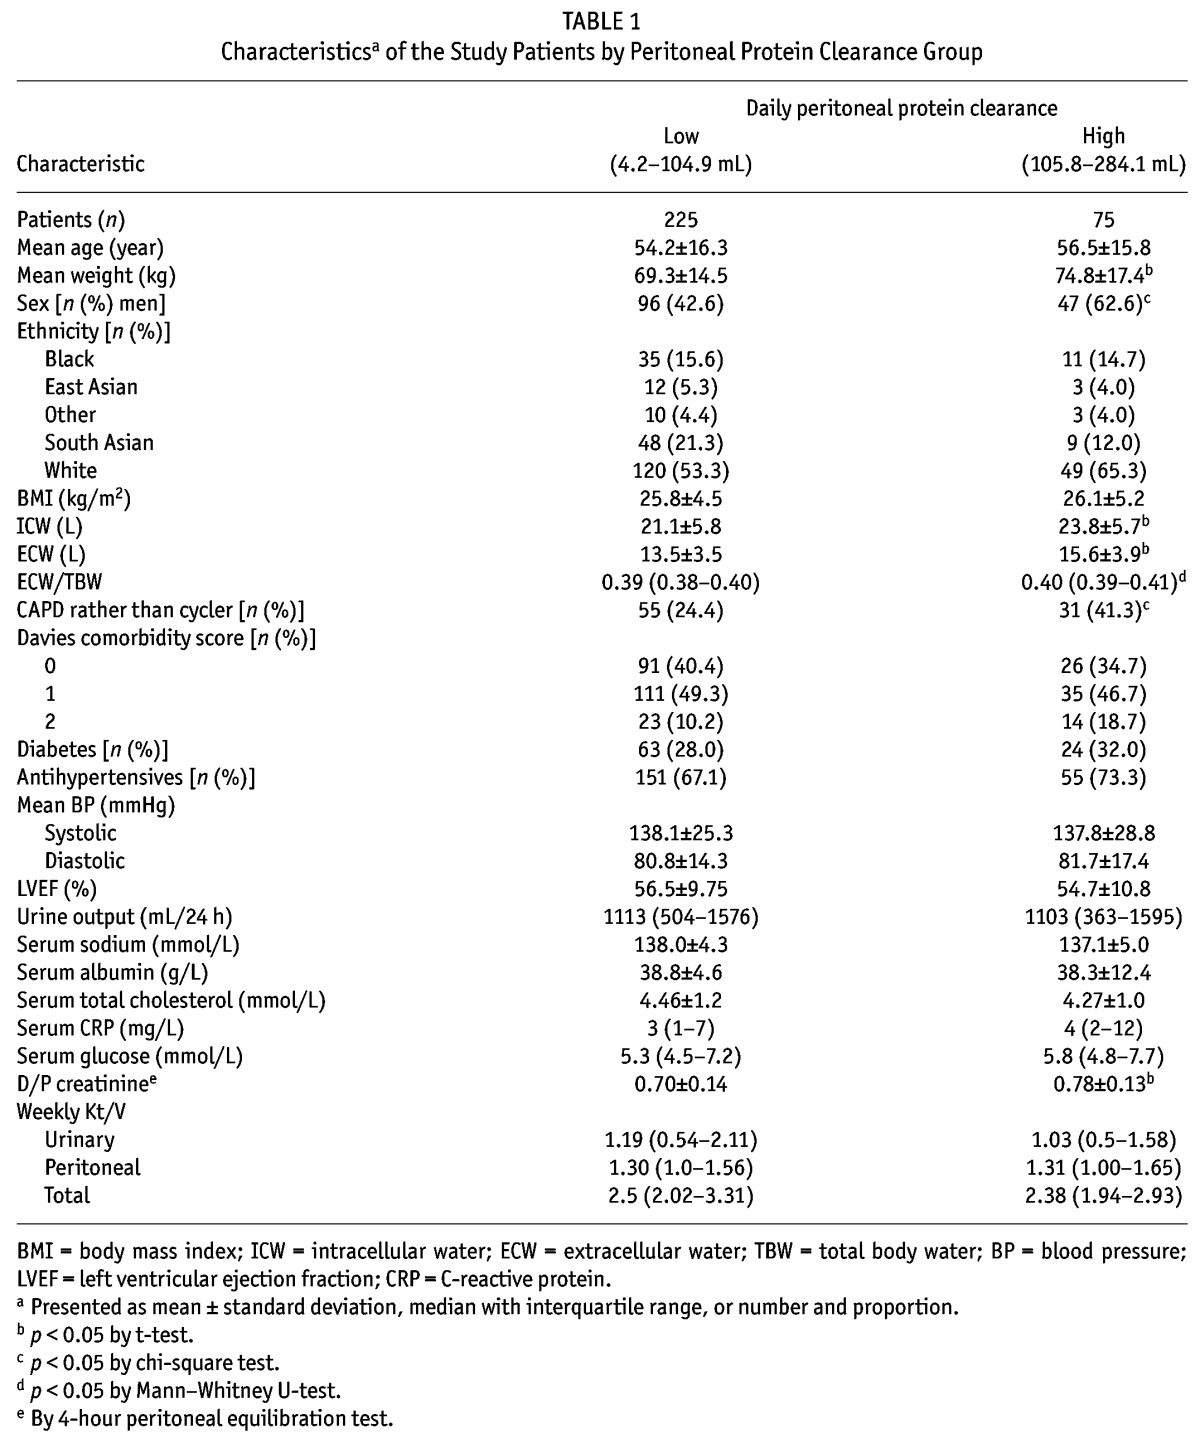
On follow-up, transfer to transplantation (39% vs 32%) was similar, but transfer to hemodialysis (25.3% vs 45.3%) was higher in the high PPC group (p = 0.001). Risk of death was substantially lower for patients in the low PPC group (log-rank p = 0.010), with median survival for the low PPC group being 182 months compared with 113 months for the high PPC group.
Peritoneal protein clearance depended on peritoneal transport status, ECW, and peritoneal creatinine clearance (Tables 2 and 3). A Cox proportional hazards analysis was performed to determine whether PPC was independently associated with risk of death (Table 4). As expected, age and Davies comorbidity score were inversely associated with survival, as was the ECW/TBW ratio; however, the association between high PPC and risk of death (hazard ratio: 1.81; 95% confidence interval: 1.11 to 2.95) remained after adjustment (Table 5). Figure 1 illustrates the relationship between PPC group, ECW/TBW ratio, and survival. After adjustment for serum albumin, C-reactive protein, and transfer to hemodialysis, high PPC remained a predictor of the risk of death in sensitivity analyses (data not shown).
TABLE 2.
Variables Associated with Peritoneal Total Protein Clearance by Spearman Univariate Correlation Analysis
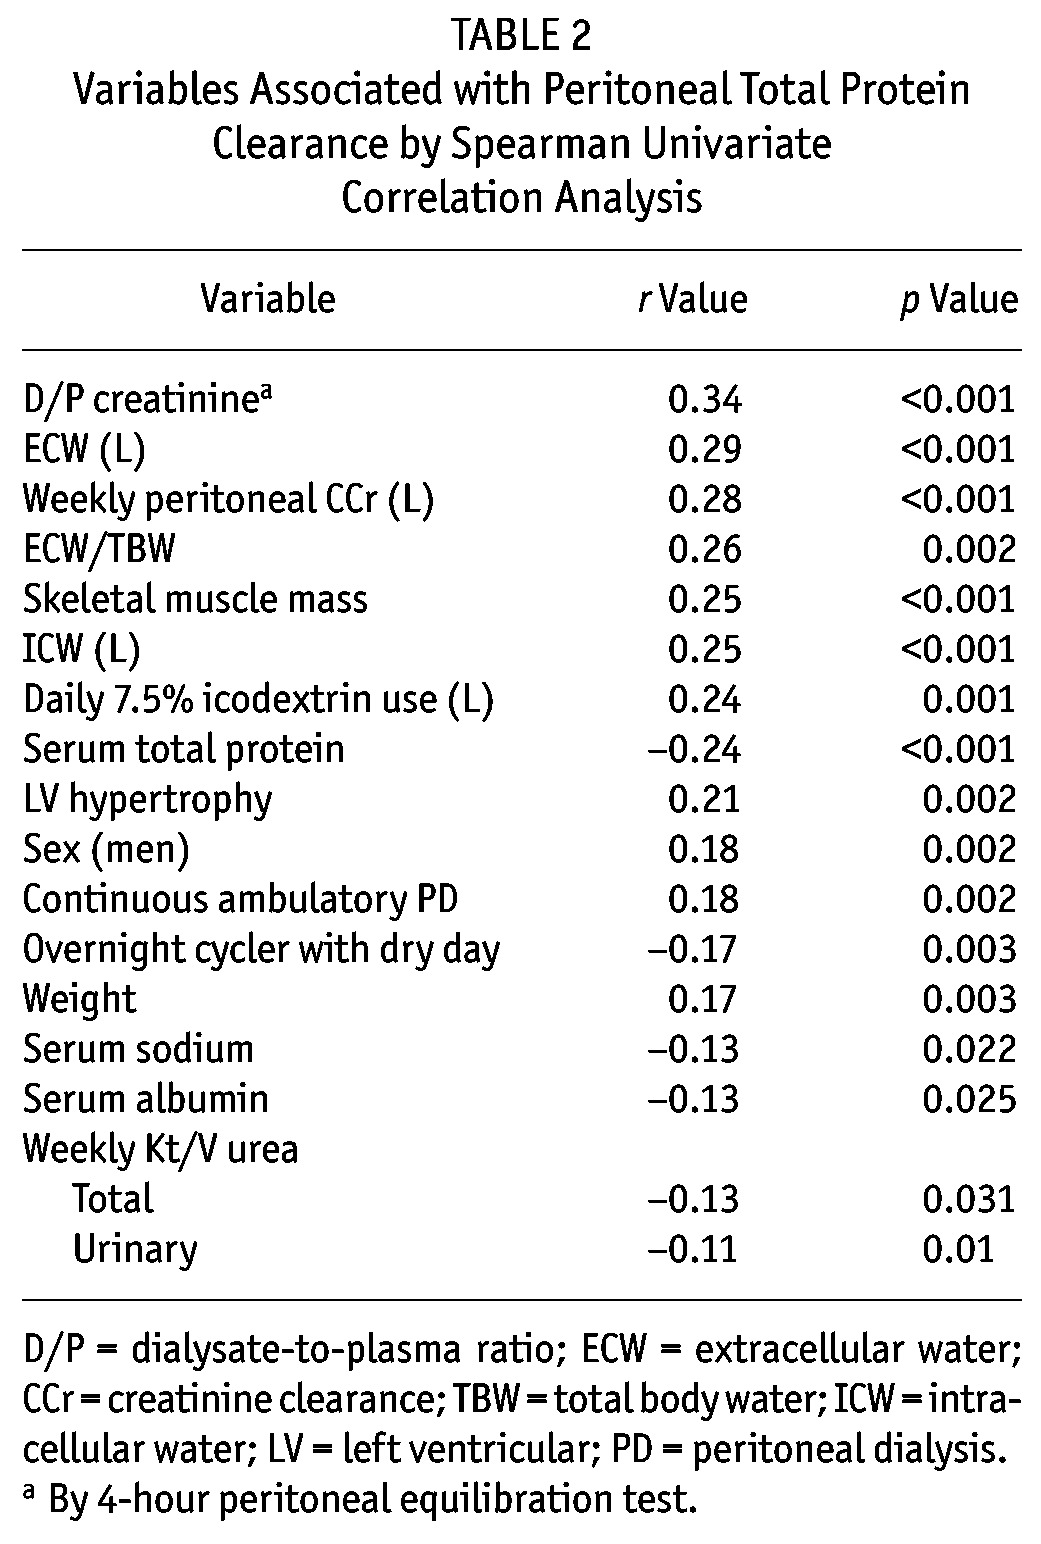
TABLE 3.
Backward Stepwise Regression Modela for Peritoneal Protein Clearance

TABLE 4.
Cox Proportional Hazards Model for Death
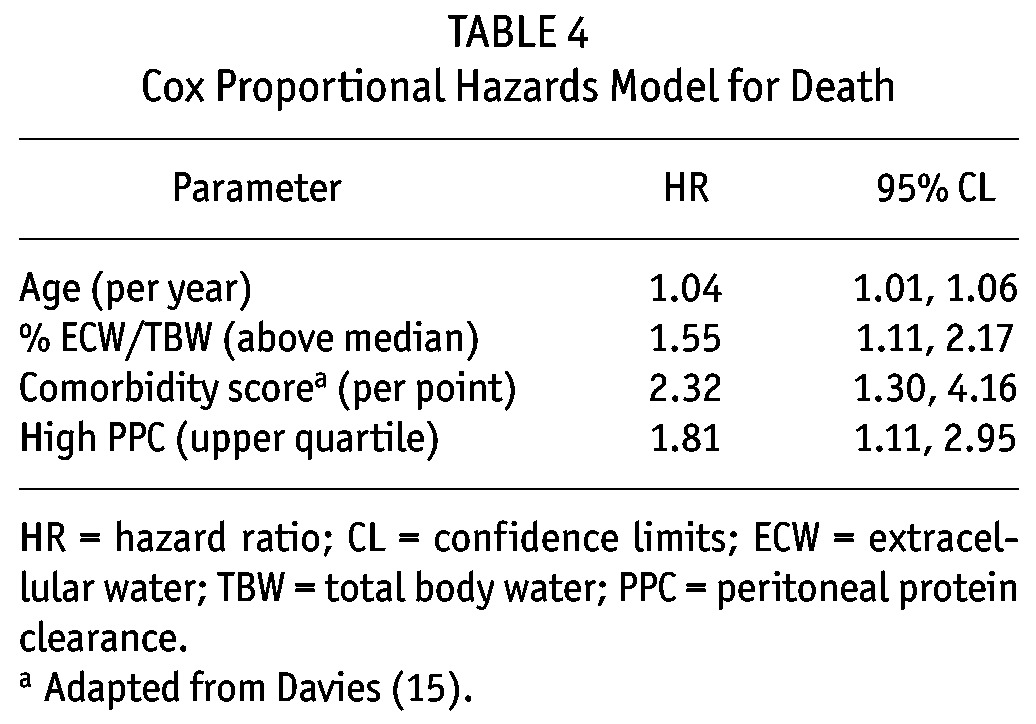
TABLE 5.
Univariate Hazard Ratios (HRs) for Patient Mortality
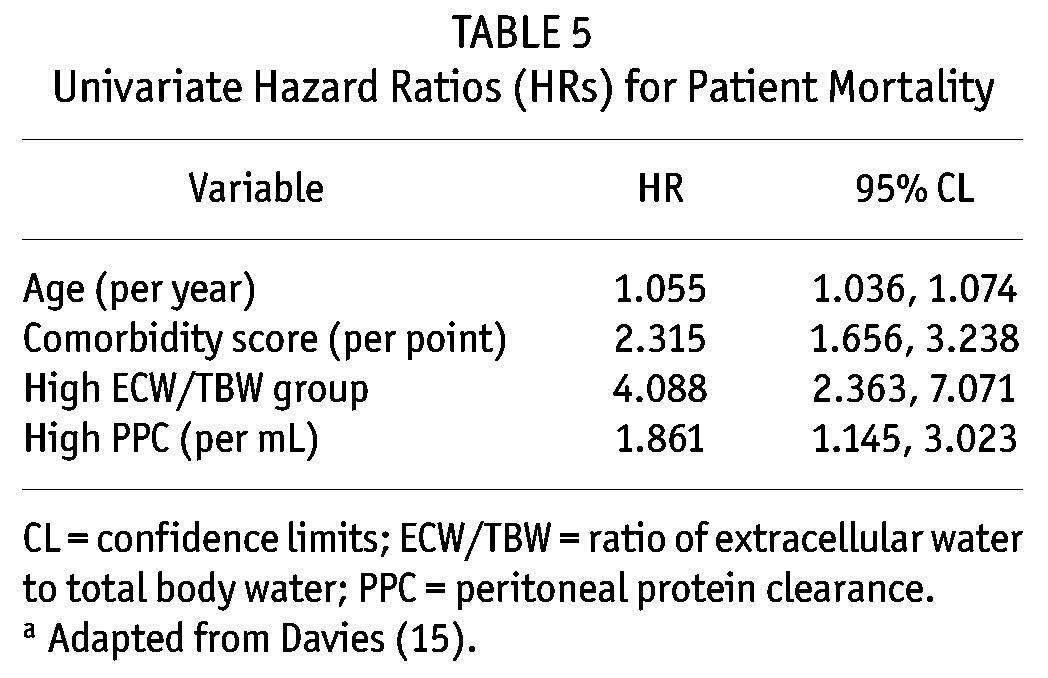
Figure 1 —
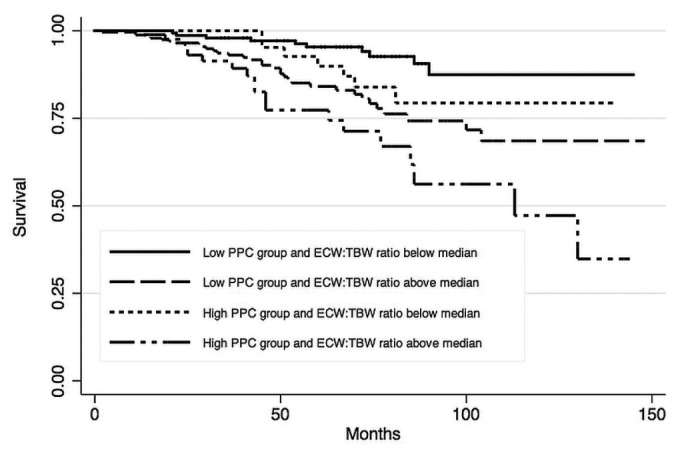
Kaplan-Meir survival estimates for the study patients, by peritoneal protein clearance (PPC) and extracellular water-to-total body water ratio (ECW/TBW). Adjusted to age 57 and a Davies comorbidity score (15) of zero.
Discussion
We hypothesized that, if PPC is a marker of general vascular permeability, then patients would have an inflammatory milieu regardless of whether their renal replacement modality changed over time. Therefore, compared with other studies (6,7,16), we did not censor patients who changed modality. We observed that patients with a high PPC had greater mortality risk, supporting earlier reports that increased PPC is associated with reduced survival (6,16). Patients with a higher PPC were predominantly male and using CAPD, but PPC was not affected by diabetes or racial origin. Given that PPC depends on peritoneal surface area and that men are typically larger than women, they are reported to have increased PPC (4). Peritoneal protein transport is time-dependent, and we confirmed that clearance was increased with the longer dwell times of CAPD compared with those of overnight APD with a dry day; however, there was no difference between CAPD and APD once a daytime dwell had been introduced. Similarly, PPC increased with peritoneal creatinine clearance.
In theory, raised intravascular hydrostatic pressure could increase PPC, and some studies reported an association with pulse pressure (6), but we did not find any effect of blood pressure, antihypertensive medications, or severity of left ventricular hypertrophy. On multivariable analysis, mortality was associated with older age and increasing comorbidity. High PPC was also independently associated with risk of death and was independent of albumin and C-reactive protein. Those observations would suggest that PPC is not simply a surrogate measure of acute systemic inflammation.
Increasing ECW/TBW ratio was also significantly associated with mortality. The ECW/TBW ratio can increase either because of an absolute increase in ECW, with increased plasma or increased interstitial volume, or possibly because of a normal or even reduced effective plasma volume but increased interstitial volume resulting from increased local vascular permeability. The latter hypothesis is supported by reports that, despite an increased ECW/TBW ratio, patients have reduced urine output (17) and do not have increased ultrafiltration during a PET (18,19). An increased ECW/TBW ratio resulting from local inflammation would support the association with increased PPC.
Peritoneal protein clearance depends on large-pore transport and, as such, has been reported to differentiate faster peritoneal transport secondary to increased peritoneal and capillary surface area from faster transport resulting from increased capillary permeability secondary to an inflammatory state (4). Our study shows that high PPC—together with increasing age, comorbidity, and ECW/TBW ratio—is associated with an increased risk of mortality. The mortality risk for patients in the highest quartile of PPC was similar to that in patients with a higher ECW/TBW ratio, and whereas PD centers check adequacy and transport status in patients, not all centers have access to bioimpedance. Measurement of PPC is relatively straightforward in routine clinical practice and could allow for future prospective interventional studies targeting patients at increased risk of mortality.
Disclosures
The authors have no financial conflicts of interest to declare.
REFERENCES
- 1. Brimble KS, Walker M, Margetts PJ, Kundhal KK, Rabbat CG. Meta-analysis: peritoneal membrane transport, mortality, and technique failure in peritoneal dialysis. J Am Soc Nephrol 2006; 17:2591–8. [DOI] [PubMed] [Google Scholar]
- 2. Johnson DW, Hawley CM, McDonald SP, Brown FG, Rosman JB, Wiggins KJ, et al. Superior survival of high transporters treated with automated versus continuous ambulatory peritoneal dialysis. Nephrol Dial Transplant 2010; 25:1973–9. [DOI] [PubMed] [Google Scholar]
- 3. Davenport A, Willicombe MK. Comparison of fluid status in patients treated by different modalities of peritoneal dialysis using multi-frequency bioimpedance. Int J Artif Organs 2009; 32:779–86. [DOI] [PubMed] [Google Scholar]
- 4. Heaf JG. Peritoneal transport: getting more complicated. Nephrol Dial Transplant 2012; 27:4248–51. [DOI] [PMC free article] [PubMed] [Google Scholar]
- 5. Heaf JG, Sarac S, Afzal S. A high peritoneal large pore fluid flux causes hypoalbuminaemia and is a risk factor for death in peritoneal dialysis patients. Nephrol Dial Transplant 2005; 20:2194–201. [DOI] [PubMed] [Google Scholar]
- 6. Perl J, Huckvale K, Chellar M, John B, Davies SJ. Peritoneal protein clearance and not peritoneal membrane transport status predicts survival in a contemporary cohort of peritoneal dialysis patients. Clin J Am Soc Nephrol 2009; 4:1201–6. [DOI] [PMC free article] [PubMed] [Google Scholar]
- 7. Balafa O, Halbesma N, Struijk DG, Dekker FW, Krediet RT. Peritoneal albumin and protein losses do not predict outcome in peritoneal dialysis patients. Clin J Am Soc Nephrol 2011; 6:561–6. [DOI] [PMC free article] [PubMed] [Google Scholar]
- 8. Twardowski ZJ, Nolph KD, Khanna R, Prowant BF, Ryan LP, Moore HL, et al. Peritoneal equilibration test. Perit Dial Bull 1987; 7:138–47. [Google Scholar]
- 9. Twardowski ZJ. PET—a simpler approach for determining prescriptions for adequate dialysis therapy. Adv Perit Dial 1990; 6:186–91. [PubMed] [Google Scholar]
- 10. Watson PE, Watson ID, Batt RD. Total body water volumes for adult males and females estimated from simple anthropometric measurements. Am J Clin Nutr 1980; 33:27–39. [DOI] [PubMed] [Google Scholar]
- 11. Du Bois D, Du Bois EF. A formula to estimate the approximate surface area if height and weight be known. Arch Intern Med 1916; 17:863–71. [PubMed] [Google Scholar]
- 12. Papakrivopoulou E, Booth J, Pinney J, Davenport A. Comparison of volume status in asymptomatic haemodialysis and peritoneal dialysis outpatients. Nephron Extra 2012; 2:48–54. [DOI] [PMC free article] [PubMed] [Google Scholar]
- 13. Davenport A, Willicombe M. Comparison of fluid status in patients treated by different modalities of peritoneal dialysis using multi-frequency bioimpedance. Int J Artif Organs 2009; 32:779–86. [DOI] [PubMed] [Google Scholar]
- 14. Davenport A. Changes in N-terminal pro-brain natriuretic peptide correlate with fluid volume changes assessed by bioimpedance in peritoneal dialysis patients. Am J Nephrol 2012; 36:371–6. [DOI] [PubMed] [Google Scholar]
- 15. Davies SJ. Assessment of comorbidity in peritoneal dialysis patients. Contrib Nephrol 2003;:98–103. [DOI] [PubMed] [Google Scholar]
- 16. Pérez-Fontán M, Rodríguez-Carmona A, Barreda D, López-Muñiz A, Blanco-Castro N, García-Falcón T. Peritoneal protein transport during the baseline peritoneal equilibration test is an accurate predictor of the outcome of peritoneal dialysis patients. Nephron Clin Pract 2010; 116:c104–13. [DOI] [PubMed] [Google Scholar]
- 17. Davenport A, Sayed RH, Fan S. Is extracellular volume expansion of peritoneal dialysis patients associated with greater urine output? Blood Purif 2011; 32:226–31. [DOI] [PubMed] [Google Scholar]
- 18. Davenport A, Willicombe MK. Hydration status does not influence peritoneal equilibration test ultrafiltration volumes. Clin J Am Soc Nephrol 2009; 4:1207–12. [DOI] [PMC free article] [PubMed] [Google Scholar]
- 19. Papakrivopoulou E, Lillywhite S, Davenport A. Is N-terminal probrain-type natriuretic peptide a clinically useful biomarker of volume overload in peritoneal dialysis patients? Nephrol Dial Transplant 2012; 27:396–401. [DOI] [PubMed] [Google Scholar]


