

Abstract
The malate–aspartate shuttle is indispensable for the net transfer of cytosolic NADH into mitochondria to maintain a high rate of glycolysis and to support rapid tumor cell growth. The malate–aspartate shuttle is operated by two pairs of enzymes that localize to the mitochondria and cytoplasm, glutamate oxaloacetate transaminases (GOT), and malate dehydrogenases (MDH). Here, we show that mitochondrial GOT2 is acetylated and that deacetylation depends on mitochondrial SIRT3. We have identified that acetylation occurs at three lysine residues, K159, K185, and K404 (3K), and enhances the association between GOT2 and MDH2. The GOT2 acetylation at these three residues promotes the net transfer of cytosolic NADH into mitochondria and changes the mitochondrial NADH/NAD+ redox state to support ATP production. Additionally, GOT2 3K acetylation stimulates NADPH production to suppress ROS and to protect cells from oxidative damage. Moreover, GOT2 3K acetylation promotes pancreatic cell proliferation and tumor growth in vivo. Finally, we show that GOT2 K159 acetylation is increased in human pancreatic tumors, which correlates with reduced SIRT3 expression. Our study uncovers a previously unknown mechanism by which GOT2 acetylation stimulates the malate–aspartate NADH shuttle activity and oxidative protection.
Keywords: acetylation, GOT2, malate–aspartate NADH shuttle, pancreatic cancer
Introduction
The glycolytic pathway is of great importance for energy production in the cell. During the breakdown of glucose to pyruvate, the coenzyme NAD+ (nicotinamide adenine dinucleotide, oxidized form) is reduced to NADH, and rapid oxidation of NADH to regenerate NAD+ is equally important for the cell to ensure glycolysis to proceed. Oxidation of cytosolic NADH can be achieved by anaerobic respiration that drives the reduction of pyruvate to lactate, or by aerobic respiration and the transfer of electrons via the mitochondrial electron transport chain (ETC). However, the transfer of NADH into mitochondria is hindered by the impermeability of the inner mitochondrial membrane to NADH (Lehninger, 1951). Therefore, the malate–aspartate shuttle plays an important role in transferring reducing equivalents across the mitochondrial membrane for energy production. Supporting this notion, the malate–aspartate shuttle has been shown to be the major way for the net transfer of cytosolic NADH into mitochondria in rat heart and liver (Williamson et al, 1970, 1971; Safer et al, 1971). Moreover, the malate–aspartate shuttle has been reported to oxidize 20–80% of cytosolic NADH in Ehrlich ascites tumor cells, Krebs II carcinoma, AS-30D carcinoma and L1210 cells (Dionisi et al, 1974; Greenhouse & Lehninger, 1977).
The malate–aspartate shuttle is operated by two pairs of enzymes, mitochondrially and cytoplasmically localized glutamate oxaloacetate transaminases (GOT) and malate dehydrogenases (MDH), which act in concert to transfer reducing equivalents across the mitochondrial membrane, with no net movement of carbon or nitrogen (Barron et al, 1998). As shown in Fig1A, cytoplasmic MDH1 reduces oxaloacetate (OAA) to malate while oxidizing NADH to NAD+. Malate is then transported to the interior of the mitochondrion in exchange for α-ketoglutarate (α-KG). Inside the mitochondrion, malate is oxidized once again to OAA by mitochondrial MDH2, giving rise to NADH which enters the ETC to produce ATP. In return, mitochondrial GOT2 converts OAA inside the mitochondrion to aspartate by transamination, with the amino group being donated by glutamate, giving rise to α-KG. Aspartate and α-KG then enter the cytosol, wherein aspartate is converted to OAA, while α-KG is converted to glutamate mediated by GOT1. Earlier studies have suggested that GOT may interact with MDH in both the cytosol and the mitochondrion (Backman & Johansson, 1976). Moreover, it has been proposed that GOT and MDH may form some substrate channelling for the transit of OAA in cells (Bryce et al, 1976; Arrio-Dupont et al, 1985). This may explain the absence of high OAA accumulation in rat liver cells (Williamson et al, 1969; Parrilla et al, 1975; Siess et al, 1977). However, very little is known about the formation of the GOT-MDH complex in response to metabolic changes and about the physiological significance of such a regulation.
Figure 1.

- A Cartoon representation of the malate–aspartate shuttle. As shown, this shuttle is operated by two pairs of enzymes, cytosolic GOT1 and MDH1 as well as mitochondrial GOT2 and MDH2, which act in concert to transfer reducing equivalents across the mitochondrial membrane.
- B,C GOT2 can be acetylated. Flag-tagged GOT2 was ectopically expressed in HEK293T cells treated with NAM (5 mM) and/or TSA (0.5 mM) for the indicated time period. Acetylation levels of Flag-bead-purified GOT2 were determined by Western blot analysis using a pan-anti-acetyllysine antibody (α-Ac). IB and IP denote immunoblotting and immunoprecipitation, respectively. Relative GOT2 acetylation ratios were calculated after normalizing against Flag.
- D GOT2 acetylation enhances the interaction between ectopically expressed GOT2 and MDH2. Flag-GOT2 and Myc-MDH2 were co-overexpressed in HEK293T cells treated without or with NAM (5 mM) for the indicated time period. The acetylation level of Flag-bead-purified GOT2 and the protein association between ectopic proteins of GOT2 and MDH2 were determined by Western blot analysis.
- E Acetylation enhances the interaction between ectopically expressed GOT2 and endogenous MDH2. Flag-GOT2 was co-overexpressed in HEK293T cells treated without or with NAM (5 mM) for the indicated time period. The acetylation level of Flag-GOT2 and its association with endogenous MDH2 were determined by Western blot analysis.
- F Acetylation enhances the interaction between ectopically expressed MDH2 and endogenous GOT2. Flag-MDH2 was co-overexpressed in HEK293T cells treated without or with NAM (5 mM) for the indicated time period. The protein association between Flag-MDH2 and endogenous GOT2 was determined by Western blot analysis.
- G Cartoon representation of GOT2 structure (PDB ID: 3PDB) (Han et al 2011) made by Pymol (www.pymol.org). Three putative lysine residues (i.e., K159, K185, and K404) were labeled in red. See also Supplementary Fig S3.
- H Mapping the major lysine residue(s) of acetylation in GOT2 whose acetylation can affect protein interaction between GOT2 and MDH2. Putative acetylated residues were divided into six groups according to their position in the structure of GOT2. Each group of putative acetylated lysine (K) sites was mutated to arginine (R), and the deacetylated mimic K-to-R mutants were examined for their protein association with ectopically expressed Myc-MDH2 by Western blot analysis.
- I GOT2 coupled with MDH2 shows a high level of K159 acetylation. Flag-GOT2 was overexpressed in HEK293T cells without or with co-overexpression of Myc-MDH2. These transfected cells were treated with NAM (5 mM) for 5 h. Double immunoprecipitation was performed to obtain the Flag-GOT2 from the Myc-MDH2 immunoprecipitates (Ppt, supposed to be GOT2 bound with MDH2). The remaining supernatants (Sup, supposed to be GOT2 not bound with MDH2) were also harvested and precipitated by Flag antibody to test the K159 acetylation level of Flag-GOT2 by Western blot analysis.
- J The 3KQ/R mutations do not change GOT2 enzyme activity. Wild-type and 3K mutant GOT2 proteins were overexpressed and purified from E. coli, and the enzyme activity of GOT2 was determined as described in “Materials and Methods”. Shown are average values with standard deviation (SD) of triplicated experiments. n.s. = not significant for the indicated comparison.
We and others have previously discovered that lysine acetylation is an evolutionarily conserved post-translational modification in the regulation of a wide range of cellular processes, particularly in nuclear transcription and cytoplasmic metabolism (Kim et al, 2006; Choudhary et al, 2009; Zhao et al, 2010). To date, more than 4,500 acetylated proteins have been identified (Lundby et al, 2012). Among these acetylated proteins is MDH2, in which as many as four lysine residues are acetylated, and acetylation has been shown to activate MDH2 (Zhao et al, 2010). The other mitochondrial component of the malate–aspartate shuttle, GOT2, is also acetylated (Choudhary et al, 2009; Zhao et al, 2010). In this report, we investigated GOT2 acetylation and its functional significance in controlling the malate–aspartate shuttle activity in the cell.
Results
Acetylation of GOT2 at K159, K185 and K404 enhances its binding with MDH2
Previous proteomic analyses based on mass spectrometry have identified a large number of acetylated proteins, including GOT2 (Choudhary et al, 2009; Zhao et al, 2010). To confirm this, we transfected Flag-GOT2 into HEK293T cells and examined the acetylation of GOT2 by Western blotting using a pan-anti-acetyllysine antibody. We found that GOT2 was indeed acetylated and its acetylation was enhanced by approximately 2.5-fold after 4 h of treatment with nicotinamide (NAM), an inhibitor of the SIRT family deacetylases (Bitterman et al, 2002; Avalos et al, 2005) (Fig1B). Treatment with Trichostatin A (TSA), an inhibitor of histone deacetylase HDAC I and II (Furumai et al, 2001), did not substantially affect GOT2 acetylation (Fig1B), and additional treatment with TSA did not further change the acetylation level of GOT2 in cells co-treated with NAM (Fig1C). These results indicate that GOT2 is acetylated and is regulated by a member of the SIRT family of deacetylases.
A previous study has shown that GOT may interact with MDH both in the cytosol and in the mitochondrion (Backman & Johansson, 1976). We thus tested the protein association between ectopically expressed Flag-GOT2 and Myc-MDH2 in HEK293T cells. We found the protein interaction between Flag-GOT2 and Myc-MDH2 was extremely weak, hardly to be detected (Fig1D). Notably, the GOT2–MDH2 association was substantially enhanced by NAM treatment (Fig1D). Likewise, the association of Flag-GOT2 with endogenous MDH2 and that of Flag-MDH2 with endogenous GOT2 were hardly detectable in HEK293T, but were greatly enhanced by NAM treatment (Fig1E and F). These results suggest that GOT2–MDH2 association is promoted by acetylation and negatively regulated by a SIRT-mediated deacetylation.
As noted in the introduction, we have previously identified four major regulatory sites targeted by acetylation in MDH2, including K185, K301, K307, and K314 (4K) (Zhao et al, 2010). When Flag-tagged wild-type and the acetylation-deficient 4KR mutant MDH2 were overexpressed in HEK293T cells, we found that both wild-type and 4KR mutant MDH2 hardly interacted with endogenous GOT2 (Supplementary Fig S1). Interestingly, the 4KR mutant MDH2 displayed negligible response in changing acetylation level after NAM treatment, but still exhibited enhanced protein interaction with endogenous GOT2 (Supplementary Fig S1), suggesting that the observed effect of NAM on promoting GOT2–MDH2 association is most likely accomplished by increasing the acetylation of GOT2, but not MDH2.
Given that GOT2 is a conserved protein among the species of Homo sapiens, Mus musculus, Xenopus tropicalis, and Danio rerio (Supplementary Fig S2), we speculated that important regulatory sites targeted by acetylation might also be conserved. Sequence alignments from diverse species revealed that the 14 putative acetylated lysine residues are invariant (Supplementary Fig S2) (Choudhary et al, 2009). To determine which lysine residue(s) plays a major role in the regulation of GOT2 and/or its association with MDH2, we divided these 14 putative acetylated residues into six groups according to their position in the structure of GOT2 (Fig1G; Supplementary Fig S3A–E). We mutated each group of putative acetylated lysine (K) sites to arginine (R) or glutamine (Q) and examined the protein association of each group of GOT2 mutants with ectopically expressed Myc-MDH2. The K-to-R mutation retains a positive charge and is often used as a deacetylated mimic, whereas the K-to-Q mutation abolishes the positive charge and may act as a surrogate of acetylation (Megee et al, 1990). In agreement with our earlier finding in Fig1D, the interaction between wild-type GOT2 and MDH2 was significantly enhanced by 5 h of NAM treatment (Fig1H). Strikingly, simultaneous mutation of three putative acetylation lysine residues, K159, K185, and K404, to similarly positively charged arginine (3KR) in GOT2 disrupted its binding with MDH2 in cells even after NAM treatment (Fig1H). The association with MDH2 was not or only mildly affected by single or double K-to-R mutation targeting K159, K185, or K404 in the GOT2 protein (Supplementary Fig S4A and B).
To provide further evidence supporting the role of acetylation in promoting GOT2–MDH2 association, we generated an antibody specifically recognizing the K159-acetylated GOT2 [α-acGOT2(K159)] (Supplementary Fig S5A–C). We then transfected HEK293T cells either singularly with plasmid expressing Flag-GOT2 or both Flag-GOT2 and Myc-MDH2 plasmids. Transfected cells were treated with SIRT inhibitor NAM for 5 h prior to lysis to increase acetylated GOT2. Lysates from both cells were subjected to double immunoprecipitations, first with the Myc antibody and then with the Flag antibody in supernatants depleted by the Myc antibody. We found that Flag-GOT2 was detected in Myc precipitates from Flag-GOT2 and Myc-MDH2 co-transfected cells (top panel, lane 2, Fig1I), but not in cells transfected with Flag-GOT2 alone (top panel, lane 1), demonstrating the specificity of GOT2–MDH2 association. Importantly, K159-acetylated GOT2 was readily detected in Myc precipitates from Flag-GOT2 and Myc-MDH2 co-transfected cells, but was not seen in supernatants of the same cell lysate after Myc depletion. This result indicates that nearly all K159-acetylated GOT2 is in the complex with MDH2.
To determine whether acetylation of these three sites (K159, K185, and K404) would affect the enzyme activity of GOT2, we employed an expression system genetically encoding Nε-acetyllysine to prepare recombinant K159-acetylated GOT2 protein in E. coli (Neumann et al, 2008, 2009), which produced recombinant protein with complete acetylation at the targeted lysine residue. Using the α-acGOT2(K159) antibody, we verified the incorporation of acetyllysine at K159 (Supplementary Fig S5D). By monitoring the production of glutamate, we found that the purified GOT2K159ac displayed identical enzyme activity as compared to wild-type proteins (Supplementary Fig S5D). We then ectopically expressed and purified from E. coli both 3KR and 3KQ mutant GOT2 proteins and examined their enzymatic activity. We found that 3K mutations did not change GOT2 enzyme activity (Fig1J). Taken together, these results suggest that GOT2 3K acetylation can enhance the protein association between GOT2 and MDH2 without affecting GOT2 enzyme activity.
Glucose and glutamine promote GOT2 acetylation and GOT2–MDH2 association
Both glucose and glutamine are the major carbon and energy sources for cultured mammalian cells. When Panc-1 cells were treated with high glucose or glutamine, we observed a significant increase in the mitochondrial NADH level (Supplementary Fig S6A and B). This raises the possibility that glucose or glutamine may affect the activity of the malate–aspartate shuttle activity, thereby influencing the net transfer of cytosolic NADH into mitochondria. Supporting this notion, a previous study has shown that the activity of the malate–aspartate shuttle in the rat heart was greatly elevated by glutamate, the deaminated product of glutamine (Digerness & Reddy, 1976). Moreover, a recent study has reported that inhibition of the malate–aspartate shuttle by aminooxyacetate (AOA) can hinder the effect of high glucose on increasing mitochondrial NADH (Zhao et al, 2011). These findings suggest that the malate–aspartate NADH shuttle may act as a sensor of energy status that maintains cellular energy homeostasis.
We next set out to investigate whether acetylation of GOT2 at 3K is involved in the regulation of the malate–aspartate shuttle activity in cells exposed to high glucose and glutamine. In HEK293T cells transiently co-overexpressing Flag-GOT2 and Myc-MDH2, we found that glucose increased the K159 acetylation level of Flag-GOT2 in a dose-dependent manner and that the increased K159 acetylation of GOT2 was in parallel with enhanced GOT2–MDH2 association after glucose treatment (Fig2A). Likewise, high glutamine increased the K159 acetylation level of Flag-GOT2 in a dose-dependent manner (Fig2B), and again, the increased K159 acetylation of GOT2 was associated with enhanced GOT2–MDH2 interaction after glutamine treatment (Fig2B). These results suggest that GOT2 3K acetylation can regulate the malate–aspartate shuttle activity through modulating GOT2–MDH2 association under physiological conditions.
Figure 2.
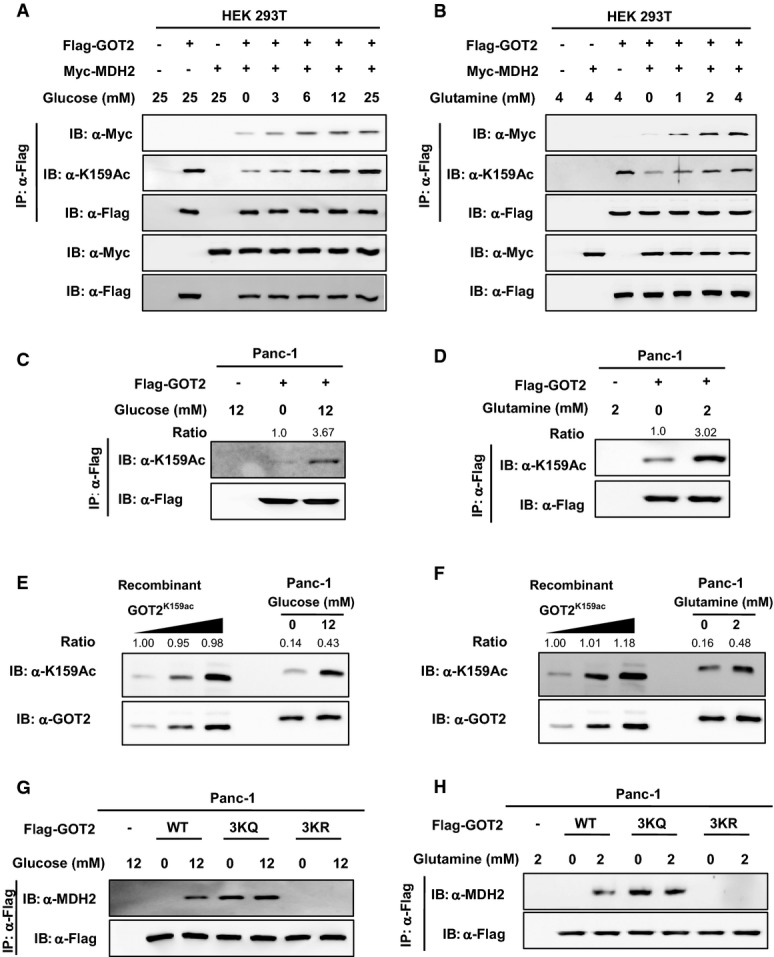
- A,B Glucose and glutamine increase GOT2 K159 acetylation and GOT2–MDH2 association in HEK293T cells. Flag-GOT2 and Myc-MDH2 were overexpressed in cells treated with increased concentrations of glucose (A) or glutamine (B) for 6 h. GOT2 proteins were purified by Flag beads, and the K159 acetylation level of GOT2 and its protein association with Myc-MDH2 were determined by Western blot analysis.
- C,D Glucose and glutamine increase GOT2 K159 acetylation in Panc-1 cells. Flag-GOT2 was overexpressed in cells treated with different concentrations of glucose (C) and glutamine (D) for 4 h. GOT2 proteins were purified by Flag beads, and the K159 acetylation level of GOT2 was determined by Western blot analysis. Relative GOT2 K159 acetylation levels were normalized against Flag protein levels.
- E,F Quantification of the percentage of K159-acetylated endogenous GOT2 in Panc-1 cells. Recombinant fully K159-acetylated GOT2 was loaded onto the same gel, together with endogenous GOT2 from Panc-1 cells treated without or with glucose (12 mM) (E) or glutamine (2 mM) (F) for 4 h. GOT2 protein and K159 acetylation were detected by Western blot. The percentages of K159 acetylation in GOT2 were calculated after normalizing against GOT2 protein levels.
- G,H 3K mutant GOT2 displays negligible response in changing protein association with MDH2 after glucose or glutamine treatment. Panc-1 cells with GOT2 knockdown and re-expression of wild-type or 3K mutant GOT2 were treated with glucose (G) or glutamine (H) at the indicated concentrations for 4 h. The protein association between Flag-tagged wild-type or 3K mutant GOT2 and endogenous MDH2 was determined by Western blot analysis.
Pancreatic ductal adenocarcinoma cancer (PDAC) is highly sensitive to glucose and glutamine deprivation (Ying et al, 2012; Son et al, 2013). In addition to a well-known glutamine metabolism pathway mediated by glutamate dehydrogenase (GLUD1), PDAC relies on a novel pathway for glutamine metabolism in which glutamate transaminases GOT1 and GOT2 are involved (Son et al, 2013). We next determined the regulation of GOT2 K159 acetylation by glucose and glutamine in Panc-1, a pancreatic cancer cell line. We found that the level of K159 acetylation in Flag-GOT2 was increased by as much as 3.67-fold and 3.02-fold in Panc-1 cells treated with glucose (12 mM) and glutamine (2 mM), respectively (Fig2C and D). By using the recombinant GOT2K159ac protein purified from E. coli as the standard, we found that 14–16% of endogenous GOT2 was acetylated at K159 in Panc-1 cells in culture medium containing no glucose and glutamine, while the K159 acetylation level of endogenous GOT2 was increased to 43 and 48% when the cells were maintained with glucose (12 mM) and glutamine (2 mM), respectively (Fig2E and F). We then generated GOT2 knockdown Panc-1 cells, in which we stably expressed GOT2 variants (Supplementary Fig S7), and found that glucose or glutamine treatment significantly increased the association of wild-type GOT2 with MDH2 (Fig2G and H). As compared to wild-type GOT2, acetylation-mimetic 3KQ mutant GOT2 displayed stronger association with MDH2, but this protein interaction was not affected by glucose or glutamine treatment (Fig2G and H). In contrast, deacetylation-mimetic 3KR mutant GOT2 was incapable to bind with endogenous MDH2 in cells without or with glucose/glutamine treatment (Fig2G and H). These results further support the notion that both glucose and glutamine can increase GOT2 3K acetylation, thereby promoting GOT2–MDH2 association.
SIRT3 deacetylates GOT2 and impairs its association with MDH2
Our earlier observation that NAM increased GOT2 acetylation and association with MDH2 led us to investigate which NAD+-dependent SIRT(s) is involved in GOT2 deacetylation. Given that GOT2 is localized in the mitochondria, we examined whether mitochondrial SIRTs, SIRT3–5 (Imai & Guarente, 2010), could deacetylate GOT2 and affect its function. We found that GOT2 directly interacted with SIRT3, but not SIRT4 and SIRT5 (Fig3A). In agreement with this, the interaction between endogenous GOT2 and SIRT3 proteins was readily detected in HEK293T cells (Fig3B). Co-overexpression of SIRT3, but not SIRT4 and SIRT5, greatly decreased the acetylation level of ectopically expressed GOT2 (Fig3A). When GOT2 was co-expressed with a catalytically inactive mutant of SIRT3, SIRT3H248Y (Schwer et al, 2002), the K159 acetylation level of GOT2 was unchanged (Fig3C). Moreover, co-expression of wild-type SIRT3, but not the catalytically inactive SIRT3H248Y mutant, impaired the protein interaction between Flag-GOT2 and Myc-MDH2 (Fig3D). Conversely, transient knockdown of SIRT3 in HEK293T cells increased the K159 acetylation level of Flag-GOT2 and enhanced the interaction between Flag-GOT2 and endogenous MDH2 (Fig3E). The acetylation-deficient 3KR mutant GOT2 displayed negligible binding with endogenous MDH2 in HEK293T cells, and knocking down SIRT3 did not affect its association with MDH2 (Fig3E). Furthermore, transient knockdown of SIRT3 in HEK293T cells diminished the effect of high glucose or glutamine on changing the K159 acetylation level of Flag-GOT2 (Fig3F and G). Collectively, these results suggest that the mitochondrial SIRT3 is the major deacetylase of GOT2 and that the effect of GOT2 acetylation on promoting GOT2–MDH2 association is counted by SIRT3.
Figure 3.
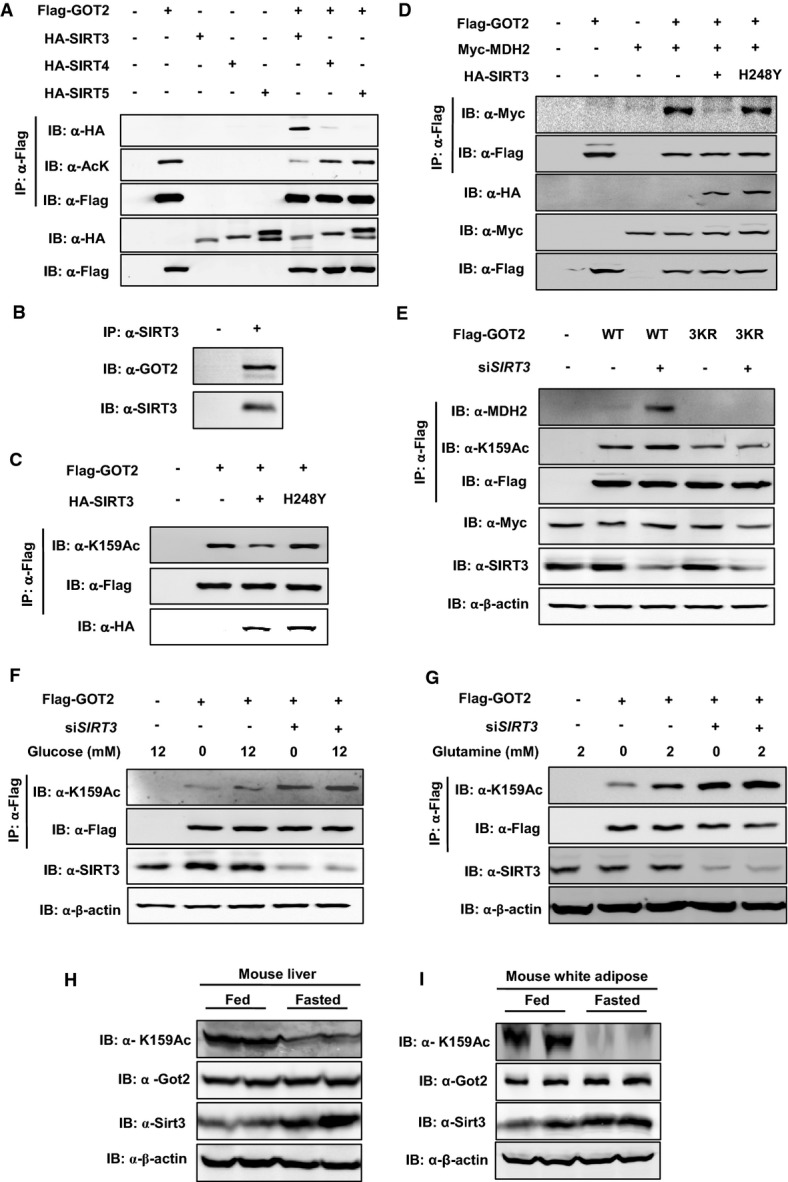
- A GOT2 interacts with SIRT3, but not SIRT4 and SIRT5. Flag-tagged GOT2 was ectopically expressed in HEK293T cells together with the individual HA-tagged SIRT as indicated. Proteins were purified by IP with Flag beads, following Western blot to detect SIRTs with an HA antibody.
- B Endogenous proteins of GOT2 and SIRT3 interact with each other. SIRT3 protein in HEK293T cells was purified by IP with an anti-SIRT3 antibody, following Western blot to detect GOT2 with an anti-GOT2 antibody.
- C GOT2 deacetylation is dependent on SIRT3 catalytic activity. Flag-tagged GOT2 was ectopically expressed in HEK293T cells together with HA-tagged wild-type SIRT3 and a catalytically inactive mutant, SIRT3 H248Y. GOT2 proteins were purified by Flag beads, following Western blot to detect GOT2 K159 acetylation.
- D SIRT3 impairs the protein interaction between GOT2 and MDH2. HEK293T cells were transfected with the plasmids as indicated. GOT2 proteins were purified by Flag beads, and their protein interaction with Myc-MDH2 was determined by Western blot.
- E Knockdown of SIRT3 increases GOT2 K159 acetylation and enhances GOT2–MDH2 association. HEK293T cells with or without transient SIRT3 knockdown were transfected with the plasmids as indicated. GOT2 proteins were purified by Flag beads, and the K159 acetylation level of GOT2 and its protein association with endogenous MDH2 were determined by Western blot analysis.
- F,G Knockdown of SIRT3 diminishes the effect of glucose or glutamine on changing GOT2 K159 acetylation. Flag-tagged GOT2 was ectopically expressed in HEK293T cells without or with transient SIRT3 knockdown. These cells were treated with different concentrations of glucose (F) and glutamine (G) as indicated. GOT2 proteins were purified by Flag beads, and the K159 acetylation level of GOT2 was determined by Western blot analysis.
- H,I Up-regulation of Sirt3 leads to decreased Got2 K159 acetylation in mouse tissues during fasting. C57BL/6 mice (male, 20 weeks; n = 2 per group) were fed a normal chow diet or fasted overnight. Upon sacrifice, mouse liver and white adipose tissues were harvested, and the levels of the indicated proteins were determined by Western blot analysis.
Moreover, it has previously been reported that Sirt3 expression is up-regulated in mouse tissues during fasting (Hirschey et al, 2010). In agreement, we found that Sirt3 protein expression was indeed increased in the liver and white adipose tissues of overnight-fasted mice when compared to control-fed animals (Fig3H and I). Importantly, Got2 protein expression was not changed in mouse liver and white adipose during fasting, but the K159 acetylation level of Got2 was profoundly decreased in both tissues (Fig3H and I), highlighting the physiological relevance of SIRT3-dependent GOT2 3K acetylation in vivo.
GOT2 acetylation stimulates ATP production and suppresses ROS levels
NAD+ and NADH play a pivotal role in cellular metabolism, acting as coenzymes in numerous central housekeeping redox reactions. The cytosolic ratio between the reduced and the oxidized forms (NADH/NAD+) maintains cellular redox homeostasis and has been considered as a cellular metabolic readout (Christensen et al, 2014). In addition to the malate–aspartate shuttle, two other pathways are also known to regulate the cytosolic NADH/NAD+ ratio in the cell, including lactate dehydrogenase (LDH)-catalyzed reversible oxidation of lactate to pyruvate, and glycerol-3-phosphate dehydrogenase (GPDH)-mediated glycerol phosphate shuttle. In this study, we found that when Panc-1 cells were treated with oxamate, a specific LDH inhibitor (Novoa et al, 1959), the cytosolic NADH level was significantly increased (by 39%, P < 0.001, Fig4A), supporting the concept that LDHA is important for the anaerobic conversion of NADH to NAD+ in the cytosol. Moreover, in Panc-1 cells, inhibition of the malate–aspartate shuttle and the glycerol phosphate shuttle by AOA [a specific malate–aspartate shuttle inhibitor (Eto et al, 1999)] and epigallocatechin-3-gallate [EGCG, a multi-functional agent which can inhibit GPDH (Kao et al, 2010)], respectively, led to a significant increases in the cytosolic NADH level (by 25%, P < 0.001 for AOA treatment and by 15%, P < 0.01 for EGCG treatment) (Fig4A). These findings indicate that the malate–aspartate shuttle contributes more than the glycerol phosphate shuttle to regulate cytosolic NADH redox homeostasis in Panc-1 cells.
Figure 4.

- A The malate–aspartate shuttle, such as LDH, also plays a key role in regulating cytosolic NADH levels in Panc-1 cells. Cells were treated with AOA (1.6 mM, 20 min), oxamate (5 mM, 20 min), and EGCG (0.5 mM, 20 min). The cytosolic NADH level was measured as described in Materials and Methods.
- B,C GOT2 3K acetylation promotes the net transfer of cytosolic NADH into mitochondria. In Panc-1 stable cells with GOT2 knockdown and re-expressing the indicated proteins, the NADH level in the cytosol (B) and mitochondrion (C) was determined in cell extracts as described in Materials and Methods.
- D GOT2 3K acetylation regulates mitochondrial NADH/NAD+ redox in the cell. In Panc-1 stable cells with GOT2 knockdown and re-expressing the indicated proteins, the ratio of NADH/NAD+ in the mitochondria of cells was measured as described in Materials and Methods.
- E GOT2 3K acetylation promotes ATP production. In Panc-1 stable cells with GOT2 knockdown and re-expressing the indicated proteins, ATP production was determined in cell extracts as described in Materials and Methods.
- F GOT2 3K acetylation promotes NADPH production. In Panc-1 stable cells with GOT2 knockdown and re-expressing the indicated proteins, the ratio of NADPH/NADP+ was determined in cell extracts as described in Materials and Methods.
- G GOT2 3K acetylation promotes GSH production. In Panc-1 stable cells with GOT2 knockdown and re-expressing the indicated proteins, the GSH/GSSG ratio was determined in cell extracts as described in Materials and Methods.
- H GOT2 3K acetylation suppresses cellular ROS levels. In Panc-1 stable cells with GOT2 knockdown and re-expressing the indicated proteins, ROS was determined as described in Materials and Methods in cells under non-stressed condition or exposed to menadione (50 μM for 30 min).
- I GOT2 3K acetylation protects cells from oxidative damage. Panc-1 stable cells with GOT2 knockdown and re-expressing the indicated proteins were treated with increasing concentrations of menadione for 3 h as indicated, and cell viability was determined by counting the remaining adherent cells.
- J,K Panc-1 stable cells with GOT2 knockdown and re-expressing the indicated proteins were seeded in a 6-well plate, and the cells were maintained under the condition of low glucose (0.5 mM, J) or high glucose (12 mM, K). Culture medium was refreshed every day, and cell numbers were counted every 1–2 days over a period of 7 days.
- L,M Panc-1 stable cells in (J, K) were grown under low glucose (0.5 mM) or high glucose (12 mM) for 7 days. The level of histone H3 phosphorylation at Ser10 was determined by Western blot analysis (L). The percentages of living cells and apoptotic cells were determined by flow cytometry as described in Materials and Methods (M).
Similar to AOA treatment, knocking down GOT2 could also effectively inhibit the malate–aspartate shuttle, resulting in a significant increase (by 1.3-fold; P < 0.01) in the cytosolic NADH level in Panc-1 cells (Supplementary Fig S8A). Concomitantly, GOT2 knockdown led to a substantial reduction in the mitochondrial NADH level (by 33%; P < 0.01) (Supplementary Fig S8B), affirming the vital role of GOT2 in controlling the net transfer of cytosolic NADH into mitochondria. As a result, GOT2 knockdown significantly reduced ATP production (by 26%; P < 0.01) in Panc-1 cells (Supplementary Fig S8C). Moreover, in these stable Panc-1 cells with GOT2 knockdown, we found that re-expression of acetylation-mimetic 3KQ mutant GOT2 led to a significant (P < 0.05) reduction in the cytosolic NADH level as compared to wild-type-rescued cells when treated without or with glucose (i.e., 0 and 12 mM glucose) (Fig4B). Meanwhile, 3KQ mutant GOT2-rescued cells displayed a significant (P < 0.05 or P < 0.01) increase in the mitochondrial NADH level as compared to wild-type-rescued cells when treated without or with glucose (Fig4C), suggesting that GOT2 3K acetylation promotes the net transfer of cytosolic NADH into mitochondria. On the other hand, re-expression of the acetylation-deficient 3KR mutant GOT2, which fails to interact with MDH2, led to a significant (P < 0.05) increase in the cytosolic NADH level and concomitantly a significant (P < 0.05) decrease in the mitochondrial NADH level when compared to wild-type-rescued cells exposed to high glucose (12 mM) (Fig4B and C). The effect of 3KR mutant GOT2 on changing the cytosolic and mitochondrial NADH levels was, however, not observed in rescued cells treated with no glucose (Fig4B and C). More importantly, we found that the ratio of NADH/NAD+ was significantly increased (by 1.4-fold; P < 0.01) in the mitochondria of 3KQ mutant GOT2-rescued cells when compared to wild-type-rescued cells exposed to high glucose (Fig4D). This result further supports the physiological relevance and importance of GOT2 acetylation for regulating mitochondrial NADH/NAD+ redox. In agreement with this, 3KQ mutant GOT2 significantly (P < 0.01) increased ATP levels in rescued cells treated without or with glucose, while 3KR mutant GOT2 had the opposite effect on ATP production when rescued cells were exposed to high glucose (Fig4E).
Besides ATP production, the malate–aspartate shuttle may also regulate NADPH production to maintain the cellular redox state (Son et al, 2013). In agreement with this, we found that GOT2 knockdown led to a significant reduction (by ∼50%; P < 0.01) in the NADPH/NADP+ ratio in Panc-1 cells (Supplementary Fig S8D). As a result, higher ROS levels were observed in GOT2 knockdown cells under non-stressed condition or exposed to menadione, a quinone compound that induces the production of superoxide radicals (Supplementary Fig S8E). Importantly, re-expression of 3KR mutant GOT2, which is defective in binding to MDH2 and thus inhibits the malate–aspartate shuttle activity, significantly decreased the ratios of NADPH/NADP+ (by 27%; P < 0.001) and GSH/GSSH (by 42%; P < 0.05) (Fig4F and G), enhanced ROS (Fig4H), and increased ROS-induced cell death (Fig4I). In contrast, re-expression of 3KQ mutant GOT2, which binds strongly with MDH2 and thus stimulates the malate–aspartate shuttle activity, significantly increased the ratios of NADPH/NADP+ (by 1.2-fold; P < 0.001) and GSH/GSSH (by 1.4-fold; P < 0.05) (Fig4F and G). As a result, re-expression of 3KQ mutant GOT2 suppressed ROS (Fig4H) and protected cells from oxidative damage (Fig4I). Moreover, using an siRNA approach, we reduced NADK2 expression, NADK2 encoding a key enzyme responsible for generating mitochondrial NADPH (Houten et al, 2014) (Supplementary Fig S9A). We found that knockdown of NADK2 could not block the antioxidant response in rescued cells expressing 3KQ mutant GOT2 (Supplementary Fig S9B); this implies that the antioxidative effect of GOT2 3K acetylation on increasing NADPH production may be independent of NADK2.
Considering the intimate link between cellular compartments when it comes to redox potential, we next investigated the effect of GOT2 3K acetylation on altering the redox status and sirtuin activity in other cell compartments besides the mitochondrion. To accurately measure the redox status, we established wild-type or 3K mutant GOT2-rescued cells stably co-expressing cytosolic redox-sensitive green fluorescent protein 1 (roGFP1), which allows real-time visualization of thiol-disulfide metabolic state in the cytosol of living cells (Dooley et al, 2004). We found that the 3KR mutant GOT2-rescued cells exhibited significantly (P < 0.05) higher levels of disulfide (oxidized thiol) than wild-type-rescued cells, while the 3KQ-rescued cells displayed significantly (P < 0.01) lower levels of disulfide (Supplementary Fig S10), suggesting that GOT2 3K acetylation can alter the cytosolic redox status in the cell. On the other hand, we found that the acetylation levels of H3K9 and H3K56, both of which are known substrates of nuclear SIRT1 (Nakahata et al, 2008; Yuan et al, 2009), did not differ between wild-type and 3K mutant GOT2-rescued cells (Supplementary Fig S11A). Also, the K100 acetylation level of PGM2, a direct substrate of cytosolic SIRT2 (Xu et al, 2014), did not differ between wild-type and 3K mutant GOT2-rescued cells (Supplementary Fig S11B). These results suggest that GOT2 3K acetylation may not affect the activity of sirtuins in the nuclear and cytosolic compartments.
We found that the 3KQ mutant GOT2-rescued cells exhibited a significant (P < 0.01) reduction in basal respiration when compared to wild-type and the 3KR mutant GOT2-rescued cells, while ATP turnover and respiration capacity were not affected by GOT2 3K acetylation (Supplementary Fig S12). Moreover, the 3KQ mutant GOT2-rescued cells displayed higher rates of glucose and glutamine uptake than wild-type rescued cells (Supplementary Fig S13A and B). Furthermore, GOT2 knockdown significantly inhibited cell proliferation in Panc-1 cells (Supplementary Fig S8F), supporting the vital role of GOT2 in promoting pancreatic cancer cell proliferation. To further expand the physiological relevance and importance of GOT2 acetylation, we examined the effect of GOT2 3K acetylation on cell proliferation and cell survival during glucose depletion. We found that acetylation-mimetic 3KQ mutant GOT2 promoted cell proliferation under the condition of low glucose (0.5 mM glucose) or high glucose (12 mM) (Fig4J and K). The observed growth advantage was in line with higher levels of histone H3 phosphorylation at Ser10 and reduced apoptosis in the 3KQ-rescued cells under low glucose condition (Fig4L and M). These data are consistent with a cell growth-promoting role of GOT2 acetylation even under stress conditions such as glucose depletion.
Furthermore, we observed that deacetylation-mimetic 3KR mutant GOT2 suppressed cell proliferation under the condition of high glucose (12 mM) (Fig4K). This led us to test the effect of SIRT3-mediated GOT2 deacetylation on cell proliferation. In Panc-1 cells stably overexpressing Flag-GOT2, pharmacological activation of SIRT3 by NMN, the NAD+ precursor, led to significantly increased levels of intracellular NAD+ (Supplementary Fig S14A) and decreased levels of K159 acetylation of Flag-GOT2 (Supplementary S14B). Cell growth was, however, not affected by NMN treatment (Supplementary Fig S14C). It has to be noted that NMN broadly activates NAD+-dependent enzymes, including SIRT3 and the other SIRTs. To more specifically test the effect of SIRT3 on cell proliferation, we generated stable Panc-1 cells co-overexpressing Flag-GOT2 and HA-tagged wild-type or catalytically inactive mutant SIRT3, and growth of these stable cells was carefully monitored over a period of 6 days. As expected, stable overexpression of SIRT3, but not SIRT3H248Y mutant, decreased the K159 acetylation level of Flag-GOT2 (Supplementary Fig S14D). Moreover, stable overexpression of SIRT3, but not SIRT3H248Y mutant, significantly inhibited cell proliferation (Supplementary Fig S14E). These results suggest that SIRT3 suppresses pancreatic cancer cell proliferation, which is at least in part associated with SIRT3-mediated GOT2 deacetylation.
Taken together, our results suggest that GOT2 3K acetylation promotes the net transfer of cytosolic NADH into mitochondria to stimulate ATP production, increases NADPH production to suppress ROS, and enhances the uptake of glucose/glutamine, thereby supporting cultured pancreatic cancer cell proliferation.
GOT2 acetylation promotes cell proliferation and tumor growth
The effect of acetylation on stimulating the function of GOT2 in both ATP production and ROS suppression prompted us to determine whether GOT2 acetylation allows for an in vivo growth advantage for tumor cells, which have increased demand for ATP and also sustain increased oxidative stress. We performed xenograft experiments using Panc-1 cells in which endogenous GOT2 was knocked down and wild-type or acetylation-mimetic 3KQ mutant GOT2 was ectopically expressed. Tumor cell growth was monitored over a period of 8 weeks. We found that the tumor volumes in nude mice injected with cells re-expressing 3KQ mutant GOT2 were significantly larger than those from mice injected with cells re-expressing wild-type GOT2 (tumor size at 8 weeks: 247.4 mm3 vs. 84.6 mm3 for 3KQ mutant vs. wild-type; P < 0.0001) (Fig5A). The tumor weight in nude mice injected with cells re-expressing 3KQ mutant GOT2 was also significantly (P < 0.05) heavier than that from mice injected with cells re-expressing wild-type GOT2 at 8 weeks after injection (Fig5B and C). PCNA staining demonstrated that the 3KQ mutant-expressing tumor cells were more proliferative than the wild-type GOT2-expressing cells (Fig5D). Collectively, these data support the notion that GOT2 3K acetylation promotes cell proliferation and tumor growth in vivo.
Figure 5.

- A–C GOT2 3K acetylation promotes xenograft tumor growth. Panc-1 stable cells with GOT2 knockdown and re-expressing the indicated proteins (2 × 10⁶ cells) were injected subcutaneously into the flanks of nude mice. The tumor volume was carefully monitored over the indicated time period (A). At 8 weeks after injection, tumors from six mice were extracted, photographed, and weighted (B, C).
- D GOT2 3K acetylation promotes tumor cell proliferation. Tumor sections from xenografts were prepared for IHC staining, and the PCNA-stained tumor sections were analyzed by quantifying the PCNA-positive area.
- E Clinical cases with increased GOT2 K159 acetylation in human pancreatic tumor tissues. 10 pairs of human pancreatic tumor tissue (shown as T) and adjacent normal tissue (shown as N) were lysed. The acetylation level of GOT2 at K159 was compared against GOT2 protein by Western blot.
- F Clinical cases with decreased SIRT3 protein expression in human pancreatic tumor tissues. 10 pairs of human pancreatic tumor tissue (shown as T) and adjacent normal tissue (shown as N) were lysed. The SIRT3 protein levels were compared against tubulin by Western blot.
- G,H Quantification of GOT2 K159 acetylation and SIRT3 protein expression in clinical cases as described in (E) and (F).
GOT2 K159 acetylation is increased in pancreatic cancer
The finding that tumors derived from the 3KQ mutant-expressing Panc-1 cells were more proliferative led us to examine the acetylation level of GOT2 in clinical samples of primary human pancreatic tumors. To this end, we collected a total of 10 pairs of primary human pancreatic cancer samples (T) with the adjacent normal pancreatic duct tissues (N) and performed a direct immunoblotting analysis to determine the K159 acetylation level of GOT2. This analysis revealed that, when compared with the matched normal pancreatic tissues, seven of 10 pancreatic cancer samples showed significantly (P < 0.001) increased levels of GOT2 K159 acetylation after normalizing to total GOT2 protein levels (Fig5E and G). Furthermore, we found that SIRT3 protein expression was significantly (P < 0.01) decreased in all the 10 pancreatic cancer samples when compared to their matched normal pancreatic tissues (Fig5F and H). The results indicate that the K159 acetylation level of GOT2 may be a potential biomarker for pancreatic cancer diagnosis.
Discussion
Reprogramming of metabolic pathways, including elevated glycolysis, is a hallmark of cancer (Ward & Thompson, 2012). In most cancer cells, glycolysis is highly elevated to meet their increased energy, biosynthesis, and redox needs. The malate–aspartate shuttle has been shown to promote the net transfer of cytosolic NADH into mitochondria to ensure a high rate of glycolysis in diverse cancer cell lines (Dionisi et al, 1974; Greenhouse & Lehninger, 1976, 1977; Lopez-Alarcon et al, 1979; Lopez-Alarcon & Eboli, 1986). Inhibition of the malate–aspartate shuttle by a specific inhibitor, AOA, was found to impair the conversion of glucose into products of the tricarboxylic acid cycle and eventually decrease breast adenocarcinoma cell proliferation (Thornburg et al, 2008). Moreover, knocking down GOT1/2 genes, two important components of the malate–aspartate shuttle, has recently been reported to inhibit cell proliferation and colony formation in pancreatic cancer cell lines (Son et al, 2013). These findings suggest that the malate–aspartate shuttle and particularly GOT enzymes are indispensable for maintaining a high rate of glycolysis to support rapid tumor cell growth. However, very little is known about how the malate–aspartate shuttle is regulated in response to the changes of metabolic condition and in proliferative diseases such as cancer.
In the present study, we have discovered that acetylation of three lysine residues in GOT2, K159, K185, and K404 (3K), enhances the protein association between GOT2 and MDH2, two principal enzymes localized in the mitochondrion that controls the malate–aspartate shuttle. Acetylation-promoted GOT2–MDH2 association stimulates the malate shuttle activity and thus promotes the net transfer of cytosolic NADH into mitochondria to support ATP production (Fig.6). Importantly, we found a significant increase of NADH/NAD+ ratio in the mitochondrion of cells in which endogenous GOT2 was depleted and the acetylation-mimetic 3KQ mutant was ectopically expressed (knockdown and put-back experiment). This result indicates that the increased mitochondrial NADH level is most likely caused by the enhanced NADH transfer from cytosol to mitochondria, rather than reduced NADH oxidation at the level of respiratory chain complex I, supporting the physiological relevance of GOT2 3K acetylation for regulating mitochondrial NADH/NAD+ redox.
Figure 6.
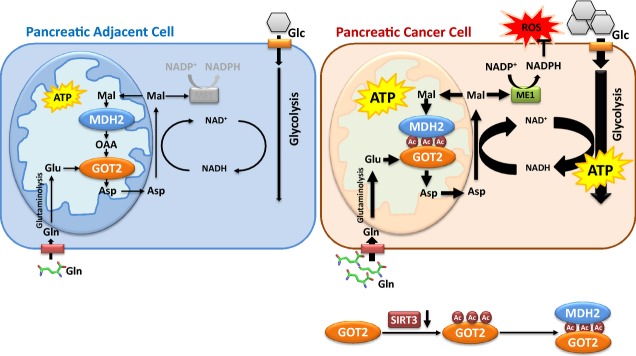
A working model illustrating regulation of the malate–aspartate shuttle by GOT2 acetylation
Shown is a working model depicting how acetylation of GOT2 at 3K regulates the malate–aspartate shuttle and promotes pancreatic tumor proliferation. In pancreatic tumor cells, reduced SIRT3 expression leads to an increase of GOT2 acetylation. GOT2 acetylation at 3K enhances the protein interaction between GOT2 and MDH2, thereby stimulating the net transfer of cytosolic NADH into mitochondria to support ATP production. Meanwhile, GOT2 3K acetylation promotes cellular NADPH production to suppress ROS that are produced during rapid cell proliferation. Glc, glucose; Gln, glutamine; Asp, aspartate; and Mal, malate.
Furthermore, our results also demonstrate that GOT2 3K acetylation stimulates the production of NADPH and helps in the defense against ROS that are produced during rapid cell proliferation (Fig.6). Moreover, we have provided evidence showing that SIRT3 is the major deacetylase of GOT2. Besides GOT2, SIRT3 can deacetylate multiple other substrates that also contribute, directly or indirectly, to cellular ROS defense, including IDH2 (Yu et al, 2012), SOD2 (Chen et al, 2011), and ALDH2 (Lu et al, 2011). Among these metabolic enzymes, GOT2 converts Glu and OAA to α-KG and Asp to promote a series of reactions, including malate decarboxylation and production of NADPH that is the key metabolite for maintaining the redox status; IDH2 is another major source of reductant NADPH; SOD2 scavenges ROS through catalyzing the detoxification of superoxide into oxygen and hydrogen peroxide; and ALDH2 possesses the antioxidant property by oxidizing and detoxify aldehydes. Notably, deacetylation by SIRT3 stimulates the activity of SOD2 and IDH2, but inhibits the activity of ALDH2. Moreover, deacetylation by SIRT3 may not affect the enzyme activity of GOT2 itself, but can impair the protein association between GOT2 and MDH2 and therefore inhibit the malate–aspartate shuttle activity. These examples demonstrate the complexity of SIRT3 in regulating enzymes involved in cellular redox regulation, supporting a notion that metabolic reactions are highly coupled and interconnected. In the current study, we have demonstrated that the main function of SIRT3-mediated GOT2 deacetylation is to regulate its binding with MDH2 and thus the malate–aspartate NADH shuttle activity, mitochondrial NADH/NAD+ redox and ATP production. Reduced activity of GOT2 in ROS defense following SIRT3-deacetylation, we believe is offset by the reduced GOT2–MDH2 association, malate–aspartate shuttle, and ATP production. To the best of our knowledge, this is the first study to show regulation of the malate–aspartate shuttle activity/function at a post-translational level. Whether lysine acetylation could regulate cytoplasmic GOT1–MDH1 interaction, in other words, whether lysine acetylation is specific to regulate mitochondrial GOT2–MDH2 association, needs further investigation.
Recent evidence has shown a high metabolic dependency of PDAC cells on increased use of both glucose and glutamine to support cell growth (Ying et al, 2012; Son et al, 2013). In this study, we show that both glucose and glutamine increase GOT2 3K acetylation in Panc-1 cells and that GOT2 3K acetylation plays a critical role in coordinating glucose and glutamine uptake to provide energy and support cell proliferation and tumor growth. It raises the possibility that drugs inhibiting GOT2 3K acetylation may merit exploration as a therapeutic agent especially for pancreatic cancer. Our current study has identified SIRT3 as the major deacetylase of GOT2. Accumulating evidence has demonstrated that SIRT3 may have a dual role in cancer development, acting as either oncogene or tumor suppressor by targeting a series of key substrates and their relevant pathways in cancer (Chen et al, 2014). In the present study, we found that SIRT3 overexpression led to decreased GOT2 K159 acetylation and significantly inhibited cell proliferation in Panc-1 cells. Moreover, we show that SIRT3 expression is broadly reduced in pancreatic cancer tissues compared to adjacent normal tissues, and the observed reduction in SIRT3 expression is in parallel with an increase in GOT2 K159 acetylation in pancreatic cancer tissues. Our findings not only provide direct evidence showing GOT2 acetylation in vivo, but also reveal that SIRT3 may function as a tumor suppressor in pancreatic cancer with a potential role in deacetylating GOT2 and inhibiting the malate NADH shuttle activity.
Materials and Methods
For more details about antibodies, chemicals, plasmids, cell culture and transfection, immunoprecipitation and Western blotting, measurement of intracellular ATP, measurement of intracellular NADPH and NADP+, measurement of mitochondrial NADH and NAD+, measurement of intracellular GSH, GSSG, and NAD+, measurement of intracellular ROS, measurement of cytosolic redox status, measurement of cell respiration, flow cytometry, and immunohistochemistry, please refer to the Supplementary Experimental Procedures.
Protein expression and purification
Wild-type and 3K mutant GOT2 proteins (30–430 amino acid) were overexpressed in E. coli strain BL21 (DE3). 0.5 mM IPTG was added into the bacterial culture to induce protein expression till OD600 reached 0.6–0.8. After that, the cells were harvested and recombinant proteins were purified by using affinity chromatography (GE Healthcare) and then stored at −80°C for further analysis. Protein concentrations were determined by the Bradford method using a Bio-Rad Protein Assay Kit (Bio-Rad).
The K159 site-specifically acetylated GOT2 was expressed in E. coli as previously described (Neumann et al, 2008). In short, amino acids 30–430 of GOT2 were cloned into pTEV-8 vector with amber codon being incorporated at lysine 159 (AAG to TAG by site-directed mutagenesis). The E. coli strain BL21 (DE3) was transformed with three plasmids, pAcKRS-3, pCDF PylT-1, and pTEV-8-GOT2. Cells were grown overnight in LB containing spectinomycin (50 μg/ml), kanamycin (50 μg/ml), and ampicillin (150 μg/ml) at 37°C till OD600 reached 0.6–0.8. The culture was supplemented with 20 mM NAM and 2 mM acetyllysine (AcK, Sigma). Protein expression was induced at 37°C by addition of 0.5 mM of isopropyl-1-thio-D-galactopyranoside (IPTG) for 16 h. Afterward, the cells were harvested, and the K159-acetylated GOT2 protein was purified and then stored at −80°C till further analysis.
GOT2 enzyme activity assay
The enzyme activity of GOT2 was determined by using a Glutamate-Oxaloacetate Transaminase Activity Assay Kit (Sigma). In short, the GOT2 protein was mixed with the assay buffer and incubated for 2 min at 37°C in darkness. The change in absorbance at 450 nm was measured every 30 s for 10 min at 37°C in a SpectraMax M5 Microplate Reader (Molecular Devices). Each sample was analyzed in triplicate, and the enzyme activity of GOT2 was calculated following the manufacturer's instruction.
Generation of knockdown and put-back cell lines
To generate stable GOT2 knockdown cell pools in Panc-1 cells, shRNA targeting GOT2 was constructed, and retrovirus was produced using a two-plasmid packaging system as previously described (Christofk et al, 2008). The shRNA targeting sequence for GOT2 is 5′-GGAATCTCTTTGCGTTCTTTG-3′. The pMKO.1-puro shRNA construct was co-transfected with vectors expressing the gag and vsvg genes into HEK293T cells. Retroviral supernatant was harvested 36 h after transfection and mixed with 8 μg/ml polybrene to increase the infection efficiency. Panc-1 cells were infected with the retrovirus and selected in 2 μg/ml puromycin for 1 week.
To generate GOT2 knocking down and putting back stable cell pools in Panc-1 cells, four silent nucleotide substitutions were introduced into Flag-tagged human wild-type or 3KQ mutant GOT2 in the sequence corresponding to the shRNA-targeted region. shRNA-resistant GOT2 was cloned into the retroviral pQCXIH-hygro vector and co-transfected with vectors expressing the gag and vsvg genes in HEK293T cells to produce retroviruses, which were then used to transduce Panc-1 cells, following a selection in 350 μg/ml hygromycin for 3 weeks.
Moreover, to generate cells with transient knockdown of NADK2 or SIRT3 gene, we utilized siRNAs against NADK2 or SIRT3 (Invitrogen) to transfect cells. The siRNA targeting sequences were as follows:
SIRT3 siRNA: 5′-AAAGGTGGAAGAAGGTCCATATCTT-3′
NADK2 siRNA: 5′-GCAGCAGCTAAGCTTGAAT-3′
Measurement of mitochondrial and cytosolic NADH levels
Mitochondrial and cytosolic NADH levels were measured after calibration of Frex and Peredox fluorescence in living cells expressing recombinant Frex and Peredox protein, respectively (Hung et al, 2011; Zhao et al, 2011). After transfection for 30 h, Panc-1 cells were harvested by trypsinization and were washed and re-suspended in PBS. The aliquots of cells were incubated at 37°C with different inhibitors (i.e., EGCG, oxamate, and AOA), and fluorescence excited at 485 nm (Frex) and 400 nm (Peredox) were measured by a Spectra Max M5 microplate reader (Molecular Devices) with emission filter 528 nm. Fluorescence values were background-corrected by subtracting the intensity of Panc-1 cell samples not expressing Frex or Peredox. All the samples were run in triplicate.
Cell proliferation and xenograft studies
Panc-1 stable cells with endogenous GOT2 knockdown and put-back of wild-type or 3K mutant GOT2 (5 × 10⁴ cells) were seeded in 6-well plates under the condition of low glucose (0.5 mM) or high glucose (12 mM). Culture medium was refreshed every day, and cell numbers were counted every 1–2 days over a period of 7 days.
Nude mice (nu/nu, male, 6–8 weeks old) were injected subcutaneously with Panc-1 stable cells with endogenous GOT2 knockdown and re-expression of wild-type or 3KQ mutant GOT2 (2 × 10⁶ cells). The diameters of tumors were measured every 7 days during a total period of 56 days. Around 8 weeks after injection, the tumors were dissected and analyzed.
Human pancreatic cancer samples
Human pancreatic cancer samples were collected by the Zhejiang Cancer Research Institute, Zhejiang Province Cancer Hospital. A physician obtained informed consent from the patients. The procedures related to human subjects were approved by the Ethics Committee of the Institutes of Biomedical Sciences (IBS), Fudan University. Direct immunoblotting for these samples was performed as described above.
Statistics
Statistical analyses were performed with a two-tailed unpaired Student's t-test. All data shown represent the results obtained from triplicated independent experiments with standard errors of the mean (mean ± SD). P < 0.05 was considered statistically significant.
Acknowledgments
We thank the members of the Fudan MCB laboratory for discussions and support throughout this study. This work was supported by the 973 Program (No. 2012CB910303 to D.Y.; No. 2012CB910101 to K.L.G.), the NSFC grant (No. 81372198 to D.Y.), the NSFC Program of International Cooperation and Exchanges (No. 81120108016 to LXQ, Y.X.), and the Shanghai “Phosphor” Science Foundation, China (No. 14QA1400600 to D.Y.). This work was also supported by NIH grants (GM067113 and CA1638311 to Y.X.; CA132809 and CA108941 to K.L.G.).
Author contributions
HY, LSZ, KLG, YX, and DY conceived the general framework of this study. HY and LSZ designed experiments. HY, LSZ, QS, HPL, and MLZ performed experiments. YZZ and YY provided unique biosensor reagents. ZQL collected human pancreatic cancer samples. HY, LSZ, YY, KLG, YX, and DY prepared the manuscript.
Conflict of interest
The authors declare that they have no conflict of interest.
Supporting Information
Supplementary Figures S1–S14, Supplementary Experimental Procedures
Review Process File
References
- Arrio-Dupont M, Coulet PR, Gautheron DC. Coupled reaction of immobilized aspartate aminotransferase and malate dehydrogenase. A plausible model for the cellular behaviour of these enzymes. Biochim Biophys Acta. 1985;829:58–68. doi: 10.1016/0167-4838(85)90068-8. [DOI] [PubMed] [Google Scholar]
- Avalos JL, Bever KM, Wolberger C. Mechanism of sirtuin inhibition by nicotinamide: altering the NAD(+) cosubstrate specificity of a Sir2 enzyme. Mol Cell. 2005;17:855–868. doi: 10.1016/j.molcel.2005.02.022. [DOI] [PubMed] [Google Scholar]
- Backman L, Johansson G. Enzyme—enzyme complexes between aspartate aminotransferase and malate dehydrogenase from pig heart muscle. FEBS Lett. 1976;65:39–43. doi: 10.1016/0014-5793(76)80616-3. [DOI] [PubMed] [Google Scholar]
- Barron JT, Gu L, Parrillo JE. Malate-aspartate shuttle, cytoplasmic NADH redox potential, and energetics in vascular smooth muscle. J Mol Cell Cardiol. 1998;30:1571–1579. doi: 10.1006/jmcc.1998.0722. [DOI] [PubMed] [Google Scholar]
- Bitterman KJ, Anderson RM, Cohen HY, Latorre-Esteves M, Sinclair DA. Inhibition of silencing and accelerated aging by nicotinamide, a putative negative regulator of yeast sir2 and human SIRT1. J Biol Chem. 2002;277:45099–45107. doi: 10.1074/jbc.M205670200. [DOI] [PubMed] [Google Scholar]
- Bryce CF, Williams DC, John RA, Fasella P. The anomalous kinetics of coupled aspartate aminotransferase and malate dehydrogenase. Evidence for compartmentation of oxaloacetate. Biochem J. 1976;153:571–577. doi: 10.1042/bj1530571. [DOI] [PMC free article] [PubMed] [Google Scholar]
- Chen Y, Zhang J, Lin Y, Lei Q, Guan KL, Zhao S, Xiong Y. Tumour suppressor SIRT3 deacetylates and activates manganese superoxide dismutase to scavenge ROS. EMBO Rep. 2011;12:534–541. doi: 10.1038/embor.2011.65. [DOI] [PMC free article] [PubMed] [Google Scholar]
- Chen Y, Fu LL, Wen X, Wang XY, Liu J, Cheng Y, Huang J. Sirtuin-3 (SIRT3), a therapeutic target with oncogenic and tumor-suppressive function in cancer. Cell Death Dis. 2014;5:e1047. doi: 10.1038/cddis.2014.14. [DOI] [PMC free article] [PubMed] [Google Scholar]
- Choudhary C, Kumar C, Gnad F, Nielsen ML, Rehman M, Walther TC, Olsen JV, Mann M. Lysine acetylation targets protein complexes and co-regulates major cellular functions. Science. 2009;325:834–840. doi: 10.1126/science.1175371. [DOI] [PubMed] [Google Scholar]
- Christensen CE, Karlsson M, Winther JR, Jensen PR, Lerche MH. Non-invasive in-cell determination of free cytosolic [NAD+]/[NADH] ratios using hyperpolarized glucose show large variations in metabolic phenotypes. J Biol Chem. 2014;289:2344–2352. doi: 10.1074/jbc.M113.498626. [DOI] [PMC free article] [PubMed] [Google Scholar]
- Christofk HR, Vander Heiden MG, Harris MH, Ramanathan A, Gerszten RE, Wei R, Fleming MD, Schreiber SL, Cantley LC. The M2 splice isoform of pyruvate kinase is important for cancer metabolism and tumour growth. Nature. 2008;452:230–233. doi: 10.1038/nature06734. [DOI] [PubMed] [Google Scholar]
- Digerness SB, Reddy WJ. The malate-aspartate shuttle in heart mitochondria. J Mol Cell Cardiol. 1976;8:779–785. doi: 10.1016/0022-2828(76)90084-5. [DOI] [PubMed] [Google Scholar]
- Dionisi O, Longhi G, Eboli ML, Galeotti T, Terranova T. Oxidation of reduced nicotinamide-adenine dinucleotide by the malate-aspartate shuttle in Ehrlich ascites tumour cells. Biochim Biophys Acta. 1974;333:577–580. doi: 10.1016/0005-2728(74)90142-x. [DOI] [PubMed] [Google Scholar]
- Dooley CT, Dore TM, Hanson GT, Jackson WC, Remington SJ, Tsien RY. Imaging dynamic redox changes in mammalian cells with green fluorescent protein indicators. J Biol Chem. 2004;279:22284–22293. doi: 10.1074/jbc.M312847200. [DOI] [PubMed] [Google Scholar]
- Eto K, Tsubamoto Y, Terauchi Y, Sugiyama T, Kishimoto T, Takahashi N, Yamauchi N, Kubota N, Murayama S, Aizawa T, Akanuma Y, Aizawa S, Kasai H, Yazaki Y, Kadowaki T. Role of NADH shuttle system in glucose-induced activation of mitochondrial metabolism and insulin secretion. Science. 1999;283:981–985. doi: 10.1126/science.283.5404.981. [DOI] [PubMed] [Google Scholar]
- Furumai R, Komatsu Y, Nishino N, Khochbin S, Yoshida M, Horinouchi S. Potent histone deacetylase inhibitors built from trichostatin A and cyclic tetrapeptide antibiotics including trapoxin. Proc Natl Acad Sci USA. 2001;98:87–92. doi: 10.1073/pnas.011405598. [DOI] [PMC free article] [PubMed] [Google Scholar]
- Greenhouse WV, Lehninger AL. Occurrence of the malate-aspartate shuttle in various tumor types. Cancer Res. 1976;36:1392–1396. [PubMed] [Google Scholar]
- Greenhouse WV, Lehninger AL. Magnitude of malate-aspartate reduced nicotinamide adenine dinucleotide shuttle activity in intact respiring tumor cells. Cancer Res. 1977;37:4173–4181. [PubMed] [Google Scholar]
- Han Q, Robinson H, Cai T, Tagle DA, Li J. Biochemical and structural characterization of mouse mitochondrial aspartate aminotransferase, a newly identified kynurenine aminotransferase-IV. Biosci Rep. 2011;31:323–332. doi: 10.1042/BSR20100117. [DOI] [PMC free article] [PubMed] [Google Scholar]
- Hirschey MD, Shimazu T, Goetzman E, Jing E, Schwer B, Lombard DB, Grueter CA, Harris C, Biddinger S, Ilkayeva OR. SIRT3 regulates mitochondrial fatty-acid oxidation by reversible enzyme deacetylation. Nature. 2010;464:121–125. doi: 10.1038/nature08778. [DOI] [PMC free article] [PubMed] [Google Scholar]
- Houten SM, Denis S, te Brinke H, Jongejan A, van Kampen AH, Bradley EJ, Baas F, Hennekam RC, Millington DS, Young SP. Mitochondrial NADP (H) deficiency due to a mutation in NADK2 causes dienoyl-CoA reductase deficiency with hyperlysinemia. Hum Mol Genet. 2014;23:5009–5016. doi: 10.1093/hmg/ddu218. [DOI] [PubMed] [Google Scholar]
- Hung YP, Albeck JG, Tantama M, Yellen G. Imaging cytosolic NADH-NAD(+) redox state with a genetically encoded fluorescent biosensor. Cell Metab. 2011;14:545–554. doi: 10.1016/j.cmet.2011.08.012. [DOI] [PMC free article] [PubMed] [Google Scholar]
- Imai S, Guarente L. Ten years of NAD-dependent SIR2 family deacetylases: implications for metabolic diseases. Trends Pharmacol Sci. 2010;31:212–220. doi: 10.1016/j.tips.2010.02.003. [DOI] [PMC free article] [PubMed] [Google Scholar]
- Kao CC, Wu BT, Tsuei YW, Shih LJ, Kuo YL, Kao YH. Green tea catechins: inhibitors of glycerol-3-phosphate dehydrogenase. Planta Med. 2010;76:694–696. doi: 10.1055/s-0029-1240623. [DOI] [PubMed] [Google Scholar]
- Kim SC, Sprung R, Chen Y, Xu Y, Ball H, Pei J, Cheng T, Kho Y, Xiao H, Xiao L, Grishin NV, White M, Yang XJ, Zhao Y. Substrate and functional diversity of lysine acetylation revealed by a proteomics survey. Mol Cell. 2006;23:607–618. doi: 10.1016/j.molcel.2006.06.026. [DOI] [PubMed] [Google Scholar]
- Lehninger AL. phosphorylation coupled to oxidative dihydrodiphosphopyridine nucleotide. J Biol Chem. 1951;190:15. [PubMed] [Google Scholar]
- Lopez-Alarcon L, Eboli ML, De Liberali E, Palombini G, Galeotti T. Evidence for the oxidation of glycolytic NADH by the malate-aspartate shuttle in Ehrlich ascites tumor cells. Arch Biochem Biophys. 1979;192:391–395. doi: 10.1016/0003-9861(79)90107-3. [DOI] [PubMed] [Google Scholar]
- Lopez-Alarcon L, Eboli ML. Oxidation of reduced cytosolic nicotinamide adenine dinucleotide by the malate-aspartate shuttle in the K-562 human leukemia cell line. Cancer Res. 1986;46:5589–5591. [PubMed] [Google Scholar]
- Lu Z, Bourdi M, Li JH, Aponte AM, Chen Y, Lombard DB, Gucek M, Pohl LR, Sack MN. SIRT3-dependent deacetylation exacerbates acetaminophen hepatotoxicity. EMBO Rep. 2011;12:840–846. doi: 10.1038/embor.2011.121. [DOI] [PMC free article] [PubMed] [Google Scholar]
- Lundby A, Lage K, Weinert BT, Bekker-Jensen DB, Secher A, Skovgaard T, Kelstrup CD, Dmytriyev A, Choudhary C, Lundby C, Olsen JV. Proteomic analysis of lysine acetylation sites in rat tissues reveals organ specificity and subcellular patterns. Cell Rep. 2012;2:419–431. doi: 10.1016/j.celrep.2012.07.006. [DOI] [PMC free article] [PubMed] [Google Scholar]
- Megee PC, Morgan BA, Mittman BA, Smith MM. Genetic analysis of histone H4: essential role of lysines subject to reversible acetylation. Science. 1990;247:841–845. doi: 10.1126/science.2106160. [DOI] [PubMed] [Google Scholar]
- Nakahata Y, Kaluzova M, Grimaldi B, Sahar S, Hirayama J, Chen D, Guarente LP, Sassone-Corsi P. The NAD+-Dependent Deacetylase SIRT1 Modulates CLOCK-Mediated Chromatin Remodeling and Circadian Control. Cell. 2008;134:329–340. doi: 10.1016/j.cell.2008.07.002. [DOI] [PMC free article] [PubMed] [Google Scholar]
- Neumann H, Peak-Chew SY, Chin JW. Genetically encoding N(epsilon)-acetyllysine in recombinant proteins. Nat Chem Biol. 2008;4:232–234. doi: 10.1038/nchembio.73. [DOI] [PubMed] [Google Scholar]
- Neumann H, Hancock SM, Buning R, Routh A, Chapman L, Somers J, Owen-Hughes T, van Noort J, Rhodes D, Chin JW. A method for genetically installing site-specific acetylation in recombinant histones defines the effects of H3 K56 acetylation. Mol Cell. 2009;36:153–163. doi: 10.1016/j.molcel.2009.07.027. [DOI] [PMC free article] [PubMed] [Google Scholar]
- Novoa WB, Winer AD, Glaid AJ, Schwert GW. Lactic dehydrogenase. V. Inhibition by oxamate and by oxalate. J Biol Chem. 1959;234:1143–1148. [PubMed] [Google Scholar]
- Parrilla R, Jimenez I, Ayuso-Parrilla MS. Glucagon and insulin control of gluconeogenesis in the perfused isolated rat liver. Effects on cellular metabolite distribution. Eur J Biochem. 1975;56:375–383. doi: 10.1111/j.1432-1033.1975.tb02243.x. [DOI] [PubMed] [Google Scholar]
- Safer B, Smith CM, Williamson JR. Control of the transport of reducing equivalents across the mitochondrial membrane in perfused rat heart. J Mol Cell Cardiol. 1971;2:111–124. doi: 10.1016/0022-2828(71)90065-4. [DOI] [PubMed] [Google Scholar]
- Schwer B, North BJ, Frye RA, Ott M, Verdin E. The human silent information regulator (Sir)2 homologue hSIRT3 is a mitochondrial nicotinamide adenine dinucleotide-dependent deacetylase. J Cell Biol. 2002;158:647–657. doi: 10.1083/jcb.200205057. [DOI] [PMC free article] [PubMed] [Google Scholar]
- Siess EA, Brocks DG, Lattke HK, Wieland OH. Effect of glucagon on metabolite compartmentation in isolated rat liver cells during gluconeogenesis from lactate. Biochem J. 1977;166:225–235. doi: 10.1042/bj1660225. [DOI] [PMC free article] [PubMed] [Google Scholar]
- Son J, Lyssiotis CA, Ying H, Wang X, Hua S, Ligorio M, Perera RM, Ferrone CR, Mullarky E, Shyh-Chang N. Glutamine supports pancreatic cancer growth through a KRAS-regulated metabolic pathway. Nature. 2013;496:101–105. doi: 10.1038/nature12040. [DOI] [PMC free article] [PubMed] [Google Scholar]
- Thornburg JM, Nelson KK, Clem BF, Lane AN, Arumugam S, Simmons A, Eaton JW, Telang S, Chesney J. Targeting aspartate aminotransferase in breast cancer. Breast Cancer Res. 2008;10:R84. doi: 10.1186/bcr2154. [DOI] [PMC free article] [PubMed] [Google Scholar]
- Ward PS, Thompson CB. Metabolic reprogramming: a cancer hallmark even warburg did not anticipate. Cancer Cell. 2012;21:297–308. doi: 10.1016/j.ccr.2012.02.014. [DOI] [PMC free article] [PubMed] [Google Scholar]
- Williamson JR, Browning ET, Thurman RG, Scholz R. Inhibition of glucagon effects in perfused rat liver by (+)decanoylcarnitine. J Biol Chem. 1969;244:5055–5064. [PubMed] [Google Scholar]
- Williamson DH, Mayor F, Veloso D. Effects of quinolinic acid on the free and total nicotinamide-adenine dinucleotides of rat liver. Hoppe Seylers Z Physiol Chem. 1970;351:287. [PubMed] [Google Scholar]
- Williamson JR, Jakob A, Refino C. Control of the removal of reducing equivalents from the cytosol in perfused rat liver. J Biol Chem. 1971;246:7632–7641. [PubMed] [Google Scholar]
- Xu Y, Li F, Lv L, Li T, Zhou X, Deng C, Guan K-L, Lei Q-Y, Xiong Y. Oxidative stress activates SIRT2 to deacetylate and stimulate phosphoglycerate mutase. Cancer Res. 2014;3615:2013. doi: 10.1158/0008-5472.CAN-13-3615. [DOI] [PMC free article] [PubMed] [Google Scholar]
- Ying H, Kimmelman AC, Lyssiotis CA, Hua S, Chu GC, Fletcher-Sananikone E, Locasale JW, Son J, Zhang H, Coloff JL, Yan H, Wang W, Chen S, Viale A, Zheng H, Paik JH, Lim C, Guimaraes AR, Martin ES, Chang J, et al. Oncogenic Kras maintains pancreatic tumors through regulation of anabolic glucose metabolism. Cell. 2012;149:656–670. doi: 10.1016/j.cell.2012.01.058. [DOI] [PMC free article] [PubMed] [Google Scholar]
- Yu W, Dittenhafer-Reed KE, Denu JM. SIRT3 protein deacetylates isocitrate dehydrogenase 2 (IDH2) and regulates mitochondrial redox status. J Biol Chem. 2012;287:14078–14086. doi: 10.1074/jbc.M112.355206. [DOI] [PMC free article] [PubMed] [Google Scholar]
- Yuan J, Pu M, Zhang Z, Lou Z. Histone H3-K56 acetylation is important for genomic stability in mammals. Cell Cycle. 2009;8:1747–1753. doi: 10.4161/cc.8.11.8620. [DOI] [PMC free article] [PubMed] [Google Scholar]
- Zhao S, Xu W, Jiang W, Yu W, Lin Y, Zhang T, Yao J, Zhou L, Zeng Y, Li H, Li Y, Shi J, An W, Hancock SM, He F, Qin L, Chin J, Yang P, Chen X, Lei Q, et al. Regulation of cellular metabolism by protein lysine acetylation. Science. 2010;327:1000–1004. doi: 10.1126/science.1179689. [DOI] [PMC free article] [PubMed] [Google Scholar]
- Zhao Y, Jin J, Hu Q, Zhou HM, Yi J, Yu Z, Xu L, Wang X, Yang Y, Loscalzo J. Genetically encoded fluorescent sensors for intracellular NADH detection. Cell Metab. 2011;14:555–566. doi: 10.1016/j.cmet.2011.09.004. [DOI] [PMC free article] [PubMed] [Google Scholar]
Associated Data
This section collects any data citations, data availability statements, or supplementary materials included in this article.
Supplementary Materials
Supplementary Figures S1–S14, Supplementary Experimental Procedures
Review Process File