

Abstract
The extracellular environment exposes cells to numerous biochemical and physical signals that regulate their behavior. Strategies for generating continuous gradients of signals in biomaterials may allow for spatial control and patterning of cell behavior, and ultimately aid in the engineering of complex tissues. Short interfering RNA (siRNA) can regulate gene expression by silencing specific mRNA molecules post-transcriptionally, which may be valuable when presented in a continuous gradient for regenerative or therapeutic applications. Here, a biodegradable hydrogel system containing a gradient of siRNA is presented, and its capacity to regulate protein expression of encapsulated cells in a spatially continuous manner is demonstrated. Photocrosslinkable dextran hydrogels containing a gradient of siRNA have been successfully fabricated using a dual programmable syringe pump system, and differential gene silencing in incorporated cells that is sustained over time has been shown using green fluorescent protein as a reporter. This platform technology may be applied in tissue engineering to spatially control biologically relevant cellular processes.
Keywords: drug delivery, polymeric material, dextran, 3D scaffold, gene knockdown
1. Introduction
The need for replacement of organs and repair of diseased or damaged tissues is not being adequately met by the organ and tissue supply available for transplantation or reconstructive surgery.[1] One exciting potential solution to address this problem is tissue engineering, which seeks to repair or replace native tissue through constructs comprised of a combination of biomaterial scaffolds, bioactive factors, and/or living cells.[2] Integrating principles of fields including chemistry, materials science, biology, and engineering, these constructs can be designed to regulate cell behavior to guide the formation of new functional tissue.
To accomplish this, in some approaches it may be desirable for tissue engineered scaffolds to present physical and biochemical signals similar to those that cells experience during development and/or healing processes.[3] These signals are often spatially complex, and one way in which they are commonly presented is in the form of a gradient. Gradients of morphogens can, for example, help define different cell fates in developing embryos,[4] promote fibroblast migration in wound healing, drive neuronal axon growth, and induce leukocyte migration towards sites of infection.[5] Some fully developed tissue interfaces contain gradients of properties, as well, likely arising from signaling gradients that regulate cell behavior during tissue development. For example, transitions in biochemical composition and mechanical properties have been studied at the interfaces between bone and cartilage,[6] tendon,[7] and ligament.[7b, 8] Strategies for repairing these tissues that utilize layering, or similar approaches to define discrete regions of differing biomaterial properties and/or soluble signals, neglect the full biological complexity of these tissue junctions. These biomaterial discontinuities may impede cellular infiltration or migration, fluid flow for nutrient and waste transport, and proper transfer of mechanical stress between segments.[9] The resulting engineered tissues may lack continuous transitions in cell phenotype and extracellular matrix architecture and composition that are present in complex native tissues. Therefore, incorporating gradients of properties into biomaterial scaffolds can be desirable, especially in such a way that evokes aspects of natural development, to spatially control cell behavior and ultimately form gradients of cell phenotype and tissue properties in engineered tissues.
Consisting of three-dimensional (3D), water-swollen, crosslinked polymer networks, hydrogels are frequently studied scaffolds in tissue engineering research, as they can be designed to mimic the physical and biochemical properties of the natural extracellular matrix, permitting cell encapsulation with high viability as well as effective delivery of bioactive factors.[10] Compared to 2D cell culture environments, the ability of hydrogels to encapsulate cells in 3D conditions that more closely resemble those in native tissues lends them a distinct advantage in tissue engineering applications. While many hydrogel studies focus on isotropic mechanical properties and/or uniform distribution of biomolecules, a number of methods exist to produce gradient hydrogels. For example, applying masks during photopolymerization can produce a gradient of hydrogel stiffness,[11] commercial gradient generators have been used to establish either chemical or mechanical gradients,[12] diffusion-based mechanisms can establish chemical gradients,[13] and microfluidics strategies can generate small-scale physical or chemical gradients.[14] Recently, our group has fabricated cell-encapsulated, 3D hydrogels presenting linear gradients of growth factors, cell adhesion ligands, and mechanical properties using a dual syringe pump approach, and these gradient hydrogels were able to spatially regulate encapsulated stem cell behavior, including osteogenic and chondrogenic differentiation.[15]
Short interfering RNA (siRNA) is a powerful biomolecule that has not previously been presented from a biomaterial in a continuous spatial gradient to control cell function. siRNA functions via the mechanism of RNA interference (RNAi), first described in Caenorhabditis elegans by Fire et al.,[16] where it cleaves specific messenger RNA (mRNA) molecules in the cytoplasm of a cell, thereby preventing the translation process from taking place and ultimately silencing gene expression. While its potential to inhibit genes with high specificity makes it attractive for cancer therapeutics,[17] siRNA is also emerging as a promising bioactive factor for tissue engineering and regenerative medicine applications, with targets for promoting, for example, wound healing[18] and chondrogenic and osteogenic differentiation of stem cells for cartilage and bone formation,[19] respectively. Delivery of siRNA has been investigated using platforms such as hydrogels,[19d, 20] nanofibers,[21] and porous scaffolds,[22] and recently, patterning of siRNA on an implant using an additive manufacturing process was used to control its uptake in discrete locations by human mesenchymal stem cells (hMSCs) seeded on the implant surface.[23] The use of siRNA gradients to spatially control gene expression of cells encapsulated within a biomaterial in a graded manner, however, has not previously been demonstrated.
In this study, we present a photocrosslinkable, biodegradable hydrogel containing a spatial gradient of siRNA and demonstrate that it can successfully elicit a graded response in gene expression by encapsulated cells. The polymer chosen for the hydrogel was dextran (DEX), which our group previously methacrylated to allow for formation of biodegradable photocrosslinks, and engineered for controlled temporal siRNA release.[20b] A cheap and simple technology to generate a continuous spatial gradient of siRNA within the hydrogel is described, which utilizes two programmable syringe pumps, to vary the flow rates of a macromer solution of high siRNA concentration and a macromer solution containing no siRNA, and a custom-built mixing unit. This gradient fabrication method is versatile, as the biomolecule concentration in each syringe and the programmed flow profiles can be varied to alter the composition and slope of the concentration gradient or produce other spatial patterns. We demonstrate that hydrogels containing a linear siRNA gradient can be fabricated by this approach, and that this gradient is maintained over time. Importantly, it is shown that the gradient of siRNA presentation results in a gradient of gene expression knockdown in encapsulated cells that also persists over time. It is anticipated that the ability to spatially control cell behavior using siRNA in a 3D scaffold will be promising for engineering tissues with spatially complex properties, and for future biological investigations of cellular responses to defined, localized presentation of siRNA.
2. Results and Discussion
2.1. Fabrication and quantification of siRNA gradient hydrogels
Methacrylated dextran (DEX-HEMA) was synthesized by the addition of 2-hydroxylethyl methacrylate imidazolylcarbamate (HEMA-IC) to hydroxyl groups of the DEX backbone as described previously and as adapted for different modes of siRNA delivery.[20b, 24] The degree of methacrylation was determined to be 14.9% by 1H-NMR (Figure S1, Supporting Information (SI)). siRNA used in this study was complexed with branched polyethyleneimine (PEI), a cationic transfection agent, to produce nanoparticles that were lyophilized in the presence of sucrose before suspending in 12 wt % DEX-HEMA macromer solution. Formulations of lyophilized siRNA-PEI nanoparticles used in this study were chosen based on their measured transfection efficiency when applied to cells in monolayer (Figure S2 (SI)). Two programmable syringe pumps were used to eject DEX-HEMA macromer solutions through a modified spiral mixer and into a quartz tube (Figure 1a).[15] The flow rates of two DEX-HEMA solutions, one containing siRNA-PEI nanocomplexes, and one containing no siRNA-PEI, were programmed to increase or decrease linearly over time such that the net flow rate of macromer solution through the mixing unit is constant (Figure 1b). By inversely varying the flow rates in this way, a gradient of siRNA was achieved. After crosslinking with UV light, hydrogels were removed from the quartz tubes for subsequent study. A schematic of an siRNA gradient hydrogel construct with encapsulated cells is shown (Figure 1c). Cells were not encapsulated for siRNA quantification (Figure 1) or for siRNA release (Figure 2) studies.
Figure 1.

siRNA gradient hydrogel fabrication and characterization. (a) Photograph of the mixing apparatus used to fabricate gradient hydrogels. (b) Flow profiles as programmed into the syringe pumps to create 4 cm siRNA gradient hydrogels. (c) Schematic of the cell-encapsulated siRNA gradient hydrogel construct, containing an siRNA nanoparticle gradient and a uniform cell density. (d) Quantification of siRNA in sequential 0.5 cm segments of siRNA gradient hydrogels.
Figure 2.

Release of siRNA-PEI nanoparticles from 4 cm gradient gels cut into four adjacent 1 cm segments. (*P < 0.05 compared to day 11 of segment 1, †P < 0.05 compared to day 11 of segment 2, #P < 0.05 compared to day 16 of segment 1, ##P < 0.05 compared to day 16 of segment 2, ###P < 0.05 compared to day 16 of segment 3).
Quantification of siRNA gradient hydrogels immediately after fabrication verified the presence of a continuous, linear gradient (Figure 1d). Regression analysis of the average values for each segment shows a strong linear correlation, with an R2 value of 0.9593. The theoretical gradient is also presented, which was modeled with a linear equation under the assumptions that the distal end of the hydrogels should have a concentration of 0 μg/μl and that each 4 cm hydrogel contains a total of 6 μg siRNA. Additional details regarding the calculation of this theoretical gradient are presented in the Supporting Information. By taking the sum of siRNA in all segments, the total measured amount of siRNA loaded was 6.92 ± 1.23 μg, which is slightly higher than predicted, but the theoretical loaded amount falls within the standard deviation of the measurement. The strong linear correlation between the gradient segments, and the similarity between the slopes of the measured and theoretical gradients (0.1808 and 0.1875 μg/segment, respectively), indicates that the approach described is capable of producing linear gradients.
2.2. Characterization of siRNA nanoparticle release and hydrogel swelling/degradation
To determine if differential siRNA incorporation along the gradient resulted in differential release profiles, release profiles of siRNA-PEI from 1 cm gradient hydrogel segments incubated in phosphate buffered saline (PBS) were measured (Figure 2). From these release results, the sum of siRNA released by all segments was calculated to be 6.97 ± 0.40 μg. This, as well, was slightly higher than the total predicted loaded amount, but it was similar to the value obtained from the quantification of total siRNA loaded. Statistical comparisons between segments at each day showed no significant difference between segments for the first 7 days. At day 11, comparisons of cumulative amount of siRNA released between segment sample groups 1 and 3, 1 and 4, and 2 and 4 were statistically significant, and at day 16, cumulative siRNA release was significantly different between all segments. Overall, siRNA-PEI release was most pronounced at day 16, when all hydrogel segments were fully degraded. The cumulative siRNA release from each segment increased significantly along the gradient at the final time point, which is consistent with the siRNA loading observed per segment quantification (Figure 1d).
The amount of siRNA-PEI complexes released at days 1, 2, 4, and 7 was similar between segments and low compared to the amount released between days 11 and 16. These observations suggest that most siRNA was retained by the hydrogel for at least 7 days, and also, importantly, that the hydrogel retained siRNA as a gradient. By retaining the gradient of siRNA-PEI complexes, this may allow the siRNA gradient hydrogels to sustain the presentation of the gradient to encapsulated cells and induce prolonged knockdown.
Without any covalent bonds or charge interactions between the neutral DEX backbone and the positively charged gene complexes, one possible explanation for this retention behavior is that the complexes were physically immobilized by the hydrogel structure. To investigate this quantitatively, the theoretical hydrogel mesh size was calculated and compared to the measured diameter of siRNA-PEI nanoparticles, where a calculated mesh size smaller than the nanoparticle diameter would indicate that the hydrogel restricted diffusion of the particles. First, the swelling and degradation profiles of DEX-HEMA hydrogels were measured (Figure S3 (SI)), and a modified form of the Flory-Rehner model was applied to calculate the average molecular weight between crosslinks of the polymer backbone based on the swelling ratio.[25] This model is derived from the balance of forces that exist in a hydrogel at swelling equilibrium, where the retractive force of the polymer crosslinks opposes the swelling force caused by thermodynamic polymer/water interactions. The force balance is used to calculate Mc, the number-average molecular weight between crosslinks, using the following equation:[25a]
| (1) |
where Mn is the number-average molecular weight of DEX, v̄ is the partial specific volume of DEX, V1 is the molar volume of water, χ1 is the Flory interaction parameter, v2.r is the polymer volume fraction immediately after gel formation, and v2.s is the polymer volume fraction after equilibrium swelling. This form of the model is modified from the general form by the incorporation of the v2.r parameter, which accounts for the special case of hydrogels that are crosslinked in the presence of water.
The following relationship has been established for DEX:[26]
| (2) |
where is the root-mean-squared average end-to-end distance of polymer chains. When Mc is substituted in place of Mn in the equation above, the average distance between crosslinks is obtained. Using this value, the mesh size, ξ, can be calculated by the following:[25a, 27]
| (3) |
The polymer volume fractions, v2.s and v2.r, were calculated from the corresponding mass swelling ratio by using the following relationship for the densities of water (ρ1) and DEX (ρ2):[27]
| (4) |
The parameters for the equations above were obtained from the literature and from experimental data (Table S2 (SI)).
The theoretical values calculated show an increase in the mesh size as the swelling ratio of the hydrogels increased from day 1 to day 21 of incubation in PBS (Table 1). Comparing the hydrogel mesh size to the observed diameter of agents incorporated within the hydrogels can provide insight regarding their release behavior.[27–28] If the hydrodynamic radius of a loaded factor is less than the mesh size of the encapsulating hydrogel, assuming there are minimal other interactions between the two, diffusion will mediate a relatively rapid release out of the polymer. The diameter of siRNA-PEI nanoparticles used for this study were measured by dynamic light scattering to be 248.2 ± 14.6 nm, and so, despite the mesh size increasing at three weeks to over double its value at day 1, the theoretical mesh size is still far smaller than the nanoparticles being incorporated. Therefore, it is presumed that physical entrapment is responsible for delaying siRNA release as the hydrogel degrades.
Table 1.
DEX-HEMA hydrogel swelling ratio measurements and theoretical mesh size calculation
| Day | Qm | v2,s | Mc (Da) | ζ (nm) |
|---|---|---|---|---|
| 0 (initial)a) | 6.393 | 0.122b) | - | - |
| 1 | 5.678 | 0.135 | 1135 | 4.658 |
| 3 | 6.103 | 0.127 | 1363 | 5.212 |
| 7 | 6.664 | 0.118 | 1691 | 5.957 |
| 14 | 8.285 | 0.097 | 2780 | 8.149 |
| 21 | 9.576 | 0.085 | 3751 | 9.891 |
Molecular weight between crosslinks and mesh size were not calculated for the initial hydrogel (immediately after crosslinking) because the hydrogel had not been submerged in any solution at this time, and thus had not attained swelling equilibrium;
The polymer volume fraction at day 0 is used as V2,r in the modified Flory-Rehner equation.
By day 16, all hydrogel segments used to measure siRNA release were fully degraded, which was shorter than the degradation time of 28 days for hydrogels in swelling/degradation experiments. Possible reasons for the earlier degradation behavior may include differences in PBS incubation volume or frequency of PBS changes.
2.3. Gene expression of cells encapsulated in siRNA gradient hydrogels
Bioactivity of siRNA in gradient hydrogels was evaluated by incorporating human embryonic kidney (HEK293) cells stably transfected to express destabilized green fluorescent protein (deGFP), and a gradient of siRNA specific to the GFP sequence (siGFP). As opposed to enhanced GFP, which has a half-life of about 24 h, the half-life of deGFP is approximately 2 h.[29] This short half-life allows post-translational gene silencing to be easily observed, making cells that constitutively express deGFP a useful model for investigating siRNA delivery systems. Hydrogels with encapsulated cells and siGFP gradients were cultured in serum-containing media for three days and then imaged by confocal microscopy to evaluate deGFP expression (Figure 3a).
Figure 3.
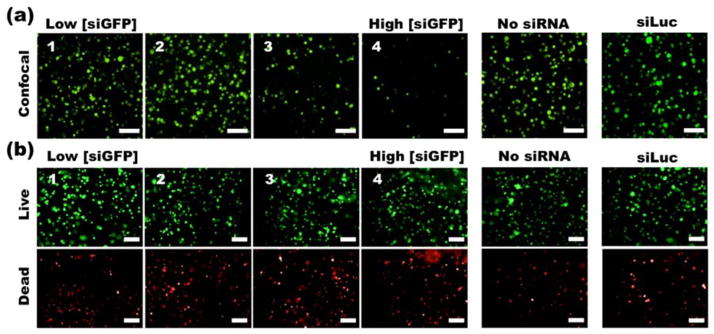
(a) Confocal fluorescence photomicrographs of deGFP HEK293 cells and (b) fluorescence photomicrographs of live/dead stained HEK293 cells. The cells were cultured in siGFP-gradient-containing, no siRNA control, or non-specific control siLuc-containing hydrogels for 3 days. Scale bars = 100 μm.
In general, silencing of deGFP was most evident in segments 3 and 4, which contain higher concentrations of siGFP. Based on the number and size of fluorescent clusters, the deGFP expression of cells appeared to decrease in a graded manner corresponding to increasing siGFP concentration in the hydrogel from segments 2 to 4. Segments 1 and 2 both showed an extent of deGFP expression that was similar to cells in hydrogels without siGFP. To verify that the sequence-specific siRNA induced knockdown, as opposed to nonspecific silencing due to off-target effects or simply the presence of siRNA-PEI nanoparticles, a control hydrogel was also prepared containing siRNA against luciferase (siLuc) at a comparable concentration to that of segment 4 in the siRNA gradient hydrogel. The extent of deGFP expression by cells in this hydrogel also appeared similar to cells in hydrogels without siRNA, confirming the specificity of induced knockdown by the siGFP in the gradient hydrogel.
To confirm that the presence of siRNA-PEI nanoparticles did not induce cytotoxicity in such a way that could have been falsely interpreted as a gradient of deGFP expression, cell viability was investigated with a fluorescein diacetate (FDA)/ethidium bromide (EB) live/dead cell staining kit, in a separate sample prepared alongside those used for evaluating deGFP expression (Figure 3b). Fluorescence photomicrographs of live/dead stained cells show that each segment of hydrogels containing the siGFP-PEI complexes, control hydrogels without complexes, and control hydrogels containing siLuc-PEI complexes, contained similar numbers of live cells. Despite the presence of some dead cells in each sample, no visually apparent difference in cell viability was observed. A separate study of cell viability after 3 d and 6 d was also performed in hydrogels containing specific concentrations of siRNA comparable to the range present in the gradient hydrogels (Figure S4 (SI)). These results suggest that the siRNA-PEI nanoparticles are not significantly cytotoxic even at concentrations similar to the highest concentration in the gradient hydrogels. Although deGFP expression and FDA live cell staining both emit a similar wavelength, fluorescence photomicrographs of FDA-stained vs. unstained samples with identical exposure conditions demonstrate that the intensity of the deGFP is negligible compared to the FDA stain (Figure S5 (SI)), confirming that the deGFP expression does not interfere with the cell viability measurement.
As the preparation of siRNA-PEI nanoparticles for this study involved the use of sucrose as a lyoprotectant, the effects of this added sucrose on deGFP activity and cell viability were also investigated to confirm that sucrose did not contribute to the observed changes in behavior of cells encapsulated in the gradient hydrogels (Figure S6 (SI)). Cells encapsulated in hydrogels containing either the same amount of sucrose as the highest gradient segment or no sucrose exhibited similar deGFP expression, and cell viability was also comparable in both conditions, suggesting that the presence of sucrose does not contribute to knockdown.
Finally, the silencing effects of the siGFP gradient were investigated at two different time points to evaluate the potential for sustaining knockdown (Figure 4). At day 2, deGFP-expression regions exhibited a similar morphology to Figure 3a, but from 2 to 6 days, these regions appeared to increase in average diameter, presumably due to proliferation of the cells within the hydrogels. deGFP silencing at day 2 followed a similar trend to Figure 3a, where segments 1 and 2 showed a negligible change in deGFP expression, but segments 2–4 exhibited graded levels of knockdown. Interestingly, deGFP expression appeared to partially return in segments 3 and 4 between 2 and 6 days, as evident by the emergence of deGFP positive cells and cell clusters. The likely proliferation of cells between days 2 and 6, as mentioned above, is a possible cause for this apparent increase in deGFP expression, as intracellular siRNA concentration will decrease with each successive cell division, and the interior of encapsulated cell clusters may be more difficult for siRNA complexes to penetrate as the cell number and cluster diameter increases. It is also possible that release of siRNA complexes out of the hydrogel between days 2 and 6 contributed to the partial return of deGFP expression, although, given the high degree of retention of siRNA complexes for at least 7 d as shown in Figure 2, this may not be likely. Importantly, the number of these deGFP positive cells visibly declined from segments 2 to 4, indicating that although some deGFP activity returned, a gradient of gene expression was still present at the later time point of 6 days.
Figure 4.
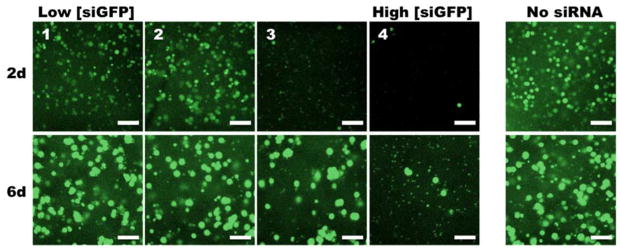
Confocal fluorescence photomicrographs of HEK293 cells cultured in siGFP-gradient-containing or no siRNA control hydrogels for 2 and 6 days. Scale bars = 100 μm.
Our work demonstrates that a simple, cost-effective technique can produce a hydrogel containing a gradient of siRNA capable of differentially altering cell gene expression. HEK293 cells and siGFP were used in this study as a proof-of-principle, but multiple different cells types and physiologically relevant siRNA or microRNA could be used in the future. Importantly, this approach permits encapsulation of targeted cells within a 3D environment that more closely resembles the native tissue environment compared to 2D surface culture, and produces a continuous distribution of siRNA, as opposed to discrete boundaries between different siRNA concentrations. The capacity to control cell gene expression in a graded manner may, therefore, facilitate the engineering of complex tissues.
Additionally, because of the many adjustable parameters in the syringe pump setup, hydrogel composition, and nanoparticle fabrication, the technology presented here is versatile and can easily be modulated. For example, siRNA concentration can be adjusted, dual gradients can be administered, flow rates can be changed to produce a steeper gradient or other, more complex concentration distributions, and the chemistry of the material can be changed to tune hydrogel physical and biochemical properties such as swelling, degradation, stiffness, or cell adhesiveness. In this manner, the properties of the siRNA gradient(s) along with those of the hydrogel itself can be controlled. Furthermore, this system could also be adapted to deliver a variety of other types of genetic material, including microRNAs, antisense oligonucleotides, and DNA plasmids. Therefore, this system is not only adaptable for potential tissue engineering applications, but it could also be used in basic science investigations to examine the impact of varying specific hydrogel properties on genetic material uptake and gene regulation over a gradient of genetic material concentrations.
3. Conclusion
In this work, spatially differential cell gene expression was achieved by incorporating a continuous gradient of siRNA into a photocrosslinkable, biodegradable DEX-HEMA hydrogel containing encapsulated HEK293 cells. Hydrogels containing linear siRNA gradients were characterized by quantifying siRNA loading and release, and by measuring polymer swelling and degradation. Bioactivity of the siRNA was demonstrated by administering siRNA targeting GFP to a cell population that was stably transfected to express deGFP. To our knowledge, this is the first report of a technology to spatially present siRNA in a continuous manner to encapsulated cells. By spatially regulating cell gene expression as done with this system, it may be possible to achieve gradients of cell function and engineered tissue properties to ultimately aid in regenerating complex tissues and tissue interfaces.
4. Experimental Section
Synthesis of DEX-HEMA macromer
The synthesis of the photopolymerizable, methacrylated DEX was performed based on a modified version of a protocol originally proposed by van Dijk-Wolthuls et al.[20b, 24a] First, 2-hydroxylethyl methacrylate imidazolylcarbamate (HEMA-IC) was synthesized by dissolving 7.1 g of 1,1-carbonyldiimidazole (CDI, Sigma, St. Louis, MO) into 105 ml of tetrahydrofuran (THF, Sigma) in a dry 500 ml round bottom flask. To this, 3.8 g of hydroxyethyl methacrylate (HEMA, Sigma) was added, along with 100 mg of 4-methoxyphenol (MEHQ, Sigma) to consume excess free radicals generated during the reaction. The reaction continued for 16 h under vacuum at room temperature (RT) and protected from light. Following the reaction, excess CDI and HEMA were removed by separation with ethyl acetate (Fisher Scientific, Pittsburgh, PA) and ultrapure deionized water (diH2O). The HEMA-IC-containing ethyl acetate layer was dried over anhydrous MgSO4 (Sigma), which was removed by filter paper (Grade 41, Whatman/GE Healthcare, Piscataway, NJ), and excess solvent was removed using a Buchi rotavapor R- 205 (Buchi Corporation, New Castle, DE). The resultant HEMA-IC was a yellow liquid and characterized in chloroform by proton nuclear magnetic resonance (1H-NMR, Unity-300 MHz, Varian, Inc., Palo Alto, CA) to determine a purity of 65%.
To prepare DEX with a theoretical degree of methacrylation of 20%, 15.0 g DEX (from Leuconostoc mesenteroides, MW= 35–45 kDa, Sigma) was dissolved in 140 ml of dimethyl sulfoxide (DMSO, Sigma). Then, 4.0 g of 4-dimethylaminopyridine (DMAP, Sigma) was added as a catalyst, and 6.1 g of the HEMA-IC solution was added. The reaction was allowed to take place for four days under vacuum at RT and protected from light. After the reaction was complete, 4.5 ml of 10 N HCl was added to neutralize the reaction, and the product was precipitated by pouring the solution into 2 L of acetone. The DEX-HEMA precipitate was then dissolved in water and dialyzed for three days at 4 °C against 7 L of diH2O, changing water three times daily, using a membrane with a molecular weight cutoff of 3,500 Da (Spectrum Laboratories, Rancho Dominguez, CA). Finally, the solution was filtered using a 0.22 μm bottle-top filter (Fisher Scientific), frozen, and lyophilized. The DEX-HEMA was characterized in D2O by 1H-NMR to determine the degree of DEX backbone methacrylation (Figure S1 (SI)).
siRNA-PEI nanoparticle synthesis and characterization
siRNA targeting GFP (siGFP; sense sequence: 5′-GCA AGC UGA CCC UGA AGU UCA U-3′; Dharmacon GFP Duplex I, Thermo Fisher Scientific, Pittsburgh, PA) was diluted in 1X Dharmacon siRNA buffer to prepare a stock solution with a concentration of 100 μM. Branched PEI (Mw = 25 kDa, Sigma) was dissolved at 1 mg/ml in nuclease-free phosphate buffered saline (PBS, Life Technologies, Grand Island, NY).
Nanoparticles with an N/P ratio of 11.5 were fabricated by first diluting stock siRNA solution in 3 w/v % sucrose (Fisher Scientific) in nuclease-free water, at a ratio of 25 μl sucrose to 1 μg siRNA. Then, stock PEI solution was separately diluted at 25 μl sucrose solution to 1.5 μg PEI. After waiting for 5 m, the siRNA solution was added to the solution of PEI. The siRNA-PEI solution was vortexed for 20 s and allowed to incubate at room temperature for 30 m to allow the complexes to form. After incubating, siRNA-PEI solutions were frozen at −80 °C for 2–4 h and then lyophilized until dry for at least 16 h. Lyophilized particles were then resuspended in dextran macromer solutions for gradient hydrogel fabrication (Figures 1, 2, 3, 4), or serum-free media for transfection of cells cultured in monolayer (Figure S2 (SI)). In gradient hydrogels prepared for evaluation of deGFP silencing at two time points (Figure 4) only, siRNA and PEI stock solutions were each diluted in 5 w/v % sucrose solution at a ratio of 30 μl to 1 μg siRNA or 1.5 μg PEI.
The size of lyophilized siRNA-PEI nanoparticles used in this study was measured using a 90 plus particle size analyzer (Brookhaven Instrument Corporation, Holtsville, NY). Lyophilized nanoparticles containing 20 μg of siRNA complexed with PEI (N = 3) were prepared in 3 w/v % sucrose solution as described above, and resuspended in 800 μl of nuclease-free water.
siRNA gradient hydrogel fabrication
DEX-HEMA solution at a concentration of 12 wt % was prepared by adding DEX-HEMA to nuclease-free PBS containing 0.05 w/v % photoinitiator (Irgacure D-2959, Sigma), and allowing it to dissolve for 1–3 h. siRNA-containing solution was prepared by reconstituting the lyophilized siRNA-PEI/sucrose in the above solution, at a concentration of 122.5 μg siRNA/ml solution, the concentration such that the predicted total amount of siRNA in each hydrogel would be 6 μg (calculation is presented in Supporting Information). DEX-HEMA solutions with and without siRNA-PEI were loaded into two separate 1 ml syringes, and each was placed in a NE-1000X programmable syringe pump (New Era Pump System Inc., Farmingdale, NY). As described previously by our group,[15] the solutions were ejected into a Y-connector (Value Plastics Inc., Fort Collins, CO) followed by a spiral mixer (TAH Industries Inc., Kensington, MD) and then into a quartz tube (National Scientific, Rockwood, TN) with a 2 mm internal diameter and 10 cm length (Figure 1a). The two solutions were each manually ejected to the Y-connector just before the spiral mixer. Then, the pumps were simultaneously activated with flow rates changing linearly from 0 to 95 μl/min or 95 to 0 μl/min over two minutes to produce a gradient gel that was 4 cm in length (Figure 1c). The gel was crosslinked with 320–500 nm UV light (~6.3 mW/cm2, Omnicure S1000, Lumen Dynamics, Ontario, CA) for 60 sec at a distance of 12 cm. The gel and quartz tube were removed and a metal rod was used to push out the gel, which was then either cut into segments with a razor blade (Figures 1, 2), or cultured in growth media directly (Figures 3, 4).
Quantification of siRNA gradient hydrogels
PEI modified with fluorescein isothiocyanate (FITC) was used for siRNA-PEI complexation to quantify the gradient by measuring fluorescence (Figure 1). Synthesis of FITC-modified PEI (FITC-PEI) was adapted from a previously reported method.[30] Branched PEI and FITC (Sigma) were added to 9 ml and 1 ml of DMSO, respectively, in separate glass vials. FITC solution was then added to the PEI solution at a ratio of 0.5 mol FITC per mol PEI (FITC Mr = 389 Da). The FITC-PEI was reacted by stirring for 1 h at RT protected from light. Next, the solution was added to 90 ml of diH2O and dialyzed (MWCO=3,500 Da) for 3 d against diH2O, changing water three times daily. The FITC-PEI solution was then lyophilized. The reaction between primary amines and isothiocyanate groups is known to produce stable isothiourea bonds,[31] and the high amine content from PEI in relation to isothiocyanate groups in FITC suggests that the reaction will proceed to completion.
siRNA/FITC-modified-PEI nanoparticles were formed and resuspended in DEX-HEMA solution using the above method for preparing nanoparticles. Gradient hydrogels were then fabricated as described. Each gel (N = 4) was cut into eight equal segments 0.5 cm in length. Segments were then individually dissolved in 500 μl of 1 N NaOH for 15 m in wells of a 48 well plate. To make a standard curve, a 4 cm gel containing 6 μg of siRNA at a uniform concentration was made in a quartz tube without using the syringe pumps, and this gel was dissolved in 500 μl of 1 N NaOH for 15 m similarly. The prepared solutions were measured directly by a fluorescence plate reader (fmax, Molecular Devices, Inc., CA).
Measurement of released siRNA
Hydrogels containing a gradient of siRNA-PEI nanoparticles (N = 4) were prepared as described above and cut into four 1 cm segments to evaluate release kinetics (Figure 2). Each segment was transferred to 1.5 ml nuclease-free microcentrifuge tubes containing 1 ml of nuclease-free PBS, and incubated at 37 °C. The PBS was removed and replaced at predetermined time points.
The siRNA/PEI complexes in the release solutions were dissociated by the addition of negatively charged heparin (Sigma), which competes with the siRNA for binding to PEI.[32] In individual microcentrifuge tubes, 5 μl of a 10 mg/ml heparin solution was added to 10 μl of each sample. The tubes were vortexed and incubated at RT for 30 min. The contents of each tube were then transferred to wells of an all-black 96 well assay plate, and 90 μl of Quant-iT Ribogreen Reagent (Invitrogen, Life Technologies, Grand Island, NY) was added to each well. When bound to RNA, the Ribogreen RNA Reagent fluoresces with a maximum excitation of 485 nm and a maximum emission of 538 nm, and the fluorescence intensity is proportional to the RNA concentration of the solution.[33] The plate was shaken for 5 m to mix the reagent and samples, and fluorescence was measured with a plate reader. Serial dilutions of siRNA were prepared as a standard curve.
Bioactivity of siRNA in encapsulated cells
For cell-encapsulated siRNA gradient hydrogels, DEX-HEMA macromer solution was filtered through a 0.22 μm syringe filter, and lyophilized siRNA-PEI was resuspended. The siRNA-PEI nanoparticles used in siRNA gradient hydrogels to evaluate bioactivity and viability at 3 d (Figure 3) were fabricated as described above, using 3 w/v% sucrose solution at a ratio of 25 μl per 1 μg of siRNA or 1.5 μg of PEI. For siRNA gradient hydrogels used to evaluate bioactivity at 2 d and 6 d (Figure 4), nanoparticles were fabricated by the same method but using 5 w/v% sucrose solution at a ratio of 30 μl per 1 μg of siRNA or 1.5 μg of PEI. deGFP expressing HEK293 cells (generously gifted by Piruz Nahreini, PhD (University of Colorado Health Sciences Center)) were trypsinized and resuspended in macromer solutions, both with and without siRNA, at a concentration of 7.14 × 10⁶ cells/ml, to allow for encapsulation of 1 × 10⁶ cells per 4 cm gel (140 μl in volume). These solutions were then loaded into separate syringes, and gradient-containing hydrogels were fabricated as described above in sterile conditions using a biosafety cabinet. After fabrication, the entire gel was then transferred to a 45 mm tissue culture plate containing 6 ml of Dulbecco’s Modified Eagle Medium High Glucose (DMEM-HG, HyClone, Logan, UT) with 10% characterized Fetal Bovine Serum (FBS, HyClone), and cultured in a humidified incubator at 37 °C with 5% CO2.
Solutions for control gels containing sucrose alone were prepared by suspending lyophilized 3 w/v% sucrose solution into DEX-HEMA macromer solution such that the sucrose concentration would be uniform and equivalent to that of the 1 cm segment in a gradient gel containing the highest amount of siRNA. Solutions for gels containing siRNA against luciferase (siLuc; sense sequence: 5′-GAU UAU GUC CGG UUA UGU AUU-3′; Thermo Fisher Scientific), as a non-specific control, were prepared by similarly suspending lyophilized siRNA-PEI in DEX-HEMA macromer solution at a concentration equivalent to the 1 cm gradient segment with the highest amount of siRNA. DEX-HEMA macromer solutions with no additional components were used to make control gels without sucrose and/or siRNA-PEI nanoparticles. Cells were then suspended at 7.14 × 10⁶ cells/ml in each solution. All control gels were manually pipetted into quartz tubes without using the dual pump apparatus, photocrosslinked for 60 s, then pushed out of the tube. Gels were then cut into 1 cm segments and placed into wells of a 24-well tissue culture plate containing 0.5 ml of DMEM-HG + 10% FBS, before culturing in an incubator.
After 2, 3 or 6 days of culture, cell-encapsulated siRNA gradient hydrogels were cut into 1 cm segments and transferred to wells of a 24 well plate containing 0.5 ml of growth media. For all experiments, each 1 cm sample was imaged to qualitatively evaluate deGFP expression using a confocal microscope (LSM 510, Carl Zeiss Microscopy, Jena, Germany). Images were taken at the longitudinal center of each 1 cm segment, every 10 μm in the z-plane for 100 μm, starting 50 μm from the bottom of each gel. All images were compiled into a single projection. Over all separate experimental trials performed to examine bioactivity, out of a total of eight cell-encapsulated gradient hydrogels fabricated, five showed graded deGFP knockdown consistent with the confocal micrographs in Figures 3a and 4. Two of the remaining three hydrogels still showed significant knockdown in the segment with the highest concentration of siRNA compared to the segment with the lowest concentration of siRNA.
Viability of encapsulated cells
Using a separate hydrogel fabricated in the same batch as the hydrogels for analyzing bioactivity described above, at day 3 a live/dead assay was performed consisting of fluorescein diacetate (FDA; Sigma), which stains the cytoplasm of viable cells green, and ethidium bromide (EB; Sigma), which stains the nuclei of nonviable cells orangered (Figure 3b). The staining solution was freshly prepared by mixing 100 μl of FDA solution (1.5 mg/mL of FDA in DMSO) and 50 μl of EB solution (1 mg/mL of EB in PBS) with 30 μl of PBS (pH 8). The gradient gels were cut into four 1 cm segments and transferred into 24-well tissue culture plates, and 0.5 ml of DMEM-HG + 10% FBS and 20 μL of staining solution was added into each well and incubated for 3–5 m at RT. Hydrogels were imaged approximately at the longitudinal and radial center of each 1 cm segment using a fluorescence microscope (ECLIPSE TE 300; Nikon, Tokyo, Japan) equipped with a digital camera (Retiga-SRV; Qimaging, Burnaby, BC, Canada).
Cell viability was also separately evaluated in hydrogels containing uniform concentrations of siRNA comparable to the range of concentrations within the gradient hydrogels to confirm that the siRNA-PEI nanoparticles were cytocompatible through 6 d of culture (Figure S4 (SI)). Lyophilized siRNA-PEI prepared with 5 w/v% sucrose was resuspended in DEX-HEMA macromer solution at concentrations of 6 μg, 9 μg, and 12 μg per 140 μl of macromer solution. No siRNA-PEI or additional components were added to macromer solution used in a 0 μg siRNA control hydrogel. Cells were suspended at 7.14 × 10⁶ cells/ml, and one hydrogel for each condition was fabricated in the quartz tube and cultured in a 45 mm tissue culture plate containing 6 ml of DMEM-HG + 10% FBS. After 3 d and 6 d of culture, hydrogels were cut into four 1 cm segments, transferred into 24-well tissue culture plates, stained with FDA and EB, and imaged with a widefield fluorescence microscope and digital camera as described for gradient hydrogels earlier.
To ensure that the signal due to deGFP expression was not interfering with the signal from the FDA stain, fluorescence micrographs were taken of DEX-HEMA hydrogels containing encapsulated deGFP-expressing HEK293 cells, with or without the FDA stain, using the same exposure settings used for imaging cells stained with FDA (Figure S5 (SI)). As green signal is completely absent in the image of the unstained hydrogel, it can be concluded that the deGFP expression is too weak to interfere with the FDA stain.
Statistical analysis
Statistical significance was determined using Tukey–Kramer Multiple Comparisons Test with one-way analysis of variance (ANOVA) using In-Stat software (GraphPad Software, La Jolla, CA). A p value < 0.05 was considered statistically significant.
Supplementary Material
Acknowledgments
The authors gratefully acknowledge funding from the National Institutes of Health (R56DE022376), the Department of Defense Congressionally Directed Medical Research Programs (OR110196), and a New Scholar in Aging grant from the Ellison Medical Foundation.
Footnotes
Supporting Information is available from the Wiley Online Library or from the author.
Contributor Information
Michael C. Hill, Department of Biomedical Engineering, Case Western Reserve University, 10900 Euclid Ave., Cleveland, Ohio 44106, USA
Dr. Minh K. Nguyen, Department of Biomedical Engineering, Case Western Reserve University, 10900 Euclid Ave., Cleveland, Ohio 44106, USA
Dr. Oju Jeon, Department of Biomedical Engineering, Case Western Reserve University, 10900 Euclid Ave., Cleveland, Ohio 44106, USA
Prof. Eben Alsberg, Email: eben.alsberg@case.edu, Department of Biomedical Engineering, Case Western Reserve University, 10900 Euclid Ave., Cleveland, Ohio 44106, USA. Department of Orthopaedic Surgery, Case Western Reserve University, 10900 Euclid Ave., Cleveland, Ohio 44106, USA. National Center for Regenerative Medicine, Division of General Medical Sciences, Case Western Reserve University, 10900 Euclid Ave., Cleveland, Ohio 44106, USA
References
- 1.Vacanti JP, Langer R. The Lancet. 1999;354:S32. doi: 10.1016/s0140-6736(99)90247-7. [DOI] [PubMed] [Google Scholar]
- 2.a) Berthiaume F, Maguire TJ, Yarmush ML. Annu Rev Chem Biomol Eng. 2011;2:403. doi: 10.1146/annurev-chembioeng-061010-114257. [DOI] [PubMed] [Google Scholar]; b) Lee KY, Mooney DJ. Chem Rev. 2001;101:1869. doi: 10.1021/cr000108x. [DOI] [PubMed] [Google Scholar]
- 3.Lutolf MP, Hubbell JA. Nat Biotech. 2005;23:47. doi: 10.1038/nbt1055. [DOI] [PubMed] [Google Scholar]
- 4.Ulloa F, Briscoe J. Cell Cycle. 2007;6:2640. doi: 10.4161/cc.6.21.4822. [DOI] [PubMed] [Google Scholar]
- 5.Wang F. Cold Spring Harbor Perspectives in Biology. 2009;1:a002980. doi: 10.1101/cshperspect.a002980. [DOI] [PMC free article] [PubMed] [Google Scholar]
- 6.Hoemann CD, Lafantaisie-Favreau CH, Lascau-Coman V, Chen G, Guzman-Morales J. J Knee Surg. 2012;25:85. doi: 10.1055/s-0032-1319782. [DOI] [PubMed] [Google Scholar]
- 7.a) Clark J, Stechschulte DJ. J Anat. 1998;192:605. doi: 10.1046/j.1469-7580.1998.19240605.x. [DOI] [PMC free article] [PubMed] [Google Scholar]; b) Doschak MR, Zernicke RF. J Musculoskelet Neuronal Interact. 2005;5:35. [PubMed] [Google Scholar]
- 8.Moffat KL, Sun WHS, Pena PE, Chahine NO, Doty SB, Ateshian GA, Hung CT, Lu HH. Proc Natl Acad Sci USA. 2008;105:7947. doi: 10.1073/pnas.0712150105. [DOI] [PMC free article] [PubMed] [Google Scholar]
- 9.Mohan N, Detamore M. In: Structural Interfaces and Attachments in Biology. Thomopoulos S, Birman V, Genin GM, editors. Springer; New York: 2013. p. 299. [Google Scholar]
- 10.a) Slaughter BV, Khurshid SS, Fisher OZ, Khademhosseini A, Peppas NA. Adv Mater. 2009;21:3307. doi: 10.1002/adma.200802106. [DOI] [PMC free article] [PubMed] [Google Scholar]; b) Nguyen MK, Alsberg E. Prog Polym Sci. 2014;39:1235. doi: 10.1016/j.progpolymsci.2013.12.001. [DOI] [PMC free article] [PubMed] [Google Scholar]
- 11.Wong JY, Velasco A, Rajagopalan P, Pham Q. Langmuir. 2003;19:1908. [Google Scholar]
- 12.a) Carr LR, Krause JE, Ella-Menye JR, Jiang S. Biomaterials. 2011;32:8456. doi: 10.1016/j.biomaterials.2011.07.062. [DOI] [PubMed] [Google Scholar]; b) Wang X, Wenk E, Zhang X, Meinel L, Vunjak-Novakovic G, Kaplan DL. J Controlled Release. 2009;134:81. doi: 10.1016/j.jconrel.2008.10.021. [DOI] [PMC free article] [PubMed] [Google Scholar]
- 13.Lo CT, Throckmorton DJ, Singh AK, Herr AE. Lab Chip. 2008;8:1273. doi: 10.1039/b804485f. [DOI] [PubMed] [Google Scholar]
- 14.a) Burdick JA, Khademhosseini A, Langer R. Langmuir. 2004;20:5153. doi: 10.1021/la049298n. [DOI] [PubMed] [Google Scholar]; b) Cheng SY, Heilman S, Wasserman M, Archer S, Shuler ML, Wu M. Lab Chip. 2007;7:763. doi: 10.1039/b618463d. [DOI] [PubMed] [Google Scholar]
- 15.Jeon O, Alt DS, Linderman SW, Alsberg E. Adv Mater. 2013;25:6366. doi: 10.1002/adma.201302364. [DOI] [PMC free article] [PubMed] [Google Scholar]
- 16.Fire A, Xu S, Montgomery MK, Kostas SA, Driver SE, Mello CC. Nature. 1998;391:806. doi: 10.1038/35888. [DOI] [PubMed] [Google Scholar]
- 17.a) Takei Y, Kadomatsu K, Yuzawa Y, Matsuo S, Muramatsu T. Cancer Res. 2004;64:3365. doi: 10.1158/0008-5472.CAN-03-2682. [DOI] [PubMed] [Google Scholar]; b) Schiffelers RM, Ansari A, Xu J, Zhou Q, Tang Q, Storm G, Molema G, Lu PY, Scaria PV, Woodle MC. Nucleic Acids Res. 2004;32:e149. doi: 10.1093/nar/gnh140. [DOI] [PMC free article] [PubMed] [Google Scholar]; c) Ali HM, Urbinati G, Raouane M, Massaad-Massade L. Expert Rev Clin Pharmacol. 2012;5:403. doi: 10.1586/ecp.12.33. [DOI] [PubMed] [Google Scholar]; d) Krebs MD, Alsberg E. Chem Eur J. 2011;17:3054. doi: 10.1002/chem.201003144. [DOI] [PMC free article] [PubMed] [Google Scholar]
- 18.Gao Z, Wang Z, Shi Y, Lin Z, Jiang H, Hou T, Wang Q, Yuan X, Zhao Y, Wu H, Jin Y. Plast Reconstr Surg. 2006;118:1328. doi: 10.1097/01.prs.0000239537.77870.2c. [DOI] [PubMed] [Google Scholar]
- 19.a) Motomura H, Niimi H, Sugimori K, Ohtsuka T, Kimura T, Kitajima I. Biochem Biophys Res Commun. 2007;357:997. doi: 10.1016/j.bbrc.2007.04.035. [DOI] [PubMed] [Google Scholar]; b) Ramasubramanian A, Shiigi S, Lee G, Yang F. Pharm Res. 2011;28:1328. doi: 10.1007/s11095-011-0406-9. [DOI] [PubMed] [Google Scholar]; c) Andersen MØ, Nygaard JV, Burns JS, Raarup MK, Nyengaard JR, Bunger C, Besenbacher F, Howard KA, Kassem M, Kjems J. Mol Ther. 2010;18:2018. doi: 10.1038/mt.2010.166. [DOI] [PMC free article] [PubMed] [Google Scholar]; d) Nguyen MK, Jeon O, Krebs MD, Schapira D, Alsberg E. Biomaterials. 2014;35:6278. doi: 10.1016/j.biomaterials.2014.04.048. [DOI] [PMC free article] [PubMed] [Google Scholar]
- 20.a) Krebs MD, Jeon O, Alsberg E. J Am Chem Soc. 2009;131:9204. doi: 10.1021/ja9037615. [DOI] [PubMed] [Google Scholar]; b) Nguyen K, Dang PN, Alsberg E. Acta Biomater. 2013;9:4487. doi: 10.1016/j.actbio.2012.08.012. [DOI] [PMC free article] [PubMed] [Google Scholar]
- 21.a) Cao H, Jiang X, Chai C, Chew SY. J Controlled Release. 2010;144:203. doi: 10.1016/j.jconrel.2010.02.003. [DOI] [PubMed] [Google Scholar]; b) Rujitanaroj P-o, Wang Y-C, Wang J, Chew SY. Biomaterials. 2011;32:5915. doi: 10.1016/j.biomaterials.2011.04.065. [DOI] [PubMed] [Google Scholar]; c) Chen M, Gao S, Dong M, Song J, Yang C, Howard KA, Kjems J, Besenbacher F. ACS Nano. 2012;6:4835. doi: 10.1021/nn300106t. [DOI] [PubMed] [Google Scholar]
- 22.a) Nelson CE, Gupta MK, Adolph EJ, Shannon JM, Guelcher SA, Duvall CL. Biomaterials. 2012;33:1154. doi: 10.1016/j.biomaterials.2011.10.033. [DOI] [PMC free article] [PubMed] [Google Scholar]; b) Nelson CE, Kim AJ, Adolph EJ, Gupta MK, Yu F, Hocking KM, Davidson JM, Guelcher SA, Duvall CL. Adv Mater. 2014;26:607. doi: 10.1002/adma.201303520. [DOI] [PMC free article] [PubMed] [Google Scholar]
- 23.Andersen MØ, Le DQS, Chen M, Nygaard JV, Kassem M, Bünger C, Kjems J. Adv Funct Mater. 2013;23:1. [Google Scholar]
- 24.a) van Dijk-Wolthuls WNE, Tsang SKY, Kettenes-van den Bosch JJ, Hennink WE. Polymer. 1997;38:6235. [Google Scholar]; b) Raemdonck K, Van Thienen TG, Vandenbroucke RE, Sanders NN, Demeester J, De Smedt SC. Adv Funct Mater. 2008;18:993. [Google Scholar]; c) Naeye B, Raemdonck K, Remaut K, Sproat B, Demeester J, De Smedt SC. Eur J Pharm Sci. 2010;40:342. doi: 10.1016/j.ejps.2010.04.010. [DOI] [PubMed] [Google Scholar]
- 25.a) Hennink WE, Talsma H, Borchert JCH, De Smedt SC, Demeester J. J Controlled Release. 1996;39:47. [Google Scholar]; b) van Dijk-Wolthuis WNE, Hoogeboom JAM, van Steenbergen MJ, Tsang SKY, Hennink WE. Macromolecules. 1997;30:4639. [Google Scholar]; c) Peppas NA, Huang Y, Torres-Lugo M, Ward JH, Zhang J. Annu Rev Biomed Eng. 2000;2:9. doi: 10.1146/annurev.bioeng.2.1.9. [DOI] [PubMed] [Google Scholar]
- 26.Kunihiko G. In: Solution Properties of Polysaccharides. Brant DA, editor. Vol. 150. American Chemical Society; 1981. p. 415. [Google Scholar]
- 27.Lin CC, Metters AT. Adv Drug Deliv Rev. 2006;58:1379. doi: 10.1016/j.addr.2006.09.004. [DOI] [PubMed] [Google Scholar]
- 28.Zustiak SP, Leach JB. Biotechnol Bioeng. 2011;108:197. doi: 10.1002/bit.22911. [DOI] [PMC free article] [PubMed] [Google Scholar]
- 29.Li X, Zhao X, Fang Y, Jiang X, Duong T, Fan C, Huang CC, Kain SR. J Biol Chem. 1998;273:34970. doi: 10.1074/jbc.273.52.34970. [DOI] [PubMed] [Google Scholar]
- 30.Gosselin MA, Guo W, Lee RJ. Bioconjugate Chem. 2001;12:989. doi: 10.1021/bc0100455. [DOI] [PubMed] [Google Scholar]
- 31.Hermanson GT. Bioconjugate Techniques. Academic Press, Elsevier; San Diego: 2010. p. 169. [Google Scholar]
- 32.a) Lee SY, Huh MS, Lee S, Lee SJ, Chung H, Park JH, Oh YK, Choi K, Kim K, Kwon IC. J Controlled Release. 2010;141:339. doi: 10.1016/j.jconrel.2009.10.007. [DOI] [PubMed] [Google Scholar]; b) Hom C, Lu J, Liong M, Luo H, Li Z, Zink JI, Tamanoi F. Small. 2010;6:1185. doi: 10.1002/smll.200901966. [DOI] [PMC free article] [PubMed] [Google Scholar]
- 33.Jones LJ, Yue ST, Cheung CY, Singer VL. Anal Biochem. 1998;265:368. doi: 10.1006/abio.1998.2914. [DOI] [PubMed] [Google Scholar]
Associated Data
This section collects any data citations, data availability statements, or supplementary materials included in this article.