

Abstract
Biomarkers that indicate the severity of hypoxic ischemic brain injury, response to treatment, and predict neurodevelopmental outcomes are urgently needed to improve the care of affected neonates. We hypothesize that sequentially obtained plasma metabolomes will provide indicators of brain injury and repair, allowing for prediction of neurodevelopmental outcomes. 33 Macaca Nemestrina underwent 0, 15, or 18 minutes of in utero umbilical cord occlusion (UCO) to induce hypoxic ischemic encephalopathy (HIE), then were delivered by hysterotomy, resuscitated and stabilized. Serial blood samples were obtained at baseline (cord blood), 0.1, 24, 48 and 72 hours of age. Treatment groups included non-asphyxiated controls (N=7), untreated UCO (N=11), UCO + Hypothermia (HT) (N=6), and UCO + HT + erythropoietin (Epo) (n=9). Metabolites were extracted and analyzed using comprehensive two-dimensional gas chromatography coupled with time-of-flight mass spectrometry (GC x GC-TOFMS) and quantified by parallel factor analysis (PARAFAC). Using non-targeted discovery-based methods, we identified 63 metabolites as potential biomarkers. The changes in metabolite concentrations were characterized and compared between treatment groups. Further comparison determined that 8 metabolites (arachidonic acid, butanoic acid, citric acid, fumaric acid, lactate, malate, propanoic acid, and succinic acid) correlated with early and/or long-term neurodevelopmental outcomes. The combined outcomes of death or cerebral palsy correlated with citric acid, fumaric acid, lactate, and propanoic acid. This change in circulating metabolome after UCO may reflect cellular metabolism and biochemical changes in response to severity of brain injury and have potential to predict neurodevelopmental outcomes.
Keywords: Hypoxic-ischemic encephalopathy, metabolomics, neuroprotection, perinatal asphyxia, nonhuman primate
INTRODUCTION
Hypoxic-ischemic encephalopathy (HIE) is a significant cause of neonatal encephalopathy. Although neonatal infection, stroke and metabolic abnormalities can also cause encephalopathy, HIE accounts for about 60% of cases [1]. The incidence of HIE ranges between 1–7 per 1000 births [2], with most estimates ranging between 1–3 per 1000 in developed countries. Up to 12,000 infants are affected each year in the US. Globally, HIE accounts for 22% of annual neonatal deaths, totaling 814,000 deaths in 2008 [3]. Therapeutic hypothermia (HT) modestly reduces the combined outcomes death or severe neurodevelopmental impairment (NDI) from 65% to approximately 50% [4,5]. Clinicians currently use a combination of clinical criteria (Apgar scores, Sarnat scores), laboratory tests (lactic acid, pH, base deficit), with or without amplitude-integrated electroencephalography (aEEG) to determine eligibility for HT and predict outcomes. Unfortunately, these varied indices are imprecise and may lead to unnecessary therapy, or exclusion of a child that would benefit from treatment [4,5]. New biomarkers are needed to better distinguish patients that can benefit from HT from those for whom treatment might be either unnecessary or futile.
When an infant experiences the combined disruption of cerebral perfusion and oxygenation, if the insult is of sufficient severity, the clinical syndrome of HIE results. Brain injury is characterized by an initial period of cell injury and death followed over the next 48–72 hours by secondary energy failure, inflammation, cytotoxic edema, nitric oxide synthesis, mitochondrial dysfunction, and further accumulation of excitotoxins and secondary cell death [6]. Preclinical animal studies can be particularly useful in the search for reproducible diagnostic and predictive biomarkers because of the ability to track changes in expression of these putative factors over time after a defined injury. This can provide information about timing of injury as well as severity of injury, both of which are important when considering therapeutic options. We postulate that sequential sampling of neonatal plasma will reveal metabolites that can differentiate whether an infant was exposed to hypoxia in utero, and potentially inform whether they are responding to therapy over time.
Metabolomics is the quantitative analysis of low-molecular weight metabolites, including intermediates, signaling molecules and components of metabolic pathways. This approach may be a useful way to identify biomarkers that define the timing and severity of brain injury [7,8]. We previously developed a nonhuman primate model of HIE using in utero umbilical cord occlusion (UCO) [9,10]. We have identified metabolic profiles characteristic of normal birth transition [11] and acute birth asphyxia [8] using two-dimensional gas chromatography with time-of-flight mass spectrometry (GC x GC – TOFMS). We continue this line of inquiry to examine how metabolites change over the first 72 hours after birth, and whether treatment of HIE with HT alone or with erythropoietin (Epo) alter plasma metabolites. We compare the metabolites present in timed plasma samples from control, untreated HIE and treated HIE animals, and we correlate detected metabolites with neurodevelopmental outcomes to identify new biomarkers.
METHODS AND MATERIALS
Primate delivery protocol
56 Macaca nemestrina were delivered by hysterotomy under general anesthesia with sevoflurane at 168 ± 2 days gestation (term = 173 days) and a subset of 33 animals had blood samples processed for metabolomic analysis, and are included in this study [12]. Prior to delivery, the baseline blood sample (0 minutes) was obtained by venipuncture from the umbilical cord and a 2.5 French umbilical arterial catheter (Vygon, Montgomeryville, PA, USA) was installed into the ascending aorta. To induce perinatal asphyxia, 26 animals underwent UCO in utero for 15 or 18 minutes and these durations were grouped for subsequent analysis. Seven non-asphyxiated control animals were also surgically delivered after umbilical artery catheter placement. The primates were resuscitated as needed by a team of neonatologists using standardized neonatal resuscitation procedures. Resuscitations included endotracheal intubation, positive pressure ventilation, chest compressions, and bolus epinephrine as indicated. A covered heating pad, radiant warmer, and polyethylene sheet were used to provide thermal support during stabilization, then the animals were moved to a thermal-neutral incubator. Upon delivery, APGAR scores, vital signs, and serial laboratory parameters were recorded. At delivery, a timer was started and postnatal blood samples were obtained at 5 minutes, 24, 48, and 72 hours for metabolomic analysis. Samples were collected into heparinized syringes, transferred to micro tubes and centrifuged at room temperature for 10 min at 1000×G, then 110 μL plasma aliquots were collected and frozen at −80 °C until metabolite extraction.
Treatment groups
UCO animals were treated with saline (N=11), therapeutic hypothermia (HT) N=6, or combined erythropoietin (Epo)+HT (N=9). HT was initiated within 30 min of birth using an automated cooling apparatus donated by Olympic Cool-Cap, NATUS to effect whole body cooling to 33.5°C for 72 hours. Epo treatment (Epogen®, Epoetin Alfa Recombinant, Amgen) initially followed a high-dose Epo regimen of 3500 U/kg i.v. by 0.5 hours of birth, then bolus doses of 2500 U/Kg i.v. at 24 and 48 hours (n=4), but the Epo dosing regimen was adjusted after the first year to 1000 U/kg i.v. at 0.5, 24, and 48 hours, and 1000 U/kg s.c. at 7 days (n=5).
Metabolite extraction, derivatization, and instrumentation
Extraction of the metabolites from the plasma was performed using an methanol:water solution as previously reported [8,11]. Briefly, samples were sonicated for 2 min, cooled on ice, then centrifuged at 15,000×G for 10 min to remove cellular debris. 200 μl aliquots of the supernatant were transferred to an insert vial and evaporated to dryness in preparation for gas chromatography (GC). A two-step chemical derivatization procedure involving methoximation and trimethylsilylation was performed on the extracts to improve thermal stability and volatility of the metabolites for GC-based analysis [8,11]. A 1 μl volume of each derivatized sample was injected in split-less mode onto the GC x GC-TOFMS instrument (LECO, St. Joseph, MI, USA). Each sample was run in triplicate to generate chromatograms by GC x GC-TOFMS (a total of 495 chromatograms analyzed), to ensure instrument precision. The first column, 20 m × 250 μm i.d. × 0.5 μm Rtx-5MS (Restek, Bellefonte, PA, USA), separated the metabolites primarily by volatility. At 1.5 s intervals, eluent from the first column was transferred to a second column by thermal modulation. The second column, 2 m × 180 μm i.d. × 0.2 μm Rtx-200MS (Restek, Bellefonte, PA, USA), separated the metabolites primarily based on polarity. The GC was operated in constant flow mode at 1 mL/min at the outlet. The first column was held at 60 °C for 0.25 min, and then increased at 8 °C/min to 280 °C, where it was held for 10 min. The second column was held at 78 °C for 1.25 min, and then increased at 8 °C/min to 290 °C, where it was held for 10 min. The transfer line temperature was 280 °C, and the modulator tracked the second column temperature program with a +40 °C offset. The modulator applied a 0.40 s hot pulse time with 0.35 s cool time between stages. Eluent from the second column was detected by the TOFMS using electron impact ionization at −70 eV to generate ion fragments, which were collected from m/z 40 to 600 at 100 mass spectra per second. The TOFMS ion source was set to 250 °C and the detector voltage was 1600 V. Data were collected with the LECO ChromaTOF software v 3.32 (LECO, St. Joseph, MI, USA).
Data Preprocessing and Normalization
A non-targeted discovery-based approach using the mathematical algorithm referred to as the Fisher-ratio method [13] was used to locate metabolites in the GC x GC-TOFMS data that exhibited potentially significant changes in metabolite concentrations during the experimental time course. Time points 24, 48, and 72 hours were compared to prenatal cord sample (0 minutes), providing a list of retention times in both GC separation dimensions for metabolites that demonstrated a large concentration change over the experimental time course. Metabolites located by Fisher-ratio analysis were primarily identified by retention time and mass spectral matching using an in-house library of derivatized metabolite standards that were processed and categorized using the same instrumentation. For the remaining metabolites that did not have retention time matching to the in-house library, tentative identification assignment was provided only using external mass spectral libraries, including the NIST library and KEGG database. Quantification of the identified metabolites was performed using Parallel Factor Analysis (PARAFAC), a mathematical deconvolution algorithm for GC x GC-TOFMS data that provides the integrated m/z signal for each identified metabolite peak [14].
All of the PARAFAC signals (one from each identified metabolite per GC x GC-TOFMS chromatogram) were normalized using the total ion current (TIC) method [8,15,16]. The GC x GC-TOFMS data from the zero time point (cord blood sample) for each animal was used to normalize between animals. The GC x GC-TOFMS chromatograms for each animal’s zero time point were baseline corrected, and all TIC signals were summed for a representative two-dimensional section of the GC × GC chromatogram containing the derivatized metabolites (i.e., excluding the solvent and derivatization reagent peaks), producing a summed TIC signal for each chromatogram. This summed TIC signal for each GC x GC-TOFMS chromatogram is proportional to the mass injected per sample, and was used to adjust for systematic variation in individual metabolite signals due to biological, sample preparation, and instrument variation over the course of the experiment. The ratio of the summed TIC signal between a given chromatogram and a designated target chromatogram is used to normalize the quantified metabolite signals between the two samples. At baseline (prior to cord occlusion), no differences were expected between one animal to the next. Therefore, the metabolite signals at subsequent time points for a given animal were normalized by the ratio of the summed TIC signal for that animal’s zero time point chromatogram versus the summed TIC signal of the zero time point chromatogram for the first animal in the study (C1), facilitating quantitative comparisons between animals.
Developmental evaluations
Developmental assessment was performed by the Infant Primate Research Laboratory at the University of Washington, as previously described [9]. Briefly, age at self-feeding and temperature stability, newborn reflexes, muscle tone, behavioral state, and neurological responses were assessed 5d per week for the first 20d, using tests based on the Brazelton Neonatal Behavioral Assessment Scale. Neonatal activity and diurnals were collected every 4h daily to determine onset or delay of diurnal cyclicity. Evaluators, who were blinded to treatment, assigned an overall assessment of motor dysfunction. Object permanence testing paradigm, screening for deficits in visual acuity, novelty preference, social and motor behavior in mixed-sex play groups, and a standard series of learning and memory problems utilizing the Wisconsin General Test Apparatus were administered by trained evaluators.
To assess for the presence or absence of cerebral palsy, animals were assessed by a physical therapist with a special interest in neonates. Sequential exams were done at one week, one month, and 8 months to document any evidence of motor abnormalities and contractures. Assessment included evaluation of their ability to control active movement. Muscle tone at each joint was graded on the Ashford scale of 0 (normal) to 4 (affected parts rigid in flexion or extension) [17].
Statistical Analysis
Normalized data were transformed to log intensities prior to statistical analysis. The log transformation results in more symmetric distributions (Figure 1), and facilitates application of linear regression models and other standard statistical methods. To reduce the bias due to significant number of missing intensities, metabolites with <20 observations across time points and subjects were excluded from further considerations (Figure 2). An analysis of variance (ANOVA) model was used to check whether each of remaining metabolites had significantly different log intensities at the baseline among different treatments (at alpha=0.05 significance level). Considering the randomization of samples into treatment groups at the baseline, differences in log intensities among treatment groups are likely artifacts of the profiling step, and a total of n=12 metabolites were hence excluded from further considerations. The log intensities for the resulting data set do not indicate a difference among different treatment groups (Figure 3, ANOVA p-value = 0.785). The resulting data set included 51 metabolites.
Figure 1. Histogram of original and log-transformed metabolic intensities.
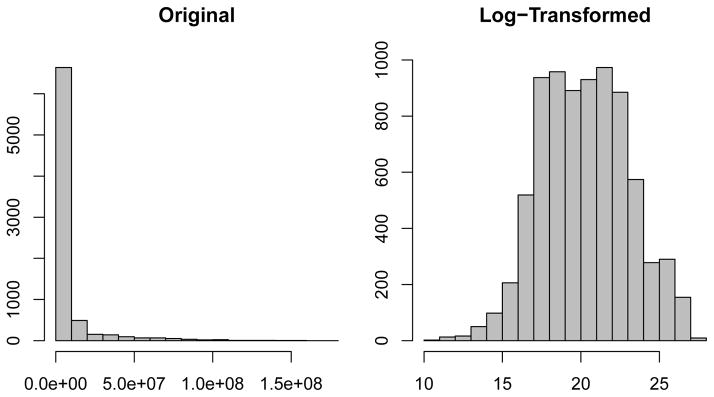
The log transformation results in a symmetric distribution amenable to standard statistical analysis, including linear regression.
Figure 2. Barplot of the number of observed values across subjects and time points per metabolite.

Metabolites with less than 20 total observed values (horizontal red dashed line) were removed from the analysis.
Figure 3. Boxplots showing the distribution of log-transformed metabolic intensities across samples, colored by treatment group.

No significant differences were observed among treatment groups, suggesting that the adjustment by cord blood correctly removes batch effects. In addition to this overall quality check, an ANOVA test was used to determine if log intensities of individual metabolites were significantly different among different treatment groups at time 0. Metabolites with evidence of differences in log intensities were not included in the remaining of the analysis; see Methods for details.
Missing values for the remaining metabolites in the data were imputed using a two-pronged strategy. For metabolites with less than 10% missingness, a linear regression model was fit to sample with complete information on the two time points closest to times with missing intensities. These models were then used to predict the log intensities at time points with missing intensities. The missing values for metabolites with more than 10% missingness were imputed by the average log intensity of all samples with existing value at each time point.
Two-sample Wilcoxon rank tests were used to compare the log-intensities of each metabolite at any given time point between different treatment groups and control. P-values for significance of differences between each treatment group and control were adjusted for multiple comparisons to control the false discovery rate (FDR) [18]. A total of n=12 metabolites demonstrated significantly different temporal patterns among treatment groups at 10% FDR level (Table 2), and were used to identify metabolites associated with early and/or long-term neurodevelopmental outcome. A linear regression model was fit for each outcome and each metabolite to determine whether the intensities of the metabolite over time are associated with the outcomes. FDR-adjusted p-values were used to identify metabolites associated with at least one neurodevelopmental outcome (Table 3).
Table 2.
FDR-adjusted p-values for interactions of time and treatment factors.
| 5 Minutes | 48 Hours | 72 Hours | |||||||
|---|---|---|---|---|---|---|---|---|---|
| Analyte | UCO− saline | UCO− HT | UCO− HT+Epo | UCO− saline | UCO−HT | UCO− HT+Epo | UCO− saline | UCO−HT | UCO− HT+Epo |
| Aminomalonic Acid | 1.000 | 1.000 | 0.643 | 0.449 | 0.361 | 0.449 | 0.001 | 0.056 | 0.001 |
| Arachidonic Acid | 0.006 | 0.019 | 0.023 | 0.801 | 0.801 | 0.815 | 0.388 | 0.701 | 0.801 |
| Butanoic Acid | 0.006 | 0.013 | 0.009 | 0.461 | 0.736 | 0.461 | 0.905 | 0.905 | 0.914 |
| Citric Acid | 0.791 | 0.945 | 0.705 | 0.104 | 0.147 | 0.132 | 0.046 | 0.028 | 0.008 |
| Fumaric Acid | 0.061 | 0.241 | 0.084 | 0.061 | 0.084 | 0.136 | 0.061 | 0.126 | 0.061 |
| L-Glutamate | 0.166 | 0.361 | 0.166 | 0.719 | 0.719 | 0.715 | 0.166 | 0.166 | 0.008 |
| Lactate | 0.121 | 0.088 | 0.016 | 0.027 | 0.070 | 0.121 | 0.001 | 0.007 | 0.013 |
| Malate | 0.001 | 0.002 | 0.001 | 0.002 | 0.002 | 0.003 | 0.002 | 0.002 | 0.001 |
| Maltose | 0.205 | 0.945 | 0.913 | 0.259 | 0.033 | 0.015 | 0.817 | 0.105 | 0.020 |
| Myoinositol | 0.930 | 0.512 | 0.512 | 0.075 | 0.442 | 0.075 | 0.071 | 0.203 | 0.075 |
| Propanoic Acid | 0.269 | 0.147 | 0.005 | 0.179 | 0.084 | 0.728 | 0.003 | 0.005 | 0.084 |
| Succinic Acid | 0.001 | 0.005 | 0.001 | 0.269 | 0.236 | 0.016 | 0.083 | 0.641 | 0.084 |
Table 3.
FDR-adjusted p-values for association of metabolites with neurodevelopmental outcomes.
| Metabolite | Self feed | Wt Gain (30) | Reflex | Plain Reach | CP Death |
|---|---|---|---|---|---|
| Arachidonic Acid | 0.156 | 0.151 | 0.029 | 0.221 | 0.383 |
| Butanoic Acid | 0.231 | 0.215 | 0.029 | 0.604 | 0.226 |
| Citric Acid | 0.223 | 0.215 | 0.008 | 0.073 | 0.098 |
| Fumaric Acid | 0.072 | 0.110 | 0.003 | 0.220 | 0.043 |
| Lactate | 0.164 | 0.014 | 0.001 | 0.159 | 0.098 |
| Malate | 0.240 | 0.146 | 0.029 | 0.220 | 0.276 |
| Propanoic Acid | 0.072 | 0.012 | 0.000 | 0.073 | 0.057 |
| Succinic Acid | 0.689 | 0.101 | 0.027 | 0.814 | 0.312 |
RESULTS
Primate Characteristics
Thirty-three primates were included in this study. Table 1 lists the birth characteristics of all primates in different treatment groups. There were no significant differences in gestational age at birth, or birth weight. APGAR scores at 1, 5, and 10 minutes were significantly lower in asphyxiated primates than in un-asphyxiated control animals. Initial laboratory data also demonstrated that asphyxiated animals have lower pH, larger base deficits and higher lactate levels, confirming that in utero UCO produces perinatal asphyxia. Nine UCO animals required epinephrine to treat initial bradycardia. Five UCO animals died within the first 10 days after birth due to complications of perinatal asphyxia. The 1 minute Apgar score in the control animals is lower than might be expected due to delivery following general anesthesia, and cord occlusion for approximately 2 minutes during which the umbilical artery catheter was placed.
Table 1.
Birth characteristics and early measurements for infant primates. Data are means (± SEM) or percentages as indicated.
| Control | UCO | UCO+HT | UCO+ HT+Epo | PANOVA | |
|---|---|---|---|---|---|
| N | 6 | 11 | 7 | 9 | |
| Birthweight (g) | 561 ± 22 | 549 ± 24 | 548 ± 47 | 580 ± 26 | NS |
| Days Premature | 4.5 ± 0.8 | 4 ± 0.6 | 4.7 ± 0.7 | 5 ± 0.6 | NS |
| Male (%) | 50% | 45% | 43% | 56% | NS |
| Mortalities | 0 | 3 | 2 | 0 | NS |
|
| |||||
| Epinephrine | 0 | 3 | 5 | 1 | |
| Initial pH | 7.0 ± 0.2 | 6.8 ± 0 | 6.8 ± 0 | 6.9 ± 0.1 | NS |
| Initial CO2 | 53 ± 7 | 100 ± 10* | 106 ± 10* | 96 ± 13* | 0.019 |
| Peak Base Deficit | 10.3 ± 0.9 | 19.6 ± 0.8† | 20 ± 1† | 17.7 ± 1.4† | 0.001 |
| Peak Lactate | 6.6 ± 0.7 | 13.7 ± 0.5† | 13 ± 0.7† | 13.3 ± 0.7† | 0.001 |
|
| |||||
| Apgar Score | 0.001 | ||||
| 1 min | 3.8 ± 0.5 | 0.6 ± 0.2† | 0.3 ± 0.2† | 0.7 ± 0.2† | |
| 5 min | 6 ± 0.7 | 2.2 ± 0.3† | 1.6 ± 0.5† | 2.6 ± 0.2† | |
| 10 min | 8.3 ± 0.6 | 3 ± 0.3† | 2.4 ± 0.5† | 3.6 ± 0.2† | |
| 20 min | 9.3 ± 0.3 | 4.3 ± 0.2† | 3.7 ± 0.7† | 4.1 ± 0.3† | |
Dunnett’s comparisons to Control indicated as
P ≤ 0.05 or
P ≤ 0.001.
Abbreviations: UCO, umbilical cord occlusion; HT, hypothermia; Epo, erythropoietin
Plasma Metabolomics
One hundred and sixty five plasma samples were collected from the 33 primates included in this study. Sixty-three metabolites were identified as potential biomarkers with a great degree of change over time (baseline vs. later time point). Fourteen metabolites were eliminated from consideration due to insufficient data points because of missing data in individual samples. Of the remaining 49 metabolites, twelve could not be adequately evaluated because cord blood values for the metabolite differed between the control and the UCO animals. These metabolites included glutamic acid, serine, alanine, norvaline, valine, leucine, L-phenylalanine, tyrosine, pantothenate, steric acid and glucose. Twelve metabolites showed group differences between UCO and control animals at one or more time points. Table 2 lists these metabolites and the adjusted p-values based on multiple comparisons for each treatment group at each time point. All comparisons are made to control animals at the same time point. Comparisons at 24 hours were not included in the table, as few differences were noted. Metabolites that changed early (5 minutes after birth) included arachidonic acid, lactic acid, butanoic acid, succinic acid, fumaric acid and malate. Some of these metabolites continued to differ from control values over time (fumaric acid, lactate, malate, succinic acid), while others did not. Changes in these metabolites over time are shown in Figure 4. Another group of metabolites were not different at the initial evaluation, but were different by 48 or 72 hours (aminomalonic acid, citric acid, myo-inositol and propanoic acid. Some of these metabolites also differed from controls at 72 hours. Figure 5 shows changes over time in the metabolites that showed late differences between control and UCO samples.
Figure 4. Early Change Circulating Metabolites.

The time course of six metabolites (lactic acid, arachidonic acid, malate butanoic acid, succinic acid and fumaric acid) that change significantly within 5 minutes of birth, and the time course, by treatment group, each metabolite shows over the first 72 hours after birth. Note that lactic acid and malate also show differences by treatment group at 72 hours, with fumaric acid showing a similar trend.
Figure 5. Signaling pathway intermediates and the change in their normalized m/z signal intensity over the first 72 hours of age.

The time course of six metabolites (L-glutamate, myo-inositol, aminomalonic acid, citric acid, maltose and propanoic acid) that change significantly over the first 72 hours after birth, by treatment group. Note that myo-inositol and citric acid show differences by treatment group at 72 hours.
Neurodevelopmental assessments of these animals were obtained until 9 months of age. We tested whether any of the 12 identified metabolites shown in table 2 were associated with important short or long term outcomes. Despite a relatively small sample size, several significant correlations were detected. Table 3 lists the FDR adjusted p-values for correlations between early metabolite concentrations and developmental outcomes. The ability to self-feed is a complex activity that combines both cognitive and physical abilities. Animals must recognize the bottle of formula is attached to the cage, must mobilize to approach the bottle, position themselves, and then be able to suck and swallow the milk. We have previously shown that ability to self feed, early weight gain, and days to achieve early reflexes are all significantly affected by UCO [12]. In the parent study, the combined outcome of death or moderate to severe CP was significantly improved by HT+ Epo (0%) compared to HT alone (44%), making fumaric acid and propanoic acid interesting metabolites to evaluate further as predictors of outcome.
DISCUSSION
The application of metabolomics to evaluate clinical conditions pertaining to neonatal biology is relatively new [19–24]. Different approaches have been used to this end, including the evaluation of plasma, urine, cerebral spinal fluid, and magnetic resonance spectroscopy of brain [8,20,25,26]. The metabolomic profile is composed of products of cellular and physiologic metabolism, products of specific biochemical pathways that the organism has used to promote survival in any given circumstance. The metabolome can therefore be used to compare control and experimental conditions of interest as the metabolites reflect changes in specific pathways that the organism has used, thus allowing for the identification of biomarkers of biologic conditions such as hypoxia-ischemia [22,24]. Promising early findings have been published using metabolomics analysis to predict or categorize sepsis, diabetes, iron deficiency, kidney disease, and hypoxic ischemic brain injury [22,27–30]. Since the metabolome can be expected to change over time as the response to hypoxia-ischemia evolves, evaluation of sequential, timed metabolomes may eventually allow for identification of both the timing and severity of injury. Piglet [23,24] and mouse models [20] of hypoxic ischemic brain injury have been used in preclinical studies to identify potential biomarkers using metabolomics, however, the nonhuman primate model used in this study is the only one in which the injury occurs in utero.
The preliminary data presented in this manuscript support the hypothesis that the circulating metabolome in neonatal primates changes after birth, and these changes vary depending on whether animals have been exposed to perinatal asphyxia with or without therapeutic HT or Epo treatment. These metabolic profiles demonstrate complex biochemical changes during the evolution of brain injury and recovery during neuroprotective therapy. We identified 12 metabolites that may potentially be useful as diagnostic and/or prognostic chemical indicators of hypoxia-ischemia exposure.
Four tricarboxilic acid (TCA) cycle intermediates, including citric acid, succinate, fumaric acid, and malate, demonstrate temporal changes following perinatal asphyxia. The TCA cycle is essential in aerobic metabolism, which has a role in generating ATP and other high-energy phosphates. Aerobic metabolism is crucial for cellular activity energy storage, required electron transport chain (located in mitochondria) combined with oxygen to produce more ATP from substrate phosphorylations, NADH and FADH2. We previously reported that the normal transition to extrauterine life is accompanied by metabolic changes involving several TCA cycle intermediates [11]. In the current study, citric acid, succinate, fumaric acid, and malate are all increased after birth in control animals, however, this increase is exaggerated in animals that have undergone UCO. These metabolites are potential indicators of severity of illness, and will be tested in further studies. Given that both malate and succinic acid have acute increases that exceed those seen with lactate, these may be more sensitive indices than lactate for early diagnosis of birth asphyxia. These data are consistent with findings from a piglet model of neonatal asphyxia in which succinate and fumarate were highly correlated with asphyxia [31]. Succinic acid may be of particular interest because succinate has been identified as an important vascular growth factor whose action is mediated by its cognate receptor G protein-coupled receptor-91 (GPR91) [32]. In the retina, hypoxia-mediated increases in succinate activate GPR91, which then regulates production of angiogenic factors including VEGF. Maintenance of an elevated succinate concentration at the tissue level may contribute to brain healing after a hypoxic-ischemic event [33,34].
Arachidonic acid, a polyunsaturated omega-6 fatty acid, is abundant in cell membranes, particularly brain, muscles and liver. This fatty acid was markedly elevated immediately following birth in all asphyxiated animals compared to controls, and may indicate disruption of cell membranes. It and its metabolites have many functions. For example, it can act as a lipid second messenger, regulating several signaling molecules such as phosopholipase C (PLC)-gamma and delta, phosphokinase C (PKC)- alpha and beta, and it is also a key inflammatory mediator and vasodilator. It decreases oxidative stress in the brain by activating peroxisome proliferator-activated receptor gamma [35]. Other reports show that arachidonic acid activates syntaxin-3 (STX-3), a protein involved in the growth and repair of neurons [36]. It is unclear at this stage whether the acute elevation of arachidonic acid might be beneficial or harmful to the hypoxic-ischemic brain.
Peripheral butanoic acid, also known as butyric acid, is presumed to be derived from central gamma butyric acid (GABA), the primary inhibitory neurotransmitter in the central nervous system [37]. Plasma GABA is a known marker of several metabolic and psychiatric disorders [38–42]. We speculate that elevated butanoic acid levels in the asphyxiated infants reflect compromise of the blood brain barrier and/or diminished liver degradation. The catabolic pathway for GABA produces both butanoic and succinic acid, both of which were acutely elevated in our asphyxiated animals. Accumulation of the Krebs cycle intermediates succinate, fumarate and malate likely reflect disruption of mitochondrial energy production by asphyxia.
Propanoic acid was elevated in all groups after birth, decreased by 24 hours, but then trended up in both control and UCO HT+Epo animals by 72 hours. Not much is known about propanoic acid metabolism in the brain, or whether this increase in circulating propanoic acid originated from brain. This molecule has been linked to enteral metabolism, and has been identified as a potential biomarker of autism [43], although this has not been confirmed.
Although this study is limited by the small number of animals, it provides preliminary insight into metabolic changes occurring following “normal” birth (by cesarean section following general anesthesia) as compared to following birth complicated by a known acute hypoxic ischemic insult. We have shown that there are distinct patterns of metabolite changes that occur over time and characterize animals that have undergone hypoxia, however, treatment groups were too small to allow for reliable detection of differences in metabolites based on therapy received.
The timing of blood sampling is important when considering metabolites that might be useful for clinical prognostication. In this study we sampled blood at time points that corresponded with the evolution of primary and secondary phases of brain injury to evaluate overall patterns of metabolites following injury. These time points are not ideal for clinical purposes. For example, our first postnatal sample was obtained at five minutes after birth to evaluate the acute effects of asphyxia. In most clinical situations, such early blood sampling would not be feasible. More useful time points would include 3 and 6 hour samples, when at-risk infants are being assessed for the need for therapeutic HT (diagnostic). Further assessments might be obtained immediately before rewarming to determine whether cooling was therapeutic (prognostic), and immediately following rewarming, to determine whether additional therapies might be needed. Future studies will address these more clinically relevant time points. Use of this novel preclinical nonhuman primate model is particularly relevant, as the timing and nature of injury response is likely to translate well to human infants.
Acknowledgments
We would like to give special thanks to the Washington National Primate Research Center and Infant Primate Research Lab, including Pat Delio, Noelle Liberato, and Sarah Ramelli.
This study was supported by NIH grants HD52820 and HD02274 through the National Institute of Child Health and Human Development and ARRA, and also by University of Washington Institute of Translational Health Sciences NCRR grants RR025014, RR025015, and RR025016, and the Washington Regional Primate Research Center’s base operating grant RR000166.
References
- 1.Kurinczuk JJ, White-Koning M, Badawi N. Epidemiology of neonatal encephalopathy and hypoxic-ischaemic encephalopathy. Early Hum Dev. 2010;86:329–338. doi: 10.1016/j.earlhumdev.2010.05.010. [DOI] [PubMed] [Google Scholar]
- 2.Graham EM, Ruis KA, Hartman AL, Northington FJ, Fox HE. A systematic review of the role of intrapartum hypoxia-ischemia in the causation of neonatal encephalopathy. Am J Obstet Gynecol. 2008;199:587–595. doi: 10.1016/j.ajog.2008.06.094. [DOI] [PubMed] [Google Scholar]
- 3.Black RE, Cousens S, Johnson HL, Lawn JE, Rudan I, Bassani DG, Jha P, Campbell H, Walker CF, Cibulskis R, Eisele T, Liu L, Mathers C. Global, regional, and national causes of child mortality in 2008: A systematic analysis. Lancet. 2010;375:1969–1987. doi: 10.1016/S0140-6736(10)60549-1. [DOI] [PubMed] [Google Scholar]
- 4.Tagin MA, Woolcott CG, Vincer MJ, Whyte RK, Stinson DA. Hypothermia for neonatal hypoxic ischemic encephalopathy: An updated systematic review and meta-analysis. Arch Pediatr Adolesc Med. 2012;166:558–566. doi: 10.1001/archpediatrics.2011.1772. [DOI] [PubMed] [Google Scholar]
- 5.Edwards AD, Brocklehurst P, Gunn AJ, Halliday H, Juszczak E, Levene M, Strohm B, Thoresen M, Whitelaw A, Azzopardi D. Neurological outcomes at 18 months of age after moderate hypothermia for perinatal hypoxic ischaemic encephalopathy: Synthesis and meta-analysis of trial data. BMJ. 2010;340:c363. doi: 10.1136/bmj.c363. [DOI] [PMC free article] [PubMed] [Google Scholar]
- 6.Thornton C, Rousset CI, Kichev A, Miyakuni Y, Vontell R, Baburamani AA, Fleiss B, Gressens P, Hagberg H. Molecular mechanisms of neonatal brain injury. Neurol Res Int. 2012;2012:506320. doi: 10.1155/2012/506320. [DOI] [PMC free article] [PubMed] [Google Scholar]
- 7.Atzori L, Xanthos T, Barberini L, Antonucci R, Murgia F, Lussu M, Aroni F, Varsami M, Papalois A, Lai A, D’Aloja E, Iacovidou N, Fanos V. A metabolomic approach in an experimental model of hypoxia-reoxygenation in newborn piglets: Urine predicts outcome. J Matern Fetal Neonatal Med. 2010;23 (Suppl 3):134–137. doi: 10.3109/14767058.2010.517033. [DOI] [PubMed] [Google Scholar]
- 8.Beckstrom AC, Humston EM, Snyder LR, Synovec RE, Juul SE. Application of comprehensive two-dimensional gas chromatography with time-of-flight mass spectrometry method to identify potential biomarkers of perinatal asphyxia in a non-human primate model. J Chromatogr A. 2011;1218:1899–1906. doi: 10.1016/j.chroma.2011.01.086. [DOI] [PMC free article] [PubMed] [Google Scholar]
- 9.Jacobson Misbe EN, Richards TL, McPherson RJ, Burbacher TM, Juul SE. Perinatal asphyxia in a nonhuman primate model. Dev Neurosci. 2011;33:210–221. doi: 10.1159/000327246. [DOI] [PMC free article] [PubMed] [Google Scholar]
- 10.Traudt CM, Juul SE. Erythropoietin as a neuroprotectant for neonatal brain injury: Animal models. Methods Mol Biol. 2013;982:113–126. doi: 10.1007/978-1-62703-308-4_7. [DOI] [PMC free article] [PubMed] [Google Scholar]
- 11.Beckstrom AC, Tanya P, Humston EM, Snyder LR, Synovec RE, Juul SE. The perinatal transition of the circulating metabolome in a nonhuman primate. Pediatric Research. 2012;71:338–344. doi: 10.1038/pr.2011.74. [DOI] [PMC free article] [PubMed] [Google Scholar]
- 12.Traudt CM, McPherson RJ, Bauer LA, Richards TL, Burbacher TM, McAdams RM, Juul SE. Concurrent erythropoietin and hypothermia treatment improve outcomes in a term nonhuman primate model of perinatal asphyxia. Dev Neurosci. 2013;35:491–503. doi: 10.1159/000355460. [DOI] [PMC free article] [PubMed] [Google Scholar]
- 13.Mohler RE, Tu BP, Dombek KM, Hoggard JC, Young ET, Synovec RE. Identification and evaluation of cycling yeast metabolites in two-dimensional comprehensive gas chromatography-time-of-flight-mass spectrometry data. Journal of Chromatography A. 2008;1186:401–411. doi: 10.1016/j.chroma.2007.10.063. [DOI] [PMC free article] [PubMed] [Google Scholar]
- 14.Hoggard JC, Synovec RE. Parallel factor analysis (parafac) of target analytes in gc x gc-tofms data: Automated selection of a model with an appropriate number of factors. Anal Chem. 2007;79:1611–1619. doi: 10.1021/ac061710b. [DOI] [PubMed] [Google Scholar]
- 15.Humston EM, Dombek KM, Hoggard JC, Young ET, Synovec RE. Time-dependent profiling of metabolites from snf1 mutant and wild type yeast cells. Anal Chem. 2008;80:8002–8011. doi: 10.1021/ac800998j. [DOI] [PMC free article] [PubMed] [Google Scholar]
- 16.Mohler RE, Dombek KM, Hoggard JC, Young ET, Synovec RE. Comprehensive two-dimensional gas chromatography time-of-flight mass spectrometry analysis of metabolites in fermenting and respiring yeast cells. Anal Chem. 2006;78:2700–2709. doi: 10.1021/ac052106o. [DOI] [PMC free article] [PubMed] [Google Scholar]
- 17.Bohannon RW, Smith MB. Interrater reliability of a modified ashworth scale of muscle spasticity. Phys Ther. 1987;67:206–207. doi: 10.1093/ptj/67.2.206. [DOI] [PubMed] [Google Scholar]
- 18.Benjamini Y, Hochberg Y. Controlling the false discovery rate: A practical and powerful approach to multiple testing. Journal of the Royal Statistical Society Series B (Methodological) 1995:289–300. [Google Scholar]
- 19.Fanos V, Antonucci R, Barberini L, Noto A, Atzori L. Clinical application of metabolomics in neonatology. J Matern Fetal Neonatal Med. 2012;25 (Suppl 1):104–109. doi: 10.3109/14767058.2012.663198. [DOI] [PubMed] [Google Scholar]
- 20.Liu J, Sheldon RA, Segal MR, Kelly MJ, Pelton JG, Ferriero DM, James TL, Litt L. 1h nuclear magnetic resonance brain metabolomics in neonatal mice after hypoxia-ischemia distinguished normothermic recovery from mild hypothermia recoveries. Pediatr Res. 2013;74:170–179. doi: 10.1038/pr.2013.88. [DOI] [PMC free article] [PubMed] [Google Scholar]
- 21.Dessi A, Corsello G, Stronati M, Gazzolo D, Caboni P, Carboni R, Fanos V. New diagnostic possibilities in systemic neonatal infections: Metabolomics. Early Hum Dev. 2014;90 (Suppl 1):S19–21. doi: 10.1016/S0378-3782(14)70007-6. [DOI] [PubMed] [Google Scholar]
- 22.Fanos V, Noto A, Xanthos T, Lussu M, Murgia F, Barberini L, Finco G, d’Aloja E, Papalois A, Iacovidou N, Atzori L. Metabolomics network characterization of resuscitation after normocapnic hypoxia in a newborn piglet model supports the hypothesis that room air is better. BioMed research international. 2014;2014:731620. doi: 10.1155/2014/731620. [DOI] [PMC free article] [PubMed] [Google Scholar]
- 23.Arduini A, Escobar J, Vento M, Escrig R, Quintas G, Sastre J, Saugstad OD, Solberg R. Metabolic adaptation and neuroprotection differ in the retina and choroid in a piglet model of acute postnatal hypoxia. Pediatr Res. 2014;76:127–134. doi: 10.1038/pr.2014.70. [DOI] [PubMed] [Google Scholar]
- 24.Skappak C, Regush S, Cheung PY, Adamko DJ. Identifying hypoxia in a newborn piglet model using urinary nmr metabolomic profiling. PLoS One. 2013;8:e65035. doi: 10.1371/journal.pone.0065035. [DOI] [PMC free article] [PubMed] [Google Scholar]
- 25.Mussap M, Noto A, Fanos V, Van Den Anker JN. Emerging biomarkers and metabolomics for assessing toxic nephropathy and acute kidney injury (aki) in neonatology. BioMed research international. 2014;2014:602526. doi: 10.1155/2014/602526. [DOI] [PMC free article] [PubMed] [Google Scholar]
- 26.Rao R, Ennis K, Oz G, Lubach GR, Georgieff MK, Coe CL. Metabolomic analysis of cerebrospinal fluid indicates iron deficiency compromises cerebral energy metabolism in the infant monkey. Neurochem Res. 2013;38:573–580. doi: 10.1007/s11064-012-0950-7. [DOI] [PMC free article] [PubMed] [Google Scholar]
- 27.Connor SC, Hansen MK, Corner A, Smith RF, Ryan TE. Integration of metabolomics and transcriptomics data to aid biomarker discovery in type 2 diabetes. Mol Biosyst. 2010;6:909–921. doi: 10.1039/b914182k. [DOI] [PubMed] [Google Scholar]
- 28.Fanos V, Antonucci R, Barberini L, Atzori L. Urinary metabolomics in newborns and infants. Advances in clinical chemistry. 2012;58:193–223. doi: 10.1016/b978-0-12-394383-5.00013-8. [DOI] [PubMed] [Google Scholar]
- 29.Noto A, Mussap M, Fanos V. Is h nmr metabolomics becoming the promising early biomarker for neonatal sepsis and for monitoring the antibiotic toxicity? Journal of chemotherapy. 2013 doi: 10.1179/1973947813Y.0000000149. [DOI] [PubMed] [Google Scholar]
- 30.Fanos V, Caboni P, Corsello G, Stronati M, Gazzolo D, Noto A, Lussu M, Dessi A, Giuffre M, Lacerenza S, Serraino F, Garofoli F, Serpero LD, Liori B, Carboni R, Atzori L. Urinary (1)h-nmr and gc-ms metabolomics predicts early and late onset neonatal sepsis. Early Hum Dev. 2014;90 (Suppl 1):S78–83. doi: 10.1016/S0378-3782(14)70024-6. [DOI] [PubMed] [Google Scholar]
- 31.Solberg R, Enot D, Deigner HP, Koal T, Scholl-Burgi S, Saugstad OD, Keller M. Metabolomic analyses of plasma reveals new insights into asphyxia and resuscitation in pigs. PLoS One. 5:e9606. doi: 10.1371/journal.pone.0009606. [DOI] [PMC free article] [PubMed] [Google Scholar]
- 32.Sapieha P, Sirinyan M, Hamel D, Zaniolo K, Joyal JS, Cho JH, Honore JC, Kermorvant-Duchemin E, Varma DR, Tremblay S, Leduc M, Rihakova L, Hardy P, Klein WH, Mu X, Mamer O, Lachapelle P, Di Polo A, Beausejour C, Andelfinger G, Mitchell G, Sennlaub F, Chemtob S. The succinate receptor gpr91 in neurons has a major role in retinal angiogenesis. Nat Med. 2008;14:1067–1076. doi: 10.1038/nm.1873. [DOI] [PubMed] [Google Scholar]
- 33.Hamel D, Sanchez M, Duhamel F, Roy O, Honore JC, Noueihed B, Zhou T, Nadeau-Vallee M, Hou X, Lavoie JC, Mitchell G, Mamer OA, Chemtob S. G-protein-coupled receptor 91 and succinate are key contributors in neonatal postcerebral hypoxia-ischemia recovery. Arterioscler Thromb Vasc Biol. 2014;34:285–293. doi: 10.1161/ATVBAHA.113.302131. [DOI] [PubMed] [Google Scholar]
- 34.Ariza AC, Deen PM, Robben JH. The succinate receptor as a novel therapeutic target for oxidative and metabolic stress-related conditions. Front Endocrinol (Lausanne) 2012;3:22. doi: 10.3389/fendo.2012.00022. [DOI] [PMC free article] [PubMed] [Google Scholar]
- 35.Wang ZJ, Liang CL, Li GM, Yu CY, Yin M. Neuroprotective effects of arachidonic acid against oxidative stress on rat hippocampal slices. Chem Biol Interact. 2006;163:207–217. doi: 10.1016/j.cbi.2006.08.005. [DOI] [PubMed] [Google Scholar]
- 36.Darios F, Davletov B. Omega-3 and omega-6 fatty acids stimulate cell membrane expansion by acting on syntaxin 3. Nature. 2006;440:813–817. doi: 10.1038/nature04598. [DOI] [PubMed] [Google Scholar]
- 37.Petty F, Kramer G, Feldman M. Is plasma gaba of peripheral origin? Biol Psychiatry. 1987;22:725–732. doi: 10.1016/0006-3223(87)90204-6. [DOI] [PubMed] [Google Scholar]
- 38.Arrue A, Davila R, Zumarraga M, Basterreche N, Gonzalez-Torres MA, Goienetxea B, Zamalloa MI, Anguiano JB, Guimon J. Gaba and homovanillic acid in the plasma of schizophrenic and bipolar i patients. Neurochem Res. 2010;35:247–253. doi: 10.1007/s11064-009-0048-z. [DOI] [PubMed] [Google Scholar]
- 39.Pearl PL, Shukla L, Theodore WH, Jakobs C, Michael Gibson K. Epilepsy in succinic semialdehyde dehydrogenase deficiency, a disorder of gaba metabolism. Brain Dev. 2011;33:796–805. doi: 10.1016/j.braindev.2011.04.013. [DOI] [PMC free article] [PubMed] [Google Scholar]
- 40.Russo AJ. Correlation between hepatocyte growth factor (hgf) and gamma-aminobutyric acid (gaba) plasma levels in autistic children. Biomarker insights. 2013;8:69–75. doi: 10.4137/BMI.S11448. [DOI] [PMC free article] [PubMed] [Google Scholar]
- 41.Lakhani R, Vogel KR, Till A, Liu J, Burnett SF, Gibson KM, Subramani S. Defects in gaba metabolism affect selective autophagy pathways and are alleviated by mtor inhibition. EMBO molecular medicine. 2014;6:551–566. doi: 10.1002/emmm.201303356. [DOI] [PMC free article] [PubMed] [Google Scholar]
- 42.Xie ZX, Xia SF, Qiao Y, Shi YH, Le GW. Effect of gaba on oxidative stress in the skeletal muscles and plasma free amino acids in mice fed high-fat diet. Journal of animal physiology and animal nutrition. 2014 doi: 10.1111/jpn.12254. [DOI] [PubMed] [Google Scholar]
- 43.Thomas RH, Meeking MM, Mepham JR, Tichenoff L, Possmayer F, Liu S, MacFabe DF. The enteric bacterial metabolite propionic acid alters brain and plasma phospholipid molecular species: Further development of a rodent model of autism spectrum disorders. J Neuroinflammation. 2012;9:153. doi: 10.1186/1742-2094-9-153. [DOI] [PMC free article] [PubMed] [Google Scholar]