

Abstract
Cholangiocarcinoma (CCA) is a lethal hepatobiliary neoplasm originating from the biliary apparatus. In humans, CCA risk factors include hepatobiliary inflammation and fibrosis. The recently identified IL-1 family member, IL-33, has been shown to be a biliary mitogen which also promotes liver inflammation and fibrosis. Our aim was to generate a mouse model of CCA mimicking the human disease. Ectopic oncogene expression in the biliary tract was accomplished by the Sleeping Beauty transposon transfection system with transduction of constitutively active AKT (myr-AKT) and Yes-associated protein (YAP). Intrabiliary instillation of the transposon-transposase complex was coupled with lobar bile duct ligation in CL57BL/6 mice, followed by administration of IL-33 for three consecutive days. Tumors developed in 72% of the male mice receiving both oncogenes plus IL-33 by 10 weeks, but in only 20% of the male mice transduced with the oncogenes alone. Tumors expressed SOX9 and pancytokeratin (PanCK) [features of cholangiocarcinoma] but were negative for HepPar1 [a marker of hepatocellular carcinoma (HCC)]. RNA profiling revealed substantive overlap with human CCA specimens. Not only did IL-33 induce IL-6 expression by human cholangiocytes, but IL-33 likely facilitated tumor development in vivo by an IL-6 sensitive process, as tumor development was significantly attenuated in Il-6 -/- male animals. Furthermore, tumor formation occurred at a similar rate when IL-6 was substituted for IL-33 in this model. In conclusion, the transposase-mediated transduction of constitutively active AKT and YAP in the biliary epithelium coupled with lobar obstruction and IL-33 administration results in the development of CCA with morphological and biochemical features of the human disease. This model highlights the role of inflammatory cytokines in CCA oncogenesis.
Keywords: AKT, murine model, oncogene transduction, Sleeping Beauty transposon, YAP
Cholangiocarcinomas (CCA) are highly lethal hepatobiliary malignancies with features of biliary epithelial cell or cholangiocyte differentiation, and hence are thought to arise from the biliary apparatus. Risk factors include chronic biliary tract inflammation and cholestasis.1, 2 Indeed, transcriptome profiling of human CCA has identified an inflammatory signature associated with signal transducer and activator of transcription 3 (STAT3) signaling presumably initiated by an interleukin (IL)-6 signaling cascade.3 Diverse developmental, metabolism, and cell growth signaling cascades regulated by Notch, isocitrate dehydrogenase (IDH), AKT, fibroblast growth factor, and Hippo pathway have been implicated in the molecular pathogenesis of this cancer.1 CCAs are also highly desmoplastic cancers and are associated with dense populations of myofibroblasts termed cancer-associated fibroblasts (CAF) which promote tumor progression.4 Despite these advances in our understanding of CCA biology, therapeutic advances have been modest and overall 5-year survival is only 10%.5 Preclinical animal models of CCA have been instrumental in helping to elucidate the molecular pathogenesis of this cancer and will become increasingly useful to identify therapeutic strategies.
A number of rodent models of CCA have been developed including transgenic mice, human xenografts, syngeneic orthotopic transplantation with rodent CCA cells, and in vivo liver cell transduction paradigms.1, 6 Each of these models has strengths and weaknesses, but none is ideal. The optimal preclinical animal model of CCA would generate a tumor arising in situ from the biliary tract, recapitulate human signaling pathways for CCA, develop in an immunocompetent host with species-matched tumor microenvironment, permit evaluation of diverse oncogenic signaling processes, and be time-efficient. Finally, the therapeutic results in the preclinical model should ultimately be informative for the human disease.
We sought to develop a mouse model of CCA that would help fulfill the above objectives. We selected a Sleeping Beauty transposon approach to directly transduce the biliary tree. Such a model would help ensure that CCA arose in situ from the biliary tree, provide flexibility in interrogating a variety of oncogenic pathways, be time-efficient, and recapitulate many features of the human disease. Constitutively active AKT and Yes-associated protein (YAP), the effector of the Hippo pathway,7 were employed to transduce the biliary epithelia, as both pathways contribute to the pathogenesis of human hepatobiliary malignancies.8-10 Unilobar bile duct ligation was conducted to induce cholestasis in a local biliary microenvironment. In the absence of an exogenous inflammatory cytokine, tumor development was modest. However, the biliary mitogen IL-3311, which also induces inflammation and tissue fibrosis12, was found to promote tumor development. Preliminary reports of this model have recently been published.11, 13 Herein, we define this model in detail by demonstrating that the cancers arise from the biliary epithelia and duplicate many phenotypic and genetic features of human cholangiocarcinoma including desmoplasia and overlapping mRNA expression profiles. STAT3 activation occurs, implying an inflammatory pathway of carcinogenesis as described in human cholangiocarcinomas.3 Finally, IL-6, in part, contributes to this inflammatory oncogenesis.
Experimental Procedures
Genetic murine model of cholangiocarcinoma
All animal experiments were performed in accordance with a protocol approved by the Mayo Clinic Institutional Animal Care and Use Committee. Male and female wild type and male Il-6 -/- C57BL/6 mice from Jackson Labs were anesthetized by intraperitoneal pentobarbital injections (40-85 mg/kg). Under deep anesthesia, the abdominal cavity was opened by a midline approach, and the liver was gently retracted and allowed to rest on the diaphragm. The common bile duct located below the liver was clamped with a small animal surgical clip (F.S.T., 00396-01; Foster City, CA, USA) to prevent the injected material from rapidly flowing into the duodenum. The bile duct draining the left lateral liver lobe was identified and a ligature (6.0 silk) was placed loosely around the duct. Another ligature was placed around the base of the gallbladder where it meets the cystic duct. Ectopic oncogene expression in the biliary tract was achieved by the Sleeping Beauty transposon transfection system with transduction of murine constitutively active AKT (myr-AKT) and human YAP (YAPS127A). The following DNA constructs were utilized for intra-biliary oncogene transduction: 11.25 μg AKT-PT3EF1α, 11.25 μg YAP2-PT3EF1α, 11.25 μg GFP-PT3F1d, and 2.5 μg pCMV-Sleeping Beauty (SB) transposase. The transposase was generated as previously described.14 100 μL of the plasmid solution in in vivo jetPEI (Polyplus; New York, NY, USA) was prepared according to the manufacturer's instructions and injected into the gallbladder with enough pressure to allow the solution to distend the biliary system. A sterile cotton tipped applicator was held over the injection site for about a minute to prevent leakage. The ligature around the left lateral liver lobe duct was then tied off so as not to allow the plasmid solution to flow from this bile duct to the common bile duct. Following plasmid injection and the left lateral bile duct ligation, the common bile duct was unclamped. The ligature around the base of the gallbladder was then tied and a cholecystectomy performed. Internal organs were returned to their original position. The abdominal wall and skin were closed in separate layers with absorbable chromic 3-0 gut suture material. Then, each animal was injected with 1 μg of IL-33 or 1 μg of IL-6 (R&D; Minneapolis, MN, USA) i.p. starting on postoperative day 1 for 3 days.
Cell lines and culture
The non-malignant, SV40-immortalized human cholangiocyte cell line H69 was maintained as previously described.15, 16 The murine non-malignant, immortalized cholangiocyte cell line 603B17, 18 was cultured in Dulbecco's Modified Eagle's Medium (DMEM) supplemented with 10% FBS, penicillin (100 U/mL), and streptomycin (100 μg/mL) in a humidified 5% CO2 incubator at 37°C.
Immunofluorescence in mice liver specimens
Frozen tissue samples of mice tumors and corresponding samples of normal liver tissue were sectioned into 5 μm frozen sections on a cryomicrotome (Leica, Buffalo Grove, IL), air-dried and stored at -80°C. Sections were fixed with 4% paraformaldehyde and permeabilized using Triton-X. Sections were subsequently blocked for 1 h at room temperature with calcium- and magnesium-free Dulbecco's phosphate buffered saline (PBS) containing 5% bovine serum albumin (BSA), and incubated with primary antibody for 12 h at 4°C. Antibodies were diluted in PBS containing 5% BSA. Primary antibodies and their dilutions were as follows: green fluorescent protein (GFP) (1:50; Santa Cruz Biotechnology, Santa Cruz, CA), ST2 (1:50; Abcam, Cambridge, MA), cytokeratin 19 (1:50; Santa Cruz Biotechnology), and α-smooth muscle actin (α-SMA; 1:100, Abcam). After washing, slides were incubated with corresponding secondary antibodies in the dark for 1 h at room temperature, washed again, and mounted using Prolong Antifade with 4′,6-diamidino-2-phenylindole (DAPI, Invitrogen, Grand Island, NY) to visualize the nuclei. The slides were analyzed using fluorescent confocal microscopy equipped with an ultraviolet laser (LSM 780; Zeiss, Jena, Germany).
Immunohistochemistry in human CCA and mice liver specimens
Tissue samples of human cholangiocarcinomas and corresponding samples of normal liver tissue (n=18) were obtained with Institutional Review Board approval. Liver tissue from euthanized mice was fixed in 4% paraformaldehyde for 48 h, embedded in paraffin, and sectioned into 3.5 μm slices. Human CCA specimens were prepared in a similar manner. Paraformaldehyde-fixed, paraffinembedded liver tissue sections were deparaffinized, hydrated and incubated with primary antibody overnight at 4°C. Antibody sources and dilutions are as follows: pAKT (1:50), YAP (1:25), and phospho-STAT3 (1:200) from Cell Signaling (Danvers, MA); α-smooth muscle actin (1:500), ST2 (1:500), and CK-19 (1:500) from Abcam (Cambridge, MA); PanCK (1:500; Dako, Carpinteria, CA), SOX9 (1:1000; Millipore, Billerica, MA), HepPar1 (1:40; Thermo Fisher Scientific, Waltham, MA). PanCK antibody was used as it only recognizes biliary epithelia in mice liver.19 Bound antibodies were detected with biotin conjugated secondary antibodies and diaminobenzidine (Vector Laboratories, Burlingame, CA) as a substrate and the tissue slices were counterstained with hematoxylin.
Quantitative real-time and qualitative polymerase chain reaction
mRNA was isolated from fresh frozen tissue sections and cells using the RNeasy Plus Mini Kit (Qiagen, Hilden, Germany). Reverse transcription was performed using Moloney Murine Leukemia Virus Reverse Transcriptase (Promega Co., Tokyo, Japan) and random primers (Invitrogen, Grand Island, NY). Real-time polymerase chain reaction (PCR; Light Cycler, Roche, Indianapolis, IN) for quantification of the cDNA template was performed using SYBR green (Roche, Indianapolis, IN) as the fluorophore.20 Target gene expression was calculated using the standard curve method. For qualitative gene expression, PCR products were subjected to electrophoresis on a Tris-Borate-EDTA gel containing 1.5% agarose and subsequently viewed using the Alphaimager HP system (Proteinsimple, CA) according to the manufacturer's protocol. Expression was normalized to 18S rRNA. Primers used are listed in Supplementary Table 1.
RNA Sequencing
RNA sequencing was conducted by the Mayo Medical Genomics Facility. RNA libraries were prepared according to the manufacturer's instructions for the TruSeq RNA Sample Prep Kit v2 (Illumina, San Diego, CA). The liquid handling Eppendorf (Hamburg, GER) EpMotion 5075 robot was employed for TruSeq library construction. All AMPure bead clean up, mRNA isolation, end repair and A-tailing reactions was completed on the 5075 robot. Reverse transcription and adaptor ligation was performed manually. Briefly, poly-A mRNA was purified from total RNA using oligo dT magnetic beads. The purified mRNA was fragmented at 95°C for 8 minutes, eluted from the beads and primed for first strand cDNA synthesis. The RNA fragments were then copied into first strand cDNA using SuperScript III reverse transcriptase and random primers (Invitrogen, Carlsbad, CA). Next, second strand cDNA synthesis was performed using DNA polymerase I and RNase H. The double-stranded cDNA was purified using a single AMPure XP bead (Agencourt, Danvers, MA) clean-up step. The cDNA ends were repaired and phosphorylated using Klenow, T4 polymerase, and T4 polynucleotide kinase followed by a single AMPure XP bead clean-up. The blunt-ended cDNAs were modified to include a single 3′ adenylate (A) residue using Klenow exo- (3′ to 5′ exo minus). Paired-end DNA adaptors (Illumina) with a single “T” base overhang at the 3′ end were immediately ligated to the ‘A tailed’ cDNA population. Unique indexes, included in the standard TruSeq Kits (12-Set A and 12-Set B) were incorporated at the adaptor ligation step for multiplex sample loading on the flow cells. The resulting constructs were purified by 2 consecutive AMPure XP bead clean-up steps. The adapter-modified DNA fragments were enriched by 12 cycles of PCR using primers included in the Illumina Sample Prep Kit. The concentration and size distribution of the libraries were determined on an Agilent Bioanalyzer DNA 1000 chip (Santa Clara, CA). A final quantification, using Qubit fluorometry (Invitrogen, Carlsbad, CA), was done to confirm sample concentration. Libraries were loaded onto paired end flow cells at concentrations of 8-10 pM to generate cluster densities of 700,000/mm2 following Illumina's standard protocol using the Illumina cBot and cBot Paired End Cluster Kit version 3. The flow cells were sequenced as 51 × 2 paired end reads on an Illumina HiSeq 2000 using TruSeq SBS Sequencing Kit version 3 and HCS v2.0.12 data collection software. Base-calling was performed using Illumina' s RTA version 1.17.21.3.
Bioinformatics analysis workflow
Bioinformatics analysis was performed by the Mayo Bioinformatics Core Facility to interpret differential expression of mouse tumor tissue, adjacent liver tissue, normal control and human tumor tissue and adjacent liver tissue. The processing of the mRNA data was performed using MAP-RSeq (v1.2.1.3).21 MAP-RSeq consists of the following steps: alignment, quality control, obtaining genomic features per sample and finally summarizing the data across samples. The pipeline provides detailed quality control data across genes using the RSeQC (v2.3.2) software.22 Paired-end reads are aligned by TopHat (v2.0.6)23 against the mm 10 genome build using the bowtie1 aligner24 option. Gene counts were generated using HTSeq (v0.5.3p9) software and the gene annotation files were obtained from Illumina. Differential expression analysis comparing mouse tumor tissue vs. adjacent liver, mouse control samples vs. adjacent liver, and human tumor tissue vs. adjacent liver were computed using the edgeR package (v2.6.2).25 Human tissue was derived from CCA patients with advanced disease and consisted of 24-paired samples from patients with intrahepatic CCA and 6-paired samples from patients with extrahepatic CCA. To facilitate comparison across species, only genes that coincide in humans and mouse were included in the analysis. Genes that were differentially regulated over 2-fold, with a false discovery rate or FDR<0.1 were analyzed using Ingenuity Pathway Analysis as well as uploaded for visualization to Panda Xplorer.
Immunoblot analysis
Whole cell lysates were prepared as previously described.26 Proteins were resolved by SDS-page and transferred to polyvinylidene difluoride membranes (Bio-Rad Laboratories Inc.). Membranes were blotted with primary antibody at the indicated dilutions. Antibodies sources were as follows: Actin (1:5000; Santa Cruz Biotechnology, Santa Cruz, CA) and ST2 (1:1000; Abcam, Cambridge, MA). Fluorochrome-labeled secondary antibodies for rabbit and goat (1:10000) were from LICOR (Lincoln, NE). Bound antibodies were detected using Odyssey (LICOR, Lincoln, NE) infrared scanning.
Enzyme-Linked ImmunoSorbent Assay (ELISA)
200 mg of liver tissue was homogenized in 500 μL PBS and subsequently centrifuged at 10,000 × g at 4°C for 15 min. Protein concentration of the supernatant was measured using DC protein assay kit (Bio-Rad, Hercules, CA). The concentration of IL-6 in the supernatant was measured by IL-6 ELISA kit using the manufacturer's protocol (R&D Systems, Minneapolis, MN). The concentration of CA 19-9 was measured by CA 19-9 ELISA kit using the manufacturer's protocol (Elabscience, WuHan, P.R.C.).
Statistical analysis
Data are expressed as mean ± standard error from at least three independent experiments. Statistical analysis was performed using Student's t-test or Fisher's exact test for categorical data. The chi-square test was used to examine differences in tumor occurrence rate. Differences were considered as significant at levels of p < 0.05. All statistical analysis was completed using JMP 10.0 software (SAS Institute, Tokyo, Japan).
Results
Biliary tract transduction of AKT and YAP is IL-33 independent
In male C57BL/6 mice, we first sought to determine whether the combination of unilobar bile duct ligation, oncogene transduction, and IL-33 enhances liver inflammation. Serum aminotransferase levels were higher when bile duct ligation was coupled with oncogene transduction. However, serum aminotransferase levels did not increase significantly following IL-33 administration (Fig. 1A). Hence, acute IL-33 administration does not modulate liver injury in this model. Intrabiliary instillation of a Sleeping Beauty transposon-transposase complex expressing GFP revealed significant transduction of the cholangiocytes, but not hepatocytes, in the bile duct ligated lobe 7 days later; GFP transduction did not require IL-33 administration (Fig. 1B). Next, expression of AKT and YAP was assessed by immunohistochemistry following biliary instillation to further determine the efficiency of the oncogene transduction. AKT and YAP expression was noted in cholangiocytes (PanCK positive cells) in the ligated biliary lobe of mice with transduction of these oncogenes but not in the control group (Fig. 1C). Consistent with our observation with GFP transduction, addition of IL-33 did not enhance transduction of AKT or YAP. Hence, IL-33 does not enhance transposon transduction of the biliary epithelium, which is unexpectedly quite efficient.
Figure 1.
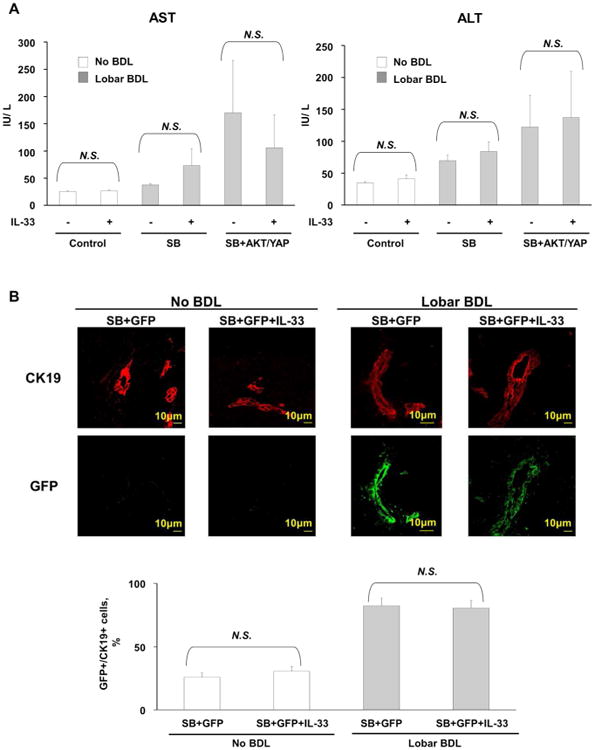
Biliary tract oncogene transduction of AKT and YAP is an efficient, IL-33-independent process. (A) Levels of the aminotransferases AST and ALT were increased in mice which underwent biliary tract transduction of AKT and YAP and BDL compared to control mice which did not undergo BDL. IL-33 administration did not result in a further increase in aminotransferase levels. [Control (n=5), Control+IL-33 (n=5), SB (n=5), SB+IL-33 (n=5), SB+AKT+YAP (n=10), SB+AKT+YAP+IL-33 (n=25)]; Mean + SD are depicted. (B) Immunofluorescence was used to detect GFP in cholangiocytes (CK19 positive cells) in mice which had undergone biliary transduction of SB+GFP with or without systemic IL-33 administration and BDL (upper panel). The number of GFP and CK19 positive cells was quantified in 5 high power fields and expressed as a percentage of total (lower panel). Mean + SD are depicted for n=5. Original magnification: 63×. (C) Representative photomicrograph of hematoxylin and eosin-stained (H&E) sections from the ligated lobes of mice sacrificed 10 weeks after undergoing biliary transduction of SB +/-AKT +/-YAP with or without systemic IL-33 administration (top panels). Immunohistochemistry was used to detect PanCK, pAKT, and YAP expression in these mice (2nd, 3rd, and bottom panels, respectively). Original magnification: 60×.
Biliary transduction of AKT/YAP combined with systemic IL-33 facilitates tumor development
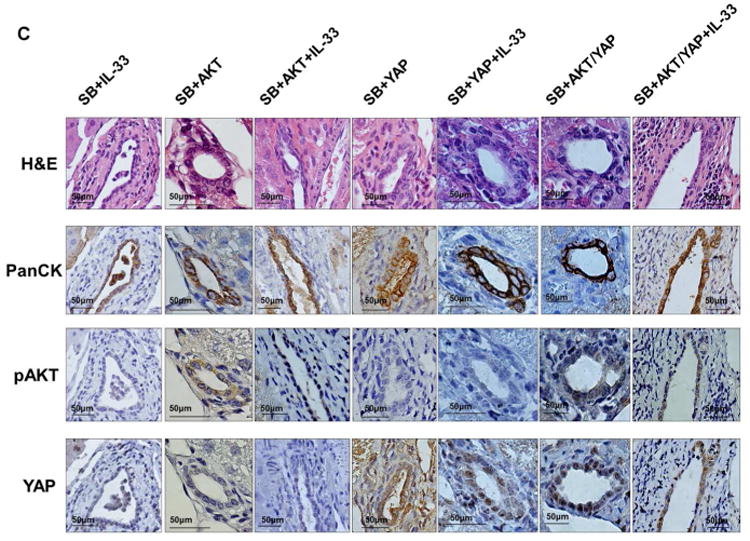
Next, we set out to determine whether the combination of unilobar bile duct ligation and oncogene transduction promotes biliary tumorigenesis in male C57BL/6 mice. Ten weeks after surgery with bile duct ligation and oncogene transduction, CCA tumors developed in 20% of animals with biliary transduction of both AKT and YAP in the absence of IL-33 (Fig. 2A, Supplementary Fig. 1). Interestingly, systemic IL-33 significantly increased tumor development when combined with both AKT and YAP transduction, with 72% of these animals developing tumors (Fig. 2A). Tumors predominantly occurred in the ligated bile duct lobe. IL-33 administration alone did not induce tumor occurrence. Tumor occurrence appears to be a diffuse process along the biliary system rather than one restricted to certain-sized bile ducts. Expression of AKT and YAP as ascertained by immunohistochemistry and mRNA analysis was significantly enhanced in tumor tissue compared to corresponding liver tissue (Fig. 2B). Collectively, these observations indicate that transposase-mediated transduction of constitutively active AKT and YAP in the biliary epithelium coupled to IL-33 administration facilitates hepatobiliary tumor development.
Figure 2.
Biliary transduction of murine AKT plus human YAP combined with systemic IL-33 facilitates biliary tumorigenesis. (A) Liver appearance of mice ten weeks after having undergone biliary transduction of SB+/-AKT+/-YAP coupled with BDL and subsequent systemic IL-33 administration (1 μg i.p. for 3 days) (upper panels). Black line surrounds the ligated lobe. Percentage of animals with tumors (lower panel). (Control, n=5; Control+IL-33, n=5; SB, n=5; SB+IL-33, n=5; SB+AKT, n=5; SB+AKT+IL-33, n=5; SB+YAP, n=5; SB+YAP+IL-33, n=5; SB+AKT/YAP, n=10; SB+AKT/YAP+IL-33, n=17). (B) Mice with biliary transduction of AKT and YAP have increased expression of these oncogenes. Expression of Akt and YAP was quantified in mouse tumor tissue, corresponding adjacent tissue, and control mouse liver tissue by qRT-PCR (left panels). Mean + SD are depicted for n=5 (control mouse liver tissue) and n=4 (tumor and corresponding adjacent tissue). Immunohistochemistry was used to detect phospho-AKT (pAKT) and YAP in mouse tumor and corresponding adjacent liver tissue (right panels). Original magnification: 60×. I.p., intraperitoneal.
Murine tumors are morphologically and phenotypically similar to human CCA
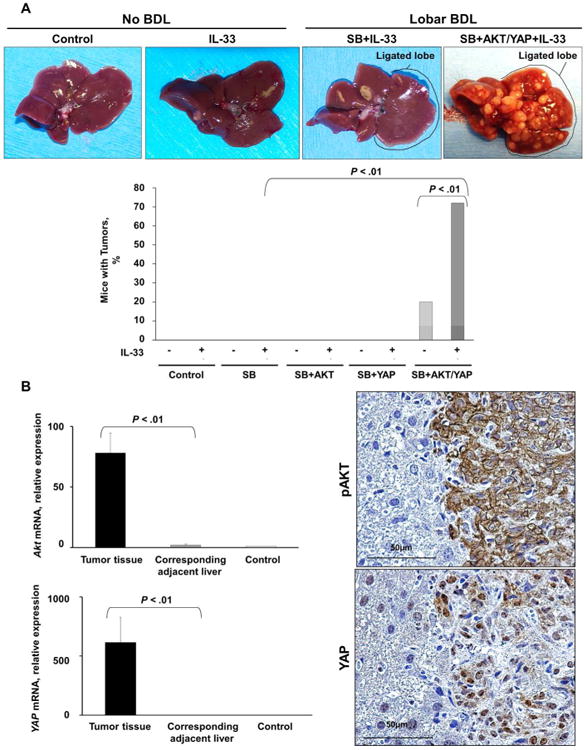
Murine tumors had marked histological resemblance to human CCAs with features such as hyperplasia of irregular glands and presence of dyskaryotic cells (Fig. 3A). Similar to resected human CCA specimens, immunohistochemistry analysis of murine tumors demonstrated the presence of both pancytokeratin (PanCK) and SOX9 (Fig. 3A, Supplementary Fig. 2). In contrast, HepPar1, a marker of hepatocellular carcinoma, was not expressed in murine tumors or human CCA resected specimens. Murine CCA also contained abundant α-SMA positive myofibroblasts, therefore duplicating the desmoplasia observed in human CCA (Fig. 3B). Similar to human CCA,1 levels of the serum marker CA 19-9 were significantly elevated in the murine tumors (Fig. 3C).
Figure 3.
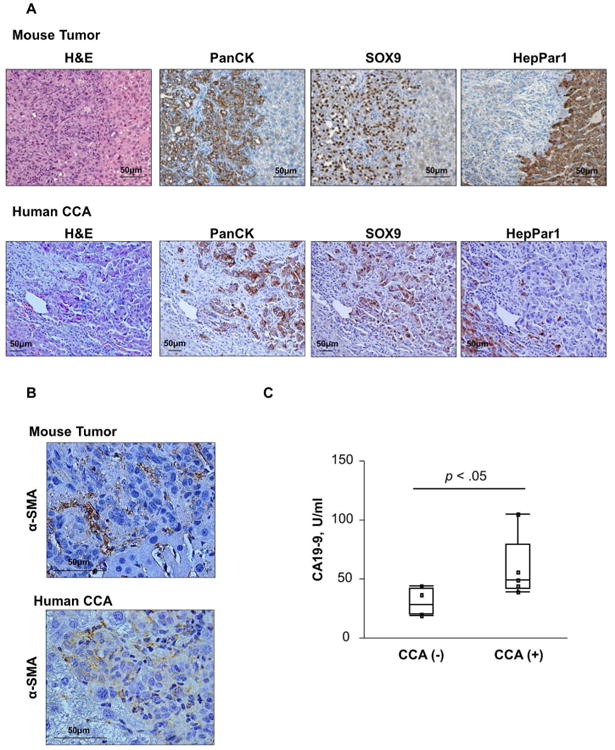
Murine tumors have histological resemblance and phenotypic features of human CCA. (A) Representative photomicrograph of hematoxylin and eosin-stained tumor sections and adjacent liver from mice having undergone biliary transduction of AKT+YAP coupled with BDL and systemic IL-33 administration (1 μg daily for 3 days) (upper panel) and human CCA tissue are shown (lower panel). Immunohistochemistry was used to detect PanCK, SOX9, and HepPar1 in these murine tumors (upper panels) and human CCA (lower panels). Original magnification: 20×. (B) Immunohistochemistry was used to detect α-SMA in murine tumors (left panel) and human CCA (right panel). Original magnification: 60×. (C) ELISA was used to detect CA 19-9 levels in murine tumor tissue and control liver.
RNA sequencing analysis of mouse tumors compared to adjacent liver and control mice indicated upregulation of a number of genes and signaling pathways. Similar analysis of human CCA specimens and adjacent livers was conducted. Differential expression analysis of murine CCA gene expression coupled with human CCA gene expression demonstrated that 774 genes were upregulated and 879 genes were downregulated in both mice and human tumors (Fig. 4A, 4B, Supplementary file 1). The top 25 upregulated and downregulated genes common to both the murine and human CCA specimens are depicted in Tables 1 and 2, respectively.
Figure 4.
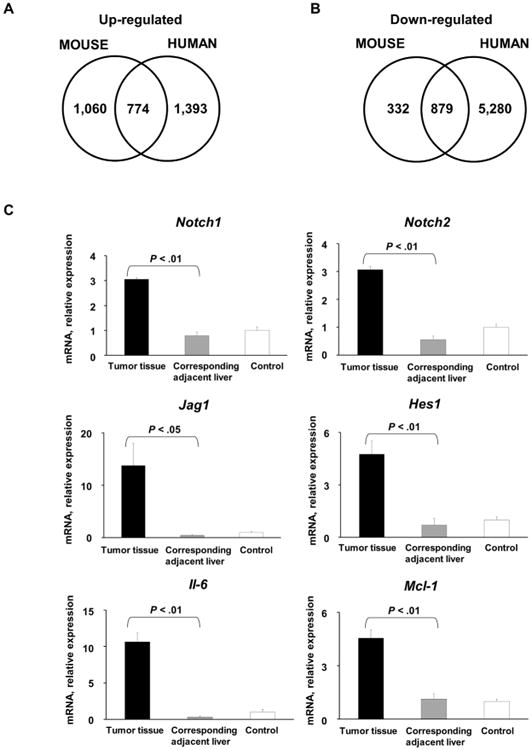
Comparison of upregulated and downregulated genes in murine tumors. (A) Venn diagram illustrating genes that are upregulated in both murine tumors and human CCA specimens (n=30) compared to corresponding normal livers. (B) Venn diagram illustrating genes that are downregulated in both murine tumors and human CCA specimens (n=30) compared to corresponding normal livers. (C) Expression of Notch1, Notch2, Jag1, Hes 1, Mcl-1, and Il-6 was quantified in murine tumors, corresponding adjacent liver, and mouse control liver by qRT-PCR. Mean + SD are depicted for n=5 (control mouse liver tissue) and n=4 (tumor and corresponding adjacent tissue).
Table 1.
Genes upregulated in murine tumors and human CCA. RNA sequencing was used to analyze genes upregulated in murine tumors compared to corresponding adjacent liver, and in human CCA specimens and corresponding adjacent liver. The differential gene expression in murine tumors and human CCA specimens was compared to determine genes that are upregulated in both. The top 25 upregulated genes in both the murine tumors and human CCA specimens are listed.
| Mouse CCA | Human CCA | |||
|---|---|---|---|---|
| Gene | Fold-change (log2) | p - value | Fold-change (log2) | p - value |
| Tgfb2 | 5.13 | 8.1E-46 | 3.33 | 6.5E-31 |
| Wnk2 | 5.59 | 2.3E-45 | 2.34 | 5.7E-17 |
| Krt19 | 5.06 | 4.3E-44 | 2.10 | 2.0E-06 |
| Sema5a | 6.00 | 2.2E-41 | 3.39 | 4.1E-73 |
| Clic6 | 8.27 | 5.8E-37 | 3.46 | 1.3E-29 |
| Glis3 | 5.48 | 2.0E-34 | 2.66 | 1.7E-40 |
| Flnc | 6.37 | 2.5E-33 | 3.04 | 2.4E-16 |
| Hmgcll1 | 7.81 | 4.9E-33 | 5.26 | 1.1E-104 |
| Mki67 | 4.52 | 8.9E-33 | 2.47 | 1.1E-17 |
| Myo5c | 5.91 | 3.8E-32 | 3.89 | 3.0E-49 |
| Pcdh19 | 11.75 | 3.2E-31 | 7.21 | 5.9E-142 |
| Egflam | 5.48 | 8.1E-31 | 2.53 | 4.9E-21 |
| Itgb4 | 5.10 | 9.0E-31 | 5.11 | 5.5E-33 |
| Top2a | 4.27 | 1.1E-30 | 7.24 | 5.9E-82 |
| Sh3pxd2b | 5.25 | 4.6E-30 | 1.37 | 2.2E-07 |
| Ptpn13 | 5.11 | 3.5E-29 | 4.65 | 3.0E-74 |
| Plat | 5.09 | 5.8E-29 | 2.11 | 7.4E-16 |
| Sncg | 5.87 | 1.3E-28 | 7.69 | 8.8E-100 |
| Prom1 | 3.89 | 1.3E-28 | 1.56 | 6.7E-07 |
| Pcyt1b | 5.66 | 4.7E-28 | 2.22 | 3.3E-36 |
| Ptpn14 | 4.06 | 9.1E-28 | 1.19 | 1.0E-07 |
| Afap1 | 4.18 | 1.9E-27 | 6.47 | 1.4E-21 |
| Unc5b | 4.03 | 2.1E-27 | 1.12 | 2.9E-07 |
| Hepacam | 5.90 | 3.4E-27 | 2.44 | 7.5E-11 |
| B4galt6 | 4.05 | 9.3E-27 | 1.50 | 1.7E-03 |
Table 2.
Genes downregulated in murine tumors and human CCA. RNA sequencing was used to analyze genes downregulated in murine tumors compared to corresponding adjacent liver, and in human CCA specimens and corresponding adjacent liver. The differential gene expression in murine tumors and human CCA specimens was compared to determine genes that are downregulated in both. The top 25 downregulated genes in both the murine tumors and human CCA specimens are listed.
| Mouse CCA | Human CCA | |||
|---|---|---|---|---|
| Gene | Fold-change (log2) | p - value | Fold-change (log2) | p - value |
| Hal | -3.45 | 7.5E-06 | -3.93 | 1.6E-22 |
| Igfbp2 | -3.39 | 1.4E-05 | -12.98 | 8.7E-135 |
| Pck1 | -3.36 | 3.8E-04 | -7.97 | 7.6E-60 |
| Hsd17b6 | -3.23 | 5.7E-09 | -1.21 | 9.2E-03 |
| Leap2 | -3.04 | 3.9E-14 | -12.50 | 2.0E-114 |
| Gnmt | -3.02 | 4.2E-05 | -8.97 | 7.1E-49 |
| Hpd | -2.88 | 8.5E-04 | -10.47 | 1.4E-80 |
| Agxt | -2.85 | 1.4E-05 | -1.76 | 3.6E-05 |
| Ces4a | -2.81 | 6.2E-04 | -9.38 | 1.8E-55 |
| Scnn1a | -2.79 | 2.9E-06 | -5.56 | 5.6E-41 |
| Nr0b2 | -2.75 | 3.0E-06 | -1.85 | 4.0E-08 |
| Gls2 | -2.70 | 5.6E-08 | -4.83 | 1.7E-35 |
| Nnmt | -2.63 | 4.3E-09 | -6.89 | 4.4E-20 |
| Kbtbd12 | -2.57 | 4.0E-05 | -10.57 | 1.2E-124 |
| Pon1 | -2.56 | 3.4E-04 | -8.56 | 4.0E-39 |
| Ass1 | -2.54 | 1.0E-08 | -11.57 | 1.2E-220 |
| Ang | -2.52 | 3.0E-05 | -12.69 | 7.8E-116 |
| Eif4ebp3 | -2.52 | 2.2E-08 | -6.82 | 2.7E-10 |
| Slc26a4 | -2.50 | 7.4E-05 | -3.56 | 2.1E-17 |
| Cyp1a2 | -2.48 | 1.2E-03 | -17.90 | 0.0E+00 |
| C8g | -2.48 | 2.5E-07 | -3.40 | 2.9E-27 |
| Cyp2e1 | -2.48 | 7.0E-03 | -15.94 | 3.1E-79 |
| Tymp | -2.44 | 8.1E-09 | -6.76 | 1.6E-150 |
| Slc27a5 | -2.44 | 6.1E-04 | -9.88 | 9.6E-91 |
| Lipc | -2.43 | 3.8E-06 | -13.42 | 6.3E-90 |
A number of signaling cascades including developmental, proliferative, and metabolic have been linked to pathogenesis of CCA.1 Additionally, it has recently been demonstrated that YAP activates the Notch pathway by upregulating jagged 1 (JAG1) in human hepatocellular carcinoma.27 To further elucidate whether these tumors recapitulate these human phenotypes, Notch and IL-6 pathways were investigated. Expression of Notch1, Notch2, Jag1, and Hes1, a transcription target of the Notch signaling pathway, was significantly increased in murine tumors compared to corresponding liver tissue (Fig. 4C). Furthermore, murine tumors had abundant expression of Il-6 and its transcription target anti-apoptotic protein myeloid cell leukemia-1 (Mcl-1) (Fig. 4C).20 Taken together, these findings suggest that murine tumors in our model are morphologically and phenotypically similar to a subset of human CCA.
The IL-33 receptor, ST2, is present in murine tumors and human cholangiocytes
As exogenous IL-33 facilitated tumorigenesis in our murine model, we therefore examined expression of its cognate receptor, ST2. Both cholangiocyte cell lines expressed ST2 (Fig. 5A). Notably, a significant increase in St2 mRNA expression was observed in murine tumors compared to the corresponding liver tissue (Fig. 5B). Furthermore, immunohistochemistry and immunofluorescence also demonstrated abundant ST2 expression in murine tumors (Fig. 5C, 5D). ST2 expression was observed in both the cancer cells and the cancer-associated fibroblasts, suggesting ST2 plays a role in tumor and tumor stroma biology. These data indicate that the mouse CCAs recapitulate the human CCA phenotype in which a significant increase in ST2 expression was also observed (Fig. 5E, 5F). Hence, cholangiocytes and cholangiocarcinoma cells are likely direct targets of IL-33 in our model, and CCA retains the ST2 expression present in non-malignant cholangiocytes.
Figure 5.
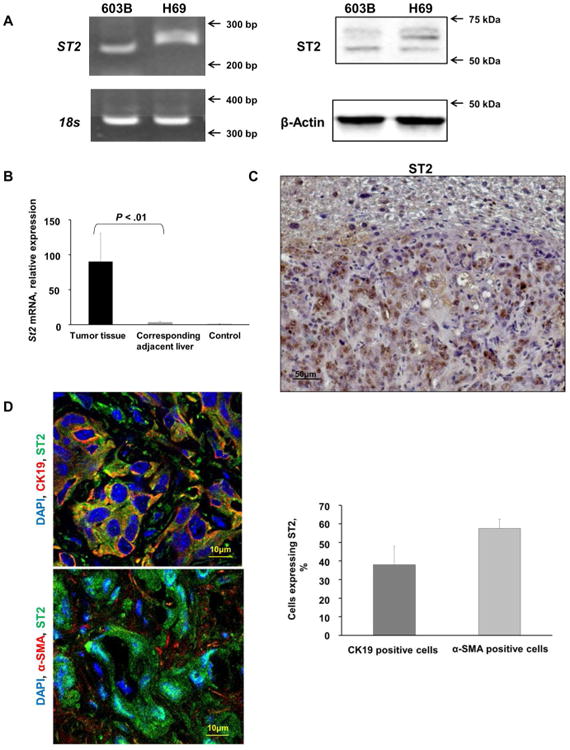
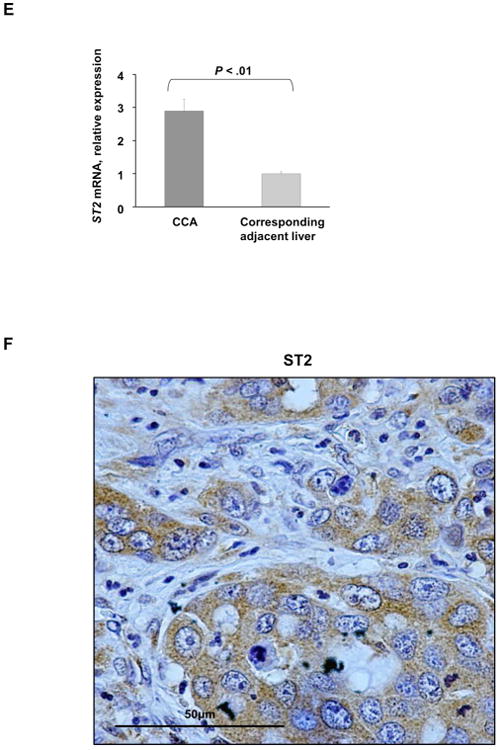
The IL-33 receptor, ST2, is present in murine tumors and human immortalized, non-malignant cholangiocytes and its expression is increased in murine tumors. (A) Expression of ST2 was assessed in mouse (603B) and human immortalized, non-malignant (H69) cholangiocytes using qualitative PCR (left panel) and immunoblot analysis (right panel). 18s was used as a normalization control for PCR and β-Actin was used as a loading control for immunoblot analysis. (B) Expression of St2 was quantified in murine tumors, corresponding adjacent liver, and mouse control liver by qRT-PCR. Mean + SD are depicted for n=5 (control mouse liver tissue) and n=4 (tumor and corresponding adjacent tissue). (C) Immunohistochemistry was used to detect ST2 in murine tumors and corresponding adjacent liver. Original magnification 20×. (D) Immunofluorescence was used to detect ST2 in murine CCA cells (CK19 positive) compared to CAF (α-SMA positive) (left panel). The number of ST2 positive CCA cells and CAF was quantified in 5 high power fields and expressed as a percentage of total. Mean + SD are depicted for n =7 (right panel). Original magnification: 63×. (E) Expression of ST2 was quantified in human resected CCA specimens and corresponding normal livers by qRT-PCR. Mean + SD are depicted for n=12. (F) Immunohistochemistry was used to detect ST2 in human resected CCA specimens. Original magnification: 60×.
IL-33 induces IL-6 expression in murine tumors
We have previously demonstrated that IL-6 contributes to the pathogenesis of CCA by increasing Mcl-1 expression via activation of JAK/STAT signaling cascades.20 To elucidate the potential mechanism underlying IL-33 mediated tumor development, we assessed its effect on various developmental, proliferative, and metabolic pathways. Exposure to IL-33 significantly enhanced IL-6 expression in a human immortalized, but non-malignant cholangiocyte cell line (Fig. 6A). Furthermore, mouse tumor tissue displayed a significant increase in IL-6 levels as assessed by ELISA compared to adjacent liver and control mouse tissue (Fig. 6B). Correspondingly, STAT3 nuclear expression was observed in murine tumor tissues (Fig. 6C). These findings suggest that IL-33 facilitates tumor development by promoting IL-6 expression. Accordingly, CCA development following biliary transduction of AKT/YAP coupled with systemic IL-33 was significantly attenuated in Il-6 -/-mice (Fig. 6D). Interestingly, tumor development was noted in only one mouse. This tumor had expression of PanCK, SOX9, plus HepPar1 (Fig. 6E), features of mixed CCA-HCC, suggesting that IL-6 potentiates both efficient oncogenesis and differentiation to the CCA phenotype. Estrogen-mediated inhibition of IL-6 has been shown to reduce the risk of hepatocellular carcinoma in female mice.28 Interestingly, we also had a reduction in tumor development in female mice compared to male mice consistent with a role for IL-6 in this oncogenic model (Fig. 6F). Consequently, we next sought to determine whether IL-6 can substitute for IL-33. Indeed, systemic administration of IL-6 following biliary transduction of AKT/YAP resulted in tumor development at a rate similar to that observed with oncogene transduction coupled with IL-33 administration (Fig. 6G); these tumors were histologically indistinguishable from those tumors forming following IL-33 administration. Taken together, our data support a novel and important role of the biliary mitogen IL-33 in promoting tumorigenesis by enhancing IL-6 expression, and, indeed, IL-6 can substitute for IL-33 in this carcinogenesis model.
Figure 6.
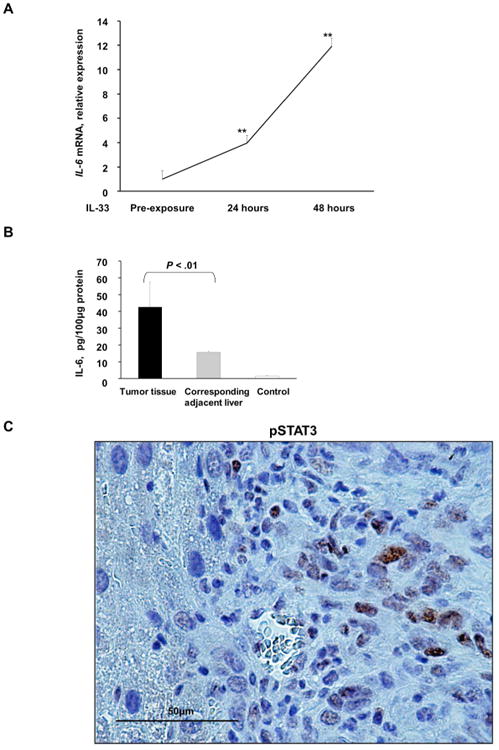
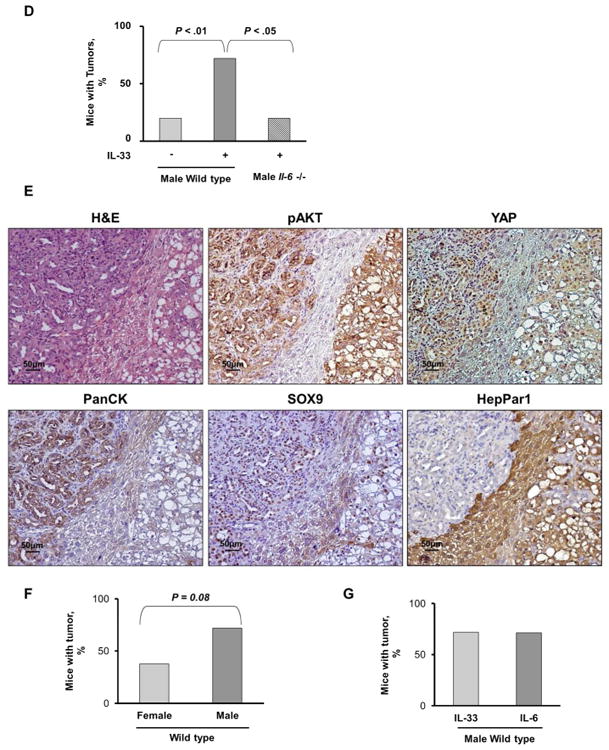
IL-33 induces IL-6 expression in murine normal cholangiocytes and tumors. (A) Expression of Il-6 was quantified using qRT-PCR in murine immortalized, non-malignant cholangiocytes prior to IL-33 exposure and 24 and 48 h after IL-33 (10 ng/mL) exposure. Mean + SD are depicted for n=5, ** P < .01. (B) ELISA was used to detect IL-6 levels in murine tumor tissue, corresponding adjacent liver, and control liver. Mean + SD are depicted for n=3 (murine tumor and corresponding adjacent liver) and n=5 (murine control liver). (C) Immunohistochemistry was used to detect phospho-STAT3 (pSTAT3) in murine tumors. Original magnification: 60×. (D) Il-6 -/- mice were sacrificed 10 weeks after having undergone biliary transduction of SB+AKT+YAP coupled with BDL and subsequent systemic IL-33 administration (1 μg i.p. for 3 days). Percentage of animals with tumors (n=5). (E) Representative photomicrograph of hematoxylin and eosin-stained tumor sections (H&E) and adjacent liver are shown. Immunohistochemistry was used to detect pAKT, YAP, PanCK, SOX9, and HepPar1 expression in these mice. Original magnification: 20×. (F) Female C57BL/6 mice were sacrificed 10 weeks after having undergone biliary transduction of SB+AKT+YAP coupled with BDL and subsequent systemic IL-33 administration (1 μg i.p. for 3 days). Percentage of animals with tumors (n=8). (G) Male C57BL/6 mice were sacrificed 10 weeks after having undergone biliary transduction of SB+AKT+YAP coupled with BDL and subsequent systemic IL-6 administration (1 μg i.p. for 3 days). Percentage of animals with tumors (n=7).
Discussion
This study describes a new model of murine CCA. These data indicate that: i) direct instillation of a Sleeping Beauty transposase with oncogene containing transposons is sufficient to transduce the biliary epithelia; ii) IL-33 administration facilitates tumor development following transduction of the biliary epithelia; iii) the tumors which develop are morphologically and phenotypically similar to human CCA; and iv) IL-33 promotion of tumor development appears to be, in part, IL-6-dependent. These findings are discussed in greater detail below.
Hydrodynamic injection of Sleeping Beauty transposase plus oncogene containing transposons via the tail vein will transduce a sufficient number of hepatocytes to induce liver tumors.14 Indeed, transduction of the liver with active Notch plus AKT signaling oncogenes results in the development of intrahepatic cholangiocarcinoma.29 However, these tumors are cystic in morphology and are derived from hepatocytes and hence may not mimic desmoplastic human CCA arising from the biliary epithelia. Therefore, we extended this model by direct instillation of the transposon transduction system into the biliary tree. Despite the absence of a hydrodynamic process, transduction of biliary epithelial cells with the oncogenes was observed, suggesting biliary epithelial cells are unexpectedly susceptible to this transduction approach; perhaps, components in bile (lipids and bile acids) may support the uptake of transposons via the apical surface of cholangiocytes.
We chose AKT and YAP oncogenes to develop this model given the importance of AKT in many cancers including CCA,8, 9 and YAP because not only is it a relevant oncogene but also preliminary data from the systemic hydrodynamic transduction approach demonstrated development of desmoplastic liver cancers with this oncogene (data not shown), a cardinal feature of human CCA. Although the combination of intrabiliary instillation of constitutively active AKT and YAP oncogenes did result in the development of CCA, the efficiency was modest. Based on this experience, we reasoned a potent biliary mitogen would promote the necessary chromatin changes required for efficient oncogenic signaling and thereby promote CCA development. IL-33 was recently identified to be a potent biliary mitogen and participate in biliary repair processes.11 Given this information, we examined a role for IL-33 in oncogene-induced murine CCA development, and observed a 3-fold increase in mice developing this CCA in the presence of this cytokine. Whether this effect of IL-33 is direct or indirect is unclear. The receptor for IL-33, ST2, was observed in murine cholangiocytes and a human cholangiocyte cell line and responded to IL-33 by generating IL-6, a canonical cellular response to ST2 stimulation. The importance of this pathway in CCA oncogenesis was substantiated by demonstrating that IL-6 can substitute for IL-33 in facilitating tumorigenesis in this model, and by the observation that a significant reduction in CCA development occurs in Il-6 -/- mice. IL-6 dependence of this tumor development is similar to the requirement for IL-6 in the development of murine hepatocellular carcinoma.30 IL-33 also has been shown to promote liver inflammation and fibrosis,12 processes providing a substrate for hepatobiliary tumor development.1 Hence, likely by affecting multiple pro-tumor processes, direct and indirect, IL-33 facilitates oncogene-induced CCA in mice.
Our current model employs YAP oncogenesis, an inflammatory cytokine, and segmental bile duct obstruction to cause CCA. All three components of this model are germane to human CCA. First, YAP nuclear expression is present in a large subset of human CCA, implicating dysregulation of the Hippo signaling pathway in human cancer.31 Second, our model of CCA appears to be phenotypically similar to the inflammatory subset of human CCAs described by Sia et al.3 For example, the cancers were desmoplastic and manifest activated STAT3, key features of the inflammatory subset of CCA. IL-6, a major inflammatory cytokine, is richly expressed by human CCA,32 and plays a survival role in these cells by a STAT3-dependent upregulation of the antiapoptotic Bcl-2 protein Mcl-1.8 Identical pathway activation was also present in our murine model of CCA. Finally, our employment of segmental bile duct obstruction (used to retain the transposons within the biliary system) may also promote oncogenesis by inducing obstructive cholestasis, a known contributor to human CCA development.1 Thus, our model of murine CCA matches a subset of human CCA.
In summary, we have developed a murine model of murine CCA which is time-efficient, robust, arises in situ from the biliary epithelia, and mimics many features of the human disease. The model should prove quite useful in exploring oncogenic signaling in these cancers. For example, the role of IDH mutations or FGFR2 fusion genes described in human CCA can now be readily examined in our model. The model also lends itself to therapeutic studies, and exploitation of this feature may be its greatest potential.
Supplementary Material
Supplementary Figure 1. Histologic and phenotypic features of tumors in mice with biliary transduction of SB+AKT+YAP coupled with BDL. Representative photomicrograph of hematoxylin and eosin-stained tumor sections and adjacent liver from mice having undergone biliary transduction of AKT+YAP coupled with BDL. Immunohistochemistry was used to detect pAKT, YAP, PanCK, SOX9, and HepPar1 in these murine tumors. Original magnification: 20×.
Supplementary Figure 2. Immunohistochemical staining with PanCK has similar efficiency as CK19 staining in identifying the biliary epithelia. Representative photomicrograph of hematoxylin and eosin-stained tumor sections and adjacent liver from mice having undergone biliary transduction of AKT+YAP coupled with BDL and systemic IL-33 administration. Immunohistochemical staining was used to identify the biliary epithelia using CK19.
Supplementary Table 1. Real-Time PCR Primers
Acknowledgments
We thank Ms. Courtney Hoover for excellent secretarial support.
Financial Support: This work was supported by National Institutes of Health grants DK59427 (G.J.G.) and T32DK007198 (S.R. and N.R.), K12 CA90628 (M.J.B), DK64008 and DK83781 (J.A.B.), R01CA136606 (X.C.), DK84567 (Optical Microscopy Core for the Mayo Center for Cell Signaling in Gastroenterology), and the Mayo Foundation. S. Rizvi also received support from the American Liver Foundation and International Liver Cancer Association.
Abbreviations
- α-SMA
α-smooth muscle actin
- BDL
bile duct ligation
- CAF
cancer-associated fibroblasts
- CCA
cholangiocarcinoma
- GFP
green fluorescent protein
- HCC
hepatocellular carcinoma
- IL
interleukin
- IDH
isocitrate dehydrogenase
- JAG1
jagged 1
- MCL-1
myeloid cell leukemia-1
- PanCK
pancytokeratin
- STAT
signal transducer and activator of transcription
- YAP
Yes-associated protein
Footnotes
The authors have nothing to disclose.
References
- 1.Rizvi S, Gores GJ. Pathogenesis, diagnosis, and management of cholangiocarcinoma. Gastroenterology. 2013;145:1215–29. doi: 10.1053/j.gastro.2013.10.013. [DOI] [PMC free article] [PubMed] [Google Scholar]
- 2.Tyson GL, El-Serag HB. Risk factors for cholangiocarcinoma. Hepatology. 2011;54:173–84. doi: 10.1002/hep.24351. [DOI] [PMC free article] [PubMed] [Google Scholar]
- 3.Sia D, Hoshida Y, Villanueva A, Roayaie S, Ferrer J, Tabak B, Peix J, Sole M, Tovar V, Alsinet C, Cornella H, Klotzle B, Fan JB, Cotsoglou C, Thung SN, Fuster J, Waxman S, Garcia-Valdecasas JC, Bruix J, Schwartz ME, Beroukhim R, Mazzaferro V, Llovet JM. Integrative molecular analysis of intrahepatic cholangiocarcinoma reveals 2 classes that have different outcomes. Gastroenterology. 2013;144:829–40. doi: 10.1053/j.gastro.2013.01.001. [DOI] [PMC free article] [PubMed] [Google Scholar]
- 4.Sirica AE. The role of cancer-associated myofibroblasts in intrahepatic cholangiocarcinoma. Nat Rev Gastroenterol Hepatol. 2012;9:44–54. doi: 10.1038/nrgastro.2011.222. [DOI] [PubMed] [Google Scholar]
- 5.Everhart JE, Ruhl CE. Burden of digestive diseases in the United States Part III: Liver, biliary tract, and pancreas. Gastroenterology. 2009;136:1134–44. doi: 10.1053/j.gastro.2009.02.038. [DOI] [PubMed] [Google Scholar]
- 6.Ko KS, Peng J, Yang H. Animal models of cholangiocarcinoma. Curr Opin Gastroenterol. 2013;29:312–8. doi: 10.1097/MOG.0b013e32835d6a3e. [DOI] [PubMed] [Google Scholar]
- 7.Pan D. The hippo signaling pathway in development and cancer. Dev Cell. 2010;19:491–505. doi: 10.1016/j.devcel.2010.09.011. [DOI] [PMC free article] [PubMed] [Google Scholar]
- 8.Kobayashi S, Werneburg NW, Bronk SF, Kaufmann SH, Gores GJ. Interleukin-6 contributes to Mcl-1 up-regulation and TRAIL resistance via an Akt-signaling pathway in cholangiocarcinoma cells. Gastroenterology. 2005;128:2054–65. doi: 10.1053/j.gastro.2005.03.010. [DOI] [PubMed] [Google Scholar]
- 9.Menakongka A, Suthiphongchai T. Involvement of PI3K and ERK1/2 pathways in hepatocyte growth factor-induced cholangiocarcinoma cell invasion. World J Gastroenterol. 2010;16:713–22. doi: 10.3748/wjg.v16.i6.713. [DOI] [PMC free article] [PubMed] [Google Scholar]
- 10.Tao J, Calvisi DF, Ranganathan S, Cigliano A, Zhou L, Singh S, Jiang L, Fan B, Terracciano L, Armeanu-Ebinger S, Ribback S, Dombrowski F, Evert M, Chen X, Monga SP. Activation of beta Catenin and Yap1 in Human Hepatoblastoma and Induction of Hepatocarcinogenesis in Mice. Gastroenterology. 2014 doi: 10.1053/j.gastro.2014.05.004. [DOI] [PMC free article] [PubMed] [Google Scholar]
- 11.Li J, Razumilava N, Gores GJ, Walters S, Mizuochi T, Mourya R, Bessho K, Wang YH, Glaser SS, Shivakumar P, Bezerra JA. Biliary repair and carcinogenesis are mediated by IL-33-dependent cholangiocyte proliferation. J Clin Invest. 2014;124:3241–51. doi: 10.1172/JCI73742. [DOI] [PMC free article] [PubMed] [Google Scholar]
- 12.Marvie P, Lisbonne M, L'Helgoualc'h A, Rauch M, Turlin B, Preisser L, Bourd-Boittin K, Theret N, Gascan H, Piquet-Pellorce C, Samson M. Interleukin-33 overexpression is associated with liver fibrosis in mice and humans. J Cell Mol Med. 2010;14:1726–39. doi: 10.1111/j.1582-4934.2009.00801.x. [DOI] [PMC free article] [PubMed] [Google Scholar]
- 13.Rizvi S, Mertens JC, Bronk SF, Hirsova P, Dai H, Roberts LR, Kaufmann SH, Gores GJ. Platelet-Derived Growth Factor Primes Cancer-Associated Fibroblasts For Apoptosis. The Journal of biological chemistry. 2014 doi: 10.1074/jbc.M114.563064. [DOI] [PMC free article] [PubMed] [Google Scholar]
- 14.Chen X, Calvisi DF. Hydrodynamic transfection for generation of novel mouse models for liver cancer research. Am J Pathol. 2014;184:912–23. doi: 10.1016/j.ajpath.2013.12.002. [DOI] [PMC free article] [PubMed] [Google Scholar]
- 15.Grubman SA, Perrone RD, Lee DW, Murray SL, Rogers LC, Wolkoff LI, Mulberg AE, Cherington V, Jefferson DM. Regulation of intracellular pH by immortalized human intrahepatic biliary epithelial cell lines. The American journal of physiology. 1994;266:G1060–70. doi: 10.1152/ajpgi.1994.266.6.G1060. [DOI] [PubMed] [Google Scholar]
- 16.O'Hara SP, Splinter PL, Trussoni CE, Gajdos GB, Lineswala PN, LaRusso NF. Cholangiocyte N-Ras protein mediates lipopolysaccharide-induced interleukin 6 secretion and proliferation. The Journal of biological chemistry. 2011;286:30352–60. doi: 10.1074/jbc.M111.269464. [DOI] [PMC free article] [PubMed] [Google Scholar]
- 17.Ishimura N, Bronk SF, Gores GJ. Inducible nitric oxide synthase upregulates cyclooxygenase-2 in mouse cholangiocytes promoting cell growth. American journal of physiology Gastrointestinal and liver physiology. 2004;287:G88–95. doi: 10.1152/ajpgi.00539.2003. [DOI] [PubMed] [Google Scholar]
- 18.Yahagi K, Ishii M, Kobayashi K, Ueno Y, Mano Y, Niitsuma H, Igarashi T, Toyota T. Primary culture of cholangiocytes from normal mouse liver. In vitro cellular & developmental biology Animal. 1998;34:512–4. doi: 10.1007/s11626-998-0106-x. [DOI] [PubMed] [Google Scholar]
- 19.Zhang N, Bai H, David KK, Dong J, Zheng Y, Cai J, Giovannini M, Liu P, Anders RA, Pan D. The Merlin/NF2 tumor suppressor functions through the YAP oncoprotein to regulate tissue homeostasis in mammals. Dev Cell. 2010;19:27–38. doi: 10.1016/j.devcel.2010.06.015. [DOI] [PMC free article] [PubMed] [Google Scholar]
- 20.Isomoto H, Kobayashi S, Werneburg NW, Bronk SF, Guicciardi ME, Frank DA, Gores GJ. Interleukin 6 upregulates myeloid cell leukemia-1 expression through a STAT3 pathway in cholangiocarcinoma cells. Hepatology. 2005;42:1329–38. doi: 10.1002/hep.20966. [DOI] [PubMed] [Google Scholar]
- 21.Kalari KR, Nair AA, Bhavsar JD, O'Brien DR, Davila JI, Bockol MA, Nie J, Tang X, Baheti S, Doughty JB, Middha S, Sicotte H, Thompson AE, Asmann YW, Kocher JP. MAP-RSeq: Mayo Analysis Pipeline for RNA sequencing. BMC Bioinformatics. 2014;15:224. doi: 10.1186/1471-2105-15-224. [DOI] [PMC free article] [PubMed] [Google Scholar]
- 22.Wang L, Wang S, Li W. RSeQC: quality control of RNA-seq experiments. Bioinformatics. 2012;28:2184–5. doi: 10.1093/bioinformatics/bts356. [DOI] [PubMed] [Google Scholar]
- 23.Trapnell C, Pachter L, Salzberg SL. TopHat: discovering splice junctions with RNA-Seq. Bioinformatics. 2009;25:1105–11. doi: 10.1093/bioinformatics/btp120. [DOI] [PMC free article] [PubMed] [Google Scholar]
- 24.Langmead B, Trapnell C, Pop M, Salzberg SL. Ultrafast and memory-efficient alignment of short DNA sequences to the human genome. Genome Biol. 2009;10:R25. doi: 10.1186/gb-2009-10-3-r25. [DOI] [PMC free article] [PubMed] [Google Scholar]
- 25.Robinson MD, McCarthy DJ, Smyth GK. edgeR: a Bioconductor package for differential expression analysis of digital gene expression data. Bioinformatics. 2010;26:139–40. doi: 10.1093/bioinformatics/btp616. [DOI] [PMC free article] [PubMed] [Google Scholar]
- 26.Mott JL, Bronk SF, Mesa RA, Kaufmann SH, Gores GJ. BH3-only protein mimetic obatoclax sensitizes cholangiocarcinoma cells to Apo2L/TRAIL-induced apoptosis. Mol Cancer Ther. 2008;7:2339–47. doi: 10.1158/1535-7163.MCT-08-0285. [DOI] [PMC free article] [PubMed] [Google Scholar]
- 27.Tschaharganeh DF, Chen X, Latzko P, Malz M, Gaida MM, Felix K, Ladu S, Singer S, Pinna F, Gretz N, Sticht C, Tomasi ML, Delogu S, Evert M, Fan B, Ribback S, Jiang L, Brozzetti S, Bergmann F, Dombrowski F, Schirmacher P, Calvisi DF, Breuhahn K. Yes-associated protein up-regulates Jagged-1 and activates the Notch pathway in human hepatocellular carcinoma. Gastroenterology. 2013;144:1530–1542 e12. doi: 10.1053/j.gastro.2013.02.009. [DOI] [PMC free article] [PubMed] [Google Scholar]
- 28.Naugler WE, Sakurai T, Kim S, Maeda S, Kim K, Elsharkawy AM, Karin M. Gender disparity in liver cancer due to sex differences in MyD88-dependent IL-6 production. Science. 2007;317:121–4. doi: 10.1126/science.1140485. [DOI] [PubMed] [Google Scholar]
- 29.Fan B, Malato Y, Calvisi DF, Naqvi S, Razumilava N, Ribback S, Gores GJ, Dombrowski F, Evert M, Chen X, Willenbring H. Cholangiocarcinomas can originate from hepatocytes in mice. J Clin Invest. 2012;122:2911–5. doi: 10.1172/JCI63212. [DOI] [PMC free article] [PubMed] [Google Scholar]
- 30.He G, Dhar D, Nakagawa H, Font-Burgada J, Ogata H, Jiang Y, Shalapour S, Seki E, Yost SE, Jepsen K, Frazer KA, Harismendy O, Hatziapostolou M, Iliopoulos D, Suetsugu A, Hoffman RM, Tateishi R, Koike K, Karin M. Identification of liver cancer progenitors whose malignant progression depends on autocrine IL-6 signaling. Cell. 2013;155:384–96. doi: 10.1016/j.cell.2013.09.031. [DOI] [PMC free article] [PubMed] [Google Scholar]
- 31.Li H, Wolfe A, Septer S, Edwards G, Zhong X, Abdulkarim AB, Ranganathan S, Apte U. Deregulation of Hippo kinase signalling in human hepatic malignancies. Liver international: official journal of the International Association for the Study of the Liver. 2012;32:38–47. doi: 10.1111/j.1478-3231.2011.02646.x. [DOI] [PMC free article] [PubMed] [Google Scholar]
- 32.Chandra PK, Bao L, Song K, Aboulnasr FM, Baker DP, Shores N, Wimley WC, Liu S, Hagedorn CH, Fuchs SY, Wu T, Balart LA, Dash S. HCV infection selectively impairs type I but not type III IFN signaling. Am J Pathol. 2014;184:214–29. doi: 10.1016/j.ajpath.2013.10.005. [DOI] [PMC free article] [PubMed] [Google Scholar]
Associated Data
This section collects any data citations, data availability statements, or supplementary materials included in this article.
Supplementary Materials
Supplementary Figure 1. Histologic and phenotypic features of tumors in mice with biliary transduction of SB+AKT+YAP coupled with BDL. Representative photomicrograph of hematoxylin and eosin-stained tumor sections and adjacent liver from mice having undergone biliary transduction of AKT+YAP coupled with BDL. Immunohistochemistry was used to detect pAKT, YAP, PanCK, SOX9, and HepPar1 in these murine tumors. Original magnification: 20×.
Supplementary Figure 2. Immunohistochemical staining with PanCK has similar efficiency as CK19 staining in identifying the biliary epithelia. Representative photomicrograph of hematoxylin and eosin-stained tumor sections and adjacent liver from mice having undergone biliary transduction of AKT+YAP coupled with BDL and systemic IL-33 administration. Immunohistochemical staining was used to identify the biliary epithelia using CK19.
Supplementary Table 1. Real-Time PCR Primers