

Abstract
Our previous work has suggested that traumatic noise activates Rho-GTPase pathways in cochlear outer hair cells (OHCs), resulting in cell death and noise-induced hearing loss (NIHL). In this study, we investigated Rho effectors, Rho-associated kinases (ROCKs), and the targets of ROCKs, the ezrin-radixin-moesin (ERM) proteins, in the regulation of the cochlear actin cytoskeleton using adult CBA/J mice under conditions of noise-induced temporary threshold shift (TTS) and permanent threshold shift (PTS) hearing loss, which result in changes to the F/G-actin ratio. The levels of cochlear ROCK2 and p-ERM decreased 1 h after either TTS- or PTS-noise exposure. In contrast, ROCK2 and p-ERM in OHCs decreased only after PTS-, not after TTS-noise exposure. Treatment with lysophosphatidic acid, an activator of the Rho pathway, resulted in significant reversal of the F/G-actin ratio changes caused by noise exposure and attenuated OHC death and NIHL. Conversely, the down-regulation of ROCK2 by pretreatment with ROCK2 siRNA reduced the expression of ROCK2 and p-ERM in OHCs, exacerbated TTS to PTS, and worsened OHC loss. Additionally, pretreatment with siRNA against radixin, an ERM protein, aggravated TTS to PTS. Our results indicate that a ROCK2-mediated ERM-phosphorylation signaling cascade modulates noise-induced hair cell loss and NIHL by targeting the cytoskeleton.
Keywords: Noise-induced hearing loss, Rho-associated kinases, Actin cytoskeleton, ROCK2 siRNA, Radixin siRNA
Introduction
The sensory hair cells of the organ of Corti transduce acoustic input into nerve impulses, which are then transmitted to the brain. However, hair cells are delicate and can be damaged by intense sound. Above a certain threshold, the greater the intensity of a sound stimulus, the greater the damage to cochlear sensory hair cells can appear to be. Sensory hair cells are the primary targets of noise trauma, resulting in hair cell death, which leads to noise-induced hearing loss (NIHL). NIHL can be divided into two subtypes—temporary hearing loss or temporary threshold shifts (TTS), and permanent hearing loss or permanent threshold shifts (PTS)—based on the duration and severity of hearing loss and characteristic pathological features of the hair cells after exposure. Because mammals lack the ability to regenerate cochlear hair cells, hair cell losses along the organ of Corti lead to PTS. On the other hand, transient high intensity noise may cause TTS for minutes, hours, or days, depending on the parameters of the sound stimulus, but without loss of hair cells. Although NIHL is increasing in industrialized countries, the comprehensive mechanism of hair cell death in NIHL remains unknown. Previous reports have specifically described changes in F-actin in cochlear hair cells of guinea pigs and chinchillas after noise exposure (Raphael & Altschuler 1992, Hu et al. 2002). Our previous work showed that traumatic noise exposure decreases Rho GTPases, resulting in cochlear outer hair cell (OHC) death and NIHL in mice (Chen et al. 2012). However, the involvement of the downstream effectors of Rho family proteins, for example, Rho-associated kinases (ROCKs) and the targets of ROCKs, the ezrin-radixin-moesin (ERM) proteins, in regulation of F-actin depolymerization following noise stimulation is unknown. This investigation is a continuation of our previous study and further tests our hypothesis that noise-induced F-actin depolymerization in OHCs is mediated by ROCK/ERM signaling pathways.
Rho GTPases are the major modulators of the actin cytoskeleton. Once activated, the Rho GTPases bind to a spectrum of effectors to stimulate downstream signaling pathways. ROCKs are one of the major targets of the RhoA family in terms of the reorganization of actin-based cytoskeletons (Leung et al. 1996, Amano et al. 1997). The two isoforms, ROCK1 and ROCK2, share 65% homology in their overall amino acid sequence and 92% homology in their kinase domains. However, they have different subcellular localizations and employ different biological functions. ROCK1 is involved in destabilizing the actin cytoskeleton. In contrast, ROCK2 is required for stabilizing the actin cytoskeleton. ROCK1 is expressed at high levels in heart, kidney, skeletal muscle, pancreas, lung, and liver tissues, but it is nearly absent in the brain; whereas ROCK2 is abundantly expressed in the brain and lung (Amano et al. 2000). There is no redundancy between ROCK2 and ROCK1, based on studies using ROCK1-knockout (ROCK1−/−) and ROCK2-knockout (ROCK2−/−) mice (Shimizu et al. 2005, Thumkeo et al. 2003), indicating that these proteins have non-overlapping roles in vivo (Street & Bryan 2011). In the auditory system, ROCK-mediated signaling modulates the function of the cochlear amplifier by modification of the cytoskeleton (Zhang et al. 2003, Matsumoto et al. 2010).
ROCK substrates, the ezrin-radixin-moesin (ERM) proteins, are cross-linkers that connect the plasma membrane and the actin cytoskeleton. ERM proteins are involved in a wide variety of actin-mediated cellular events, such as the formation of microvilli, cell-cell adhesion, maintenance of cell shape, cell mobility, apoptosis, and membrane trafficking (Louvet-Vallee 2000). Among these proteins, radixin is important for auditory development and maintenance (Khan et al. 2007). Radixin is mainly expressed along the length of hair cell stereocilia from both the organ of Corti and the vestibular system (Zhao et al. 2012). In the mouse, knockout of the radixin gene (Rdx) is associated with early postnatal progressive degeneration of cochlear stereocilia and subsequent deafness (Kitajiri et al. 2004). The three ERM proteins possess very similar structures with a COOH-terminal actin-binding domain and an NH2-terminal FERM-interacting domain (Valderrama et al. 2012). Phosphorylation at a C-terminal threonine residue (Thr 567 of ezrin, Thr 564 of radixin, or Thr 558 of moesin) is required for the activation of ERM proteins, which has been shown to be mediated by ROCK (Amano et al. 2000).
The structure of auditory sensory hair cells depends on their actin-based cytoskeleton (Kruth & Rubenstein 2012). Filamentous actin (F-actin) is a primary component of this cytoskeleton (Szarama et al. 2012, Atencia et al. 2000) and is involved in the regulation of physiological functions including motility, adhesion, proliferation, and maintenance of cellular shape (Asumendi et al. 2000, Matsumoto et al. 2010). In response to sound stimuli of various intensities, F-actin is continuously being remodeled in order to maintain hair cell function (Welch et al. 1997). Since the ability of hair cells to transmit and modulate mechanical sound stimuli depends on the cell structure, clarifying the molecular basis of the F-actin alterations following noise exposure can further our understanding of important mechanisms underlying NIHL. In this study, we investigated the regulation of ROCK2 and p-ERM proteins in NIHL using an adult CBA/J mouse model under conditions of noise-induced permanent threshold shifts (PTS noise) or temporary threshold shifts (TTS noise). Lysophosphatidic acid (LPA) is a phospholipid derivative that binds to specific G-protein-coupled receptors as a pharmacological activator of RhoA-mediated signaling pathways (Moolenaar et al. 2004). We applied LPA to adult mice to determine if up-regulation of the RhoA pathway could reverse noise-induced F-actin depolymerization. Furthermore, administration of LPA, silencing of ROCK2, and silencing of radixin were used to assess modulation of noise-induced OHC loss and NIHL.
Materials and methods
Materials
The antibodies used in this study were: monoclonal anti-ROCK1 (Cytoskeleton, Denver, CO, USA, #ARC03), monoclonal rabbit anti-ROCK2 (Abcam, Cambridge, MA, USA, #ab125025), monoclonal rabbit anti-phospho-ERM (Cell Signaling Technology, Danvers, MA, USA, #3149), monoclonal rabbit anti-radixin (Abcam #ab52495), polyclonal mouse anti-GAPDH (Millipore, Billerica, MA, USA, #ABS16), and polyclonal rabbit anti-myosin VII (Proteus Biosciences Inc., Ramona, CA, USA, #25-6790). Secondary antibodies for Western blotting were obtained from Jackson ImmunoResearch Laboratories (West Grove, PA, USA), and secondary Alexa 594 fluorescent antibodies from Invitrogen (Carlsbad, CA, USA). ROCK2-siRNA (#s73020), radixin-siRNA (#201923) and scrambled-siRNA were also purchased from Invitrogen. LPA (#62215) was from Cayman Chemical Inc. (Ann Arbor, MI, USA). ECL and Supersignal Dura-Enhanced Chemiluminescence Plus (ECL-Plus) for Western blot detection and PageRuler Plus protein ladder were purchased from Fisher Scientific (Waltham, MA, USA). The G-actin/F-actin in vivo assay kit (#BK037) was from Cytoskeleton. All other reagents were purchased from Sigma-Aldrich (St. Louis, MO, USA).
Animals
Specific-pathogen-free male CBA/J mice at 11 weeks of age (Harlan Sprague Dawley, Indianapolis, IN, USA) had free access to water and a regular mouse diet (Purina 5025, St. Louis, MO, USA) and were kept at 22 ± 1 °C under a standard 12-h light-dark cycle to acclimate for 1 week before the experiments. All research protocols were approved by the Institutional Animal Care and Use Committee at the Medical University of South Carolina (MUSC). Animal care was under the supervision of the Division of Laboratory Animal Resources at MUSC.
Noise exposure
Unrestrained CBA/J mice at 12 weeks of age were exposed in a sound chamber as reported previously (Chen et al. 2012, Zheng et al. 2014). Mice were exposed to broadband noise (BBN) with a frequency spectrum from 2–20 kHz at 98 dB SPL for 2 h to induce PTS or 92 and 96 dB SPL to induce TTS. Noise calibration to target SPL was performed immediately before each exposure session. The sound intensity of the environment surrounding the cages was 65 dB as measured with a sound level meter (model 1200; Quest Technologies, Oconomovoc, WI, USA). Control mice were kept in the same chamber for 2 h without use of the loudspeaker. Based on our previous study, we focused on the molecular cascades of ROCK2/p-ERM pathways at the time point of 1 h after noise exposure (Chen et al. 2012).
Auditory brainstem responses (ABR)
We followed the ABR measurement procedure that has been described in detail previously (Chen et al. 2012, Zheng et al. 2014). All ABR measurements were conducted by the same experimenter. The ABR scores were assigned by an expert who was blinded to the treatment conditions.
Drug administration
Based on the literature, we first assessed the LPA dose response with 10–40-mg/kg doses to test if mice could tolerate four IP injections by monitoring body weight and assessing fur appearance (Fan et al., 2008). Only the 40-mg/kg dose resulted in loss of body weight after four injections; hence the 30-mg/kg dose was used for further study. The stock solution of LPA was dissolved in phosphate-buffered saline (PBS) and diluted in saline immediately before the injection. For F/G-actin ratio assays, each animal received a total of three IP injections of LPA administered 24 h before, immediately before, and immediately after noise exposure. The animals were euthanized 1 h after noise exposure. For evaluation of auditory thresholds, the mice received a fourth IP injection 24 h after noise exposure. Control animals received the vehicle solution on the same schedule.
Intra-tympanic delivery of siRNA
The ROCK2-siRNA (siROCK2), radixin-siRNA (siRadixin), and scrambled siRNA (siControl) were locally delivered via intra-tympanic application as previously described (Oishi et al. 2013, Chen et al. 2013). Briefly, a retroauricular incision was made to approach the temporal bone after anesthesia. A shallow hole was made in the thin part of the otic bulla with a 30-G needle and enlarged with a dental drill to a diameter of 2 mm in order to visualize the round window. A customized sterile micro medical tube was inserted into the hole just above the round window to slowly deliver 10 μL of siRNA. After the siRNA was delivered, the hole was covered with the surrounding muscles and glued with tissue adhesive. Finally, the skin incision was closed with tissue adhesive. The mouse was kept in the surgical position for about 1 h. Seventy-two hours after siRNA delivery, the animals were exposed to BBN or kept in silence in the noise chamber for 2 h. Two concentrations of siROCK2 and siRadixin were tested for final treatment doses of 0.3 µg and 0.6 µg for preliminary study. Finally, doses of siRNA were selected (siROCK2: 0.3 ìg; siRadixin: 0.6 ìg; siControl: 0.6 ìg) based on the efficiency of siRNA treatment.
Immunocytochemistry on cochlear surface preparations and quantification of the immunofluorescence signals from basal-turn surface preparations
The detailed procedure for immunocytochemistry is described in our previous reports (Chen et al. 2012, Zheng et al. 2014). The concentrations of primary antibodies used in these studies were anti-ROCK2 (1:50), anti-phospho-ERM (1:50), or anti-radixin (1:50). Alexa-Fluor-594-conjugated secondary antibody was at a concentration of 1:200 and Alexa Fluor 488 phalloidin at a concentration of 1:100.
Immunofluorescence of ROCK2, p-ERM, or radixin on surface preparations was quantified from original confocal images, each taken with a 63×-magnification lens under identical conditions and equal parameter settings for laser gains and photomultiplier tube gains, using Image J software (National Institutes of Health, Bethesda, MD, USA). All surface preparations were counter-labeled with Alexa Fluor 488 phalloidin (green) for labeling OHC structure in order to identify the comparable parts of the OHCs for capture of confocal images. The borders of each individual OHC were outlined based on the phalloidin labeling. The immunolabeling of ROCK2, p-ERM, or radixin in OHCs was measured in the basal turn of surface preparations in 0.12-mm segments, each containing about 60 OHCs. The intensity of the background fluorescence was subtracted and the average fluorescence per cell was then calculated. The relative fluorescence was quantified by normalizing the ratio of average fluorescence in OHCs of noise-exposed mice to that of the average fluorescence of the unexposed mice from the same set of the experiments handled in parallel with identical procedures.
Surface preparations and diaminobenzidine (DAB) staining of cochlear epithelia for hair cell counts
We followed the detailed procedures for surface preparations and DAB-staining of myosin VII-labeled cochlear sensory epithelia for hair cell counts described in our previous reports (Chen et al. 2012, Zheng et al. 2014). Images from the apex through the base of the DAB-stained surface preparations were captured using a 40×-magnification lens on a Zeiss laser confocal microscope (Zeiss LSM 510). The lengths of the cochlear epithelia were measured and recorded in millimeters. OHCs were counted from the apex to the base along the entire length of the mouse cochlear epithelium. Percentages of OHC loss in each 0.5-mm length of epithelium were plotted as a function of the cochlear length as a cytocochleogram.
Fluorescence-staining of cryosections
Frozen sections of 8-ìm thickness were incubated in 0.3% Triton X-100 in PBS for 30 min at room temperature. The specimens were washed three times with PBS and incubated with Alexa Fluor 488 phalloidin at a concentration of 1:100 for 1 h at room temperature. Then the specimens were incubated with propidium iodide at a concentration of 1:250 for 1 h at room temperature after washing with PBS. Specimens were mounted on slides with Fluoro-gel with Tris buffer. Sections were imaged with the Zeiss microscope.
Extraction of total cochlear protein for Western blot analysis
The detailed procedure for extraction of total cochlear protein for Western blot is described in our previous publications (Chen et al. 2012, Zheng et al. 2014). Briefly, tissues from the cochleae of an individual mouse were homogenized in ice-cold RIPA lysis buffer (Sigma-Aldrich) plus Phosphatase Inhibitor Cocktails II and III (Sigma-Aldrich) and Roche Protease Inhibitor (Roche Diagnostic). The concentrations of primary antibodies were monoclonal anti-ROCK1 (1:1,000), monoclonal anti-ROCK2 (1:8,000), monoclonal anti-p-ERM (1:1,500), and monoclonal anti-Radixin (1:5,000). The membranes were then stripped and relabeled for GAPDH with polyclonal anti-GAPDH at a concentration of 1:20,000 as a control for sample loading.
X-ray films of Western blots were scanned and analyzed using Image J software. The band densities were first normalized to background. Next, the probing protein/GAPDH ratio was calculated from the band densities run on the same gel. Finally, the difference in the ratio of the control and experimental bands was analyzed for statistical significance.
Measurement of F- and G-actin ratio
The G-actin/F-actin in vivo Assay Biochem Kit was used to evaluate the cochlear F/G-actin ratio. Cochleae from each group were rapidly removed and dissected in PBS (pH 7.4) containing complete™ mini EDTA-free protease inhibitor cocktail. Then, cochlear tissues from each mouse were homogenized in LAS2 buffer (supplied in the G-actin/F-actin in vivo assay kit) and divided equally based on the manufacturer’s protocol. All samples were ultra-centrifuged at 100,000 × g at 37 °C for 1 h. Separated G- and F-actin fractions were quantified after Western blotting with the anti-actin antibody supplied in the kit at a dilution of 1:500.
Statistical analysis
Data were analyzed using IBM SPSS Statistics Premium V21 and GraphPad software for Windows. The group size (n) in vivo was determined by the variability of measurements and the magnitude of the differences between groups. Based on our previous as well as current preliminary studies, we determined that six to eight animals per group provide sufficient statistical power. Statistical methods used included one-way analysis of variance (ANOVA), repeated-measures ANOVA, Tukey’s multiple comparisons, unpaired t-tests, and one-sample t-tests. All tests were two-tailed and a p-value < 0.05 was considered statistically significant.
Results
ROCK2 is the main ROCK isoform expressed in cochlear tissue of CBA/J mice
The conditions used here to study noise-induced temporary threshold shift (TTS) and permanent threshold shift (PTS) hearing loss have been previously described (Chen et al. 2012, Zheng et al. 2014). Exposure of 3-month-old male CBA/J mice to 2–20 kHz broadband noise (BBN) at 92 or 96 dB SPL for 2 h results in TTS, while exposure to either 98 or 106 dB SPL results in PTS. We first determined whether ROCK1 and ROCK2 are expressed in cochlear tissues of adult CBA/J mice without noise exposure by probing total cochlear homogenates with monoclonal ROCK1 and monoclonal ROCK2 antibodies. Western blots revealed a single band at 160 kDa with each antibody. ROCK2 was abundant in normal cochlear homogenates, while ROCK1 was only weakly detected or even absent in the cochlear tissue (Fig. 1A). Since both ROCK1 and ROCK2 are expressed in lung tissue, the homogenates of lung tissue from the mice were used as positive controls. Localization by immunohistochemistry on cryosections with a ROCK2 antibody showed that ROCK2 is present in the organ of Corti, stria vascularis, and spiral ganglion cells (SGCs) (data not shown). Surface preparations confirmed that it localizes to the stereocilia and the cuticular plate of OHCs (Fig. 1B).
Fig. 1.

ROCK2, but not ROCK1, is a strongly expressed isoform in cochlear tissues of adult CBA/J mice and decreases in cochlear homogenates after both PTS- and TTS-noise exposure, but only PTS noise decreases ROCK2 in OHCs. (A) Western blots show that ROCK1 is only weakly expressed or even absent from the cochlea, while ROCK2 is abundantly expressed in cochlear tissue. Lung tissue is used as a positive control. GAPDH is used as a loading control. n = 3. (B) Immunolabeling of ROCK2 (red) is observed in the stereocilia and cuticular plate of sensory hair cells. Representative images were taken from surface preparations of the basal turn. OHC 1, 2, 3 indicate three rows of outer hair cells; IHC: inner hair cells. Green: phalloidin-labeled OHCs. n = 3. Scale bar: 10 µm. (C) Western blots show significant reductions of ROCK2 levels in cochlear homogenates 1 h after PTS- and TTS-noise exposures. GAPDH is used as a loading control. Quantification of the band densities of ROCK2 verifies the significant decrease. Data are presented as means + SEM with normalization to controls. n = 6, *p < 0.05, **p < 0.01. (D) Representative images show weak ROCK2 (red) immunolabeling in OHCs 1 h after PTS- compared to TTS-noise exposure or controls without noise exposure. Images were taken from the basal turn. Green: phalloidin-labeled OHCs. n = 5. Scale bar: 10 µm. (D’) Quantification of the ROCK2 immunolabeling in OHCs confirms a significant reduction after PTS-noise exposure. Data are presented as means + SD with normalization to controls. n = 5, **p < 0.01.
Both TTS- and PTS-noise exposure decrease ROCK2 in cochlear homogenates, but only PTS decreases the ROCK2 specifically in OHCs
Since ROCK2 is the main isoform expressed in the cochlea, we focused our investigation on ROCK2 and assessed whether it is involved in hair cell damage after noise exposure. First, Western blots showed that the band densities were weaker 1 h after either TTS- or PTS-noise exposure (Fig. 1C). Quantitative analysis confirmed a significant decrease 1 h after PTS- (t5 = 5.1163, p = 0.0037; n = 6) and 1 h after TTS-noise exposure (t5 = 2.8305, p = 0.0037; n = 6).
To clarify whether the decrease in ROCK2 occurs specifically in the OHCs, immunohistochemistry of ROCK2 was assessed on surface preparations 1 h after the noise exposure. ROCK2-associated immunolabeling was weaker in OHCs 1 h after PTS-noise exposure, but not after TTS noise, compared to control mice without noise exposure (Fig. 1D). Quantitative analysis of ROCK2 in OHCs confirmed a statistically significant decrease 1 h after PTS-noise exposure (t4 = 6.7823, p = 0.0025; n = 5), but not after TTS-noise exposure (t4 = 1.0459, p = 0.36; n = 5). The ratio of the relative ROCK2 immunofluorescence in OHCs of control mice to those of mice 1 h after PTS noise was 1:0.60 (Fig. 1D’). These results indicate that ROCK2 may be involved in the OHC damage after noise exposure.
Pretreatment with siROCK2 aggravates TTS to PTS
Since TTS noise neither alters the expression of ROCK2 in OHCs nor induces OHC death, this condition was used to assess the function of ROCK2 in response to NIHL with siROCK2 pretreatment. First, one of two doses (0.3 µg or 0.6 µg) of siROCK2 was delivered intra-tympanically to mice to evaluate the efficiency of siROCK2 in OHCs. Preliminary results showed that 0.3 µg of siROCK2 is sufficient to decrease ROCK2 expression in OHCs on surface preparations compared to siControl-treated mice. We then focused on the 0.3-µg dose. Seventy-two hours after siROCK2 treatment, the immunolabeling of ROCK2 in OHCs decreased by about 30% compared to siControl treatment (t2 = 7.5086, p = 0.017; n = 3). Since the 96-dB SPL exposure resulted in more severe TTS, we used this paradigm to test whether decreased ROCK2 activity might aggravate TTS to PTS. First, pretreatment with siROCK2 followed by TTS-noise exposure resulted in weaker immunolabeling of ROCK2 than in siControl-treated mice (Fig. 2A). Quantitative analysis from original confocal images verified a significant reduction by about 40% after TTS noise (Fig. 2A’, t4 = 4.6259, p = 0.0098; n = 5). In agreement with our previous study, auditory thresholds returned to baseline levels in both siControl-plus-TTS-noise and TTS-noise-alone groups 3 d after exposure. In contrast, pretreatment with siROCK2 worsened threshold shifts at day 3 through day 7, which did not recover to baseline by 14 days, indicating exacerbation to PTS at 32 kHz (Fig. 2B, F2,19 = 5.750, p = 0.011), but not at 8 and 16 kHz (data not shown). There was an average of a 15-dB increase in auditory threshold shifts at day 3 (p = 0.01), day 7 (p = 0.018), and day 14 (p = 0.002) after the noise exposure. In addition, pretreatment with siROCK2 resulted in OHC losses in the basal region of the cochlear epithelium, while siControl-treated mice showed almost no OHC loss 14 days after TTS-noise exposure (Fig. 2C). Quantification of OHC loss along the entire length of the cochlear epithelium showed that pretreatment with siROCK2 resulted in OHC loss beginning in the middle region of the cochlea (3.5 mm from the apex) and increasing toward the basal portion (Fig. 2D, F1,9 = 155.461, p < 0.001). OHC loss was increased from near-zero levels in controls to 30% at 4 mm (p = 0.002), 60% at 4.5 mm (p < 0.001), 75% at 5 mm (p = 0.000), and 100% at 5.5 mm (p < 0.001) from the apex.
Fig. 2.

Silencing ROCK2 decreases ROCK2 expression after TTS noise exposure and aggravates TTS to PTS. (A) Immunolabeling of ROCK2 (red) is weak in OHCs (green) 1 h after TTS-noise exposure when pretreated with siROCK2 compared to the siControl-treated group. Representative images were taken from the basal turn. n = 5. Scale bar: 10 µm. (A’) Quantification of ROCK2 immunolabeling in OHCs confirms a significant reduction. Data are presented as means + SD with normalization to controls, n = 5, **p < 0.01. (B) Pretreatment with siROCK2 aggravates TTS to PTS at 32 kHz 14 d after TTS-noise exposure. n = 8. (C) Representative images were taken at 4 mm from the apex and revealed no OHC loss with siControl treatment after TTS noise, while OHC losses appeared in siROCK2-treated mice. OHC1, 2, and 3 indicate rows 1, 2, and 3 of outer hair cells. Scale bar: 10 µm. (D) Pretreatment with siROCK2 results in OHC loss 4–5.5 mm from the apex that follows a base-to-apex gradient by 14 d after TTS noise exposure, while no OHC losses appear in the siControl-treated group. n = 6. Data are presented as means ± SEM in (B) and (D), *p < 0.05, **p < 0.01, ***p < 0.001.
Pretreatment with siROCK2 inhibits p-ERM expression after TTS-noise exposure
ERM proteins are regulated by ROCK. In order to clarify the relationship between ROCK2 and p-ERM in OHCs, we first analyzed the expression of p-ERM under both TTS- and PTS-noise conditions by Western blot. Probing whole cochlear homogenates with an anti-p-ERM antibody revealed a single band at 80 kDa. The band densities of p-ERM decreased 1 h after either TTS or PTS noise (Fig. 3A). Quantification of the p-ERM band densities normalized to GAPDH showed about 40% reduction 1 h after both PTS (t4 = 3.6771, p = 0.021; n = 5) and TTS noise exposure (t4 = 5.0048, p = 0.0075; n = 5) (Fig. 3A’). Immunolabeling of p-ERM specifically in OHCs on surface preparations was weaker than controls only after PTS, not TTS noise (Fig. 3B). Quantification of immunolabeled p-ERM in OHCs confirmed an average of a 40% decrease 1 h after PTS noise (t4 = 14.4361, p = 0.0001; n = 5), while TTS-noise did not alter the levels of p-ERM in OHCs (t4 = 1.8983, p = 0.13; n = 5) (Fig. 3B’). Next, pretreatment with siROCK2 was applied 72 h before noise exposure to detect p-ERM levels. As described above, mice exposed to TTS noise do not show decreased p-ERM-immunolabeling in OHCs 1 h after TTS noise. Therefore, the TTS-noise condition was selected to examine if p-ERM is a downstream target of ROCK2. Pretreatment with siROCK2 reduced immunolabeled p-ERM in OHCs after TTS noise (Fig. 3C). Quantitative analysis of p-ERM-associated immunofluorescence in OHCs verified reduction by 40% (Fig. 3C’, t5 = 10.328, p = 0.0001; n = 6). These results indicate that phosphorylation of ERM is mediated by ROCK2 in OHCs under noise stress.
Fig. 3.

Both PTS- and TTS-noise exposure decrease the levels of p-ERM in cochlear homogenates, but only PTS noise decreases p-ERM in OHCs. Pretreatment with siROCK2 decreases the levels of p-ERM in OHCs after TTS-noise exposure. (A) Western blots show significant reductions of p-ERM levels in cochlear homogenates 1 h after PTS- and TTS-noise exposure. GAPDH is used as loading control. (A’) Quantification of the p-ERM band densities verifies the significant decrease. Data are presented as means + SEM with normalization to controls. n = 6, *p < 0.05, **p < 0.01. (B) Representative images show weak p-ERM (red) immunolabeling in OHCs (green) 1 h after PTS- compared to after TTS-noise exposure or to controls without noise. Images were taken from the basal turn. Green: phalloidin-labeled OHCs. n = 5. Scale bar: 10 µm. (B’) Quantification of the p-ERM immunolabeling in OHCs confirms a significant reduction. n = 5. (C) Representative images show decreased immunolabeling of p-ERM in OHCs when pretreated with siROCK2 (panel: TTS noise + siROCK2) compared to siControl treatment (panel: TTS noise + siControl). Images were taken from the basal turn. n = 6. Scale bar: 10 µm. (C’) Quantification of p-ERM immunolabeling in OHCs confirms a significant reduction. n = 5. Data are presented as means + SD with normalization to controls in (B’) and (C’), **p < 0.01, ***p < 0.001.
Pretreatment with siRadixin inhibits p-ERM expression and aggravates TTS to PTS
Radixin is one member of the ERM family. Since p-ERM is reduced after noise exposure and the reduction may be accounted for by reduced p-radixin levels, we first detected the expression of total radixin in whole cochlear tissue homogenates by Western blot. In contrast to the decrease in p-ERM proteins, neither TTS nor PTS noise altered the levels of total radixin in cochlear tissue homogenates (Fig. 4B). In addition, radixin immunolabeling was detected mainly along the length of the stereocilia of cochlear hair cells and was also observed in the cuticular plate of OHCs in normal animals (Fig. 4A), consistent with a previous report (Kitajiri et al. 2004). Preliminary results showed that pretreatment with 0.6 µg siRadixin suppressed the expression of radixin in OHCs. We therefore analyzed p-ERM expression in OHCs after pretreatment with siRadixin under TTS-noise conditions. The immunolabeling of p-ERM in OHCs was weaker following pretreatment with siRadixin 1 h after TTS noise compared to siControl mice exposed to TTS noise (Fig. 4C). The ratio of p-ERM expression in siControl-treated OHCs to siRadixin-treated OHCs was 1:0.68 (Fig. 4C’, t2 = 4.4709, p = 0.0476; n = 3). These results confirm that p-ERM is composed, at least in part, of p-radixin. Since radixin is involved in hearing loss (Kitajiri, Fukumoto et al. 2004), we observed if pretreatment with siRadixin aggravates TTS to PTS. First, pretreatment with siRadixin reduced the expression of radixin in OHCs after TTS noise (Fig. 5A). Quantitative analysis of radixin-associated immunofluorescence in OHCs confirmed an average of a 30% decrease (t2 = 6.2535, p = 0.025; n = 3; Fig. 5A’). Finally, pretreatment with siRadixin aggravated TTS at day 3 through day 7, which did not recover to baseline by 14 days, indicating exacerbation to PTS at 32 kHz (F1,8 = 10.406, p = 0.012) (Fig. 5B), but not at 8 and 16 kHz (data not shown). Auditory threshold shifts at 32 kHz increased by 30 dB at day 3 (p = 0.008) and by 25 dB at day 7 (p = 0.04) and day 14 (p = 0.03) after noise exposure.
Fig. 4.

Pretreatment with siRadixin suppresses expression of p-ERM in OHCs. (A) Surface preparations show that radixin (red) is expressed in the stereocilia and cuticular plate of the normal cochlea of CBA/J mice without noise exposure. Images were taken from the basal turn. n = 3. Scale bar: 10 µm. (B) Neither TTS- nor PTS-noise exposures have an effect on the levels of radixin in total cochlear homogenates by Western blot analysis 1 h after noise exposure. GAPDH is used as loading control. n = 4. (C) Pretreatment with siRadixin diminishes p-ERM immunolabeling in OHCs 1 h after TTS-noise exposure compared to siControl-treated mice. Representative images were taken from the basal turn. Green: phalloidin labeling of OHCs. n = 3. Scale bar: 10 μm. (C’) Quantification of relative p-ERM immunolabeling in OHCs confirms a significant reduction. Data are presented as means + SD with normalization to controls. n = 3, *p < 0.05.
Fig. 5.

Pretreatment with siRadixin aggravates auditory threshold shifts from TTS to PTS. (A) Pretreatment with siRadixin diminishes radixin immunolabeling in OHCs 1 h after TTS-noise exposure compared to siControl-treated mice. Representative images were taken from the basal turn. Green: phalloidin labeling of OHCs. n = 3. Scale bar: 10 μm. (A’) Quantification of radixin-immunolabeling in OHCs confirms a significant reduction. Data are presented as means + SD with normalization to controls. n = 3, *p < 0.05. (B) Pretreatment with siRadixin significantly increases sensitivity to TTS noise at 32 kHz and aggravates TTS to PTS 14 d after the noise exposure. Data are presented as means ± SEM. n = 6, *p < 0.05, **p < 0.01.
Noise-induced disruption of the actin cytoskeleton is regulated by RhoA pathways
Alexa-Fluor-488 phalloidin labeling of polymerized F-actin showed that it is expressed mainly in the organ of Corti, including IHCs and OHCs (particularly in the cuticular plate and the stereocilia), and the basal cells of the stria vascularis, not in SGCs (Fig. 6A). We further detected alterations of actin cytoskeletal organization under TTS- and PTS-noise conditions compared to control mice without noise exposure using a G-actin/F-actin assay kit. The F/G-actin ratio was reduced by an average of 40% 1 h after PTS-noise exposure (F2, 11 = 5.894, p = 0.018) and 8% after TTS noise (Fig. 6B). Further Tukey’s analysis revealed that the 40% change after PTS noise was significant, while the TTS-noise-induced changes were not, compared to control mice (p = 0.014). LPA is an extracellular agonist of RhoA pathways and stimulates ROCK activation (Dash et al. 2004). With reference to the literature (Fan et al. 2008), we used a 30-mg/kg dose based on the dose response in our mouse model. Addition of LPA returned the PTS-noise-reduced F/G-actin ratio to near-normal levels (Fig. 6C, t10 = 3.2506, p = 0.0087; n = 6). These results indicate that actin cytoskeletal reorganization is mediated by RhoA/ROCK2/ERM signals after noise exposure.
Fig. 6.

LPA treatment reverses the PTS-noise-diminished ratio of F/G-actin. (A) Polymerized F-actin (green) is mainly expressed in the organ of Corti including IHCs, OHCs, and basal cells of the stria vascularis. Red: Propidium-iodide-stained nuclei, OC: organ of Corti, SGC: spiral ganglion cells, Stria: stria vascularis. n = 3. Scale bar: 50 µm. (B) PTS-exposed cochleae have a significantly lower F/G-actin ratio than controls without noise-exposure; while the TTS-noise group does not differ from the control group. Control: n = 5, PTS: n = 5, TTS: n = 4. (C) LPA treatment significantly reverses the PTS-noise-diminished F/G-actin ratio. n = 6. Data are presented as means + SD in (B) and (C), *p < 0.05, **p < 0.01.
LPA treatment attenuates noise-induced hair cell loss and NIHL
We further examined if administration of LPA could attenuate noise-induced OHC loss and NIHL. LPA treatment significantly attenuated PTS-noise-induced auditory threshold shifts at all three measured frequencies (8, 16, and 32 kHz) 14 d after PTS noise exposure (Fig. 7A, 8 kHz: F2,27 = 6.211, p = 0.006; 16 kHz: F2,27 = 7.120, p = 0.003; and 32 kHz: F2,27 = 8.864, p = 0.001). Further analysis by Tukey’s multiple comparisons test showed that treatment with LPA reduced auditory threshold shifts by less than 10 dB at 8 kHz (p = 0.007) and by about 20 dB at 16 kHz (p = 0.001) and 32 kHz (p = 0.003) compared to treatment with the vehicle for LPA (PBS). In addition, LPA treatment also reduced PTS-noise-induced OHC loss as shown by DAB-staining of myosin-VII-labeled surface preparations (Fig. 7B). Counts of OHCs along the entire length of the cochlear epithelium showed that PTS noise resulted in loss of OHCs beginning at 3.5 mm and increasing towards the base with complete loss at 5.5 mm from the apex. With LPA treatment, PTS-noise-induced OHC loss was significantly reduced (Fig. 7C, F1,8 = 40.938, p < 0.001, n = 5). The reduction of OHC loss was by 40% at 4 mm (p < 0.001) and 30% at 4.5 mm (p < 0.001) from the apex. The trend analysis showed a significant difference in cubic components (p < 0.001).
Fig. 7.
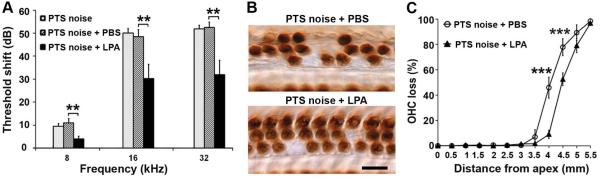
LPA treatment attenuates NIHL and hair cell loss. (A) Treatment with LPA significantly reduces PTS-noise-induced auditory threshold shifts at 8, 16, and 32 kHz 14 d after noise exposure. Data are presented as means + SEM. n = 10, **p < 0.01. (B) Representative images of DAB staining of myosin VII-labeled OHCs show loss of OHCs at 4 mm from the apex. n = 5. Scale bar: 10 µm. (C) LPA-treated mice have significantly reduced OHC loss after PTS-noise exposure compared to those without LPA treatment. n = 5. Data are presented as means ± SD. ***p < 0.001.
Discussion
A salient finding of this study is that ROCK2 is the predominant isoform of ROCK in the mouse inner ear. Both TTS- and PTS-noise exposure decreased the levels of ROCK2 and p-ERM in mouse cochlear tissue. However, only PTS noise resulted in a reduction of ROCK2 and p-ERM specifically in OHCs. Treatment with LPA, an agonist of the RhoA pathway, significantly reversed the PTS-noise-reduced F/G-actin ratio in the cochlea and attenuated noise-induced OHC loss and NIHL. Conversely, pretreatment with siROCK2 reduced the expression of ROCK2 and p-ERM in the OHCs and aggravated TTS to PTS. Additionally, pretreatment with siRNA against radixin, an ERM protein, also aggravated TTS to PTS. These results indicate that reorganization of the actin cytoskeleton in OHCs of CBA/J mice is orchestrated through a RhoA/ROCK2/p-ERM signaling cascade that modulates NIHL.
RhoA is a member of the Rho GTPase family and plays a key role in regulation of cytoskeletal organization, including in the formation of actin stress fibers and focal adhesions via its effectors (Amano et al. 1997). The Rho GTPases function as molecular switches and when bound to GTP are turned "on", propagating signal transduction, which enables interactions with downstream effector molecules (Burridge & Wennerberg 2004). The most common mechanism for effector activation by GTP-RhoA is the disruption of intramolecular auto-inhibition to expose the functional domain of the effector protein (Jaffe & Hall 2005). Many RhoA effectors have been reported, including ROCK proteins, a serine/threonine kinase termed protein kinase N (PKN), and mammalian diaphanous (mDia). Our previous work showed decreases in GTP-RhoA and mDia proteins in cochlear tissue of noise exposed mice (Chen et al. 2012). The current investigation continues our previous study on noise-activated small GTPases in the inner ear and focuses on the well-characterized RhoA effectors, the ROCKs. ROCK1 and ROCK2 play opposing roles in regulating stress fiber disassembly and cell detachment as ROCK1 is involved in destabilizing the actin cytoskeleton and in cell detachment, whereas ROCK2 is required for stabilizing the actin cytoskeleton and cell adhesion (Shi et al. 2013). Both ROCK isoforms, ROCK1 and ROCK2, were previously reported to be expressed in the OHCs of guinea pig cochleae (Zhang et al. 2003). In contrast, while ROCK2 is robustly expressed in the cochlea of the CBA/J mouse, ROCK1 is only weakly expressed or even absent, suggesting that the expression pattern of ROCK isoforms may depend on the animal species. In line with our previous observation of noise causing a decrease in GTP-RhoA (Chen et al. 2012), the levels of ROCK2 were diminished after exposure to either PTS or TTS noise in whole cochlear tissue as well as in OHCs after PTS-, but not after TTS-noise exposure. Such an expression pattern of ROCK2 in OHCs is in agreement with a TTS-noise model that induces only temporary hearing loss. However, the mechanisms by which noise exposure reduces ROCK2 protein levels are unknown. ROCK can serve as either a pro-apoptotic or anti-apoptotic regulator depending on cell type and microenvironment (Shi & Wei 2007, Street & Bryan 2011). We used an RNA-interference strategy to explore the role of ROCK2 in noise-induced OHC loss and NIHL. Pretreatment with siROCK2 aggravates TTS to PTS, suggesting that ROCK2 acts as an anti-apoptotic molecule in NIHL, as noise induces multiple types of hair cell death including apoptosis and necrosis (Zheng et al., 2014).
The decrease of p-ERM after noise-exposure is consistent with the reduction of ROCK2 levels. ERM proteins are not only involved in alteration of cellular architecture but also play a role in cell signaling pathways (Louvet-Vallee 2000). Noise-diminished levels of p-ERM protein in cochlear tissue demonstrate that p-ERM proteins, important controllers of the cytoskeleton, are also involved in regulation of auditory function. Since the amino acid sequences surrounding T564 of radixin, T567 of ezrin, and T558 of moesin are nearly completely conserved among ERM proteins, the monoclonal antibody against p-ERM binds all three loci. However, pretreatment with siRadixin reduces total radixin levels and p-ERM expression in OHCs and aggravates TTS to PTS, indicating that radixin might be the major player in the cochlea and might contribute to NIHL. This is in agreement with the fact that a mutation in the human homolog of the radixin gene, coding for an ERM protein, results in non-syndromic hearing loss at the DFNB24 locus (Khan et al. 2007, Kitajiri et al. 2004). Although Western blotting is more sensitive, the difference in the magnitude of decrease in the levels of ROCK2 and p-ERM by Western blot and by immunolabeling analysis under TTS-noise conditions may not be due to sensitivity differences, as Western blotting is conducted with whole cochlear homogenates. The changes might instead reflect other inner ear tissues aside from OHCs, since ROCK2 and p-ERM are also expressed in the stria vascularis and spiral ganglion cells.
In agreement with previous reports, F-actin is mainly expressed in the organ of Corti (Hu & Henderson 1997, Kitsunai et al. 2007). The PTS-noise-diminished F/G-actin ratio is reversed, at least to some extent, by LPA treatment. Furthermore, treatment with LPA attenuates noise-induced OHC loss and NIHL suggesting that LPA regulates the effect of Rho GTPases on hearing capacity (Matsumoto et al. 2010). LPA as an extracellular signaling molecule activates RhoA through activation of G-protein-coupled receptors (GPCRs), which in coupling with the Gα12/13 family of G proteins stimulate Rho guanine nucleotide exchange factors (RhoGEFs) for RhoA. GEFs displace the Mg2+ and release the bound GDP in exchange for GTP (Rossman et al. 2005). Evidence shows that Gα12/13 family proteins directly interact with and thereby activate several RhoGEFs (Siehler 2009). However, we need to consider that LPA is also involved in physiological and pathological processes through six G-protein-coupled receptors (GPCRs) (Tomsig et al. 2009), which exert diverse cellular effects, including cell survival and apoptosis (Ye et al. 2002). The expression profiles of LPA receptors among different cell types and animal species vary in terms of type and quantity (Weiner et al. 2001); it is not known which LPA receptors are activated under noise conditions. Although treatment with LPA modulates actin cytoskeletal organization in the inner ear and attenuates NIHL to some extent, it is still too early to conclude that LPA can be used as a protective agent against NIHL. This requires further investigation to identify the specific LPA receptors in OHCs and determine which one mediates the process of noise-induced OHC damage. In addition, RhoA activation by LPA also activates phospholipases, lipid regulated enzymes, and neuro-inflammation (Xiang et al. 2013).
In conclusion, the present study strongly supports our hypothesis that noise trauma decreases activated GTP-RhoA and, consequently, decreases ROCK2 and p-ERM proteins in the cochlea. Phosphorylated ERM proteins may serve as cross-linkers between actin filaments and the plasma membrane to maintain actin structure and function in OHCs. F-actin depolymerization may contribute to NIHL and hair cell death.
Acknowledgments
The research project described was supported by grant R01 DC009222 from the National Institute on Deafness and Other Communication Disorders, National Institutes of Health. Yu Han’s fellowship was partially supported by grant 81120108008 from the National Science Foundation of China. This work was conducted in the MUSC WR Building in renovated space supported by grant C06 RR014516. Animals were housed in MUSC CRI animal facilities supported by grant C06 RR015455 from the Extramural Research Facilities Program of the National Center for Research Resources. We thank Dr. Jochen Schacht for his valuable comments on the manuscript.
Abbreviations used
- BBN
broadband noise
- DAB
diaminobenzidine
- DMSO
dimethyl sulfoxide
- IHCs
inner hair cells
- IP
intra-peritoneal
- LPA
lysophosphatidic acid
- NIHL
noise-induced hearing loss
- OHCs
outer hair cells
- PBS
phosphate-buffered saline
- PTS
permanent threshold shift
- siControl
scrambled siRNA
- siROCK2
ROCK2 siRNA
- siRadixin
radixin siRNA
- TTS
temporary threshold shift
- ERM
ezrin-radixin-moesin
Footnotes
Author Disclosure Statement
There are no conflicts of interest for any of the authors.
The data contained in the manuscript have not been previously published, have not been submitted elsewhere, and will not be submitted elsewhere while under review.
All research protocols were approved by the Institutional Animal Care & Use Committee at the Medical University of South Carolina (MUSC). Animal care was under the supervision of the Division of Laboratory Animal Resources at MUSC.
All authors have reviewed the contents of the manuscript, approve of its contents, and validate the accuracy of the data.
References
- Amano M, Chihara K, Kimura K, Fukata Y, Nakamura N, Matsuura Y, Kaibuchi K. Formation of actin stress fibers and focal adhesions enhanced by Rho-kinase. Science. 1997;275:1308–1311. doi: 10.1126/science.275.5304.1308. [DOI] [PubMed] [Google Scholar]
- Amano M, Fukata Y, Kaibuchi K. Regulation and functions of Rho-associated kinase. Exp. Cell Res. 2000;261:44–51. doi: 10.1006/excr.2000.5046. [DOI] [PubMed] [Google Scholar]
- Asumendi A, Andollo N, Boyano MD, Hilario E, Perez-Yarza G, Atencia R, Arechaga J, Garcia-Sanz M. The role of cleavage of cell structures during apoptosis. Cell Mol. Biol. (Noisy-le-grand) 2000;46:1–11. [PubMed] [Google Scholar]
- Atencia R, Asumendi A, Garcia-Sanz M. Role of cytoskeleton in apoptosis. Vitam. Horm. 2000;58:267–297. doi: 10.1016/s0083-6729(00)58028-5. [DOI] [PubMed] [Google Scholar]
- Burridge K, Wennerberg K. Rho and Rac take center stage. Cell. 2004;116:167–179. doi: 10.1016/s0092-8674(04)00003-0. [DOI] [PubMed] [Google Scholar]
- Chen FQ, Zheng HW, Hill K, Sha SH. Traumatic Noise Activates Rho-Family GTPases through Transient Cellular Energy Depletion. J. Neurosci. 2012;32:12421–12430. doi: 10.1523/JNEUROSCI.6381-11.2012. [DOI] [PMC free article] [PubMed] [Google Scholar]
- Chen FQ, Zheng HW, Schacht J, Sha SH. Mitochondrial peroxiredoxin 3 regulates sensory cell survival in the cochlea. PLoS One. 2013;8:e61999. doi: 10.1371/journal.pone.0061999. [DOI] [PMC free article] [PubMed] [Google Scholar]
- Dash PK, Orsi SA, Moody M, Moore AN. A role for hippocampal Rho-ROCK pathway in long-term spatial memory. Biochem. Bioph. Res. Co. 2004;322:893–898. doi: 10.1016/j.bbrc.2004.08.004. [DOI] [PubMed] [Google Scholar]
- Fan H, Zingarelli B, Harris V, Tempel GE, Halushka PV, Cook JA. Lysophosphatidic acid inhibits bacterial endotoxin-induced pro-inflammatory response: potential anti-inflammatory signaling pathways. Mol. Med. 2008;14:422–428. doi: 10.2119/2007-00106.Fan. [DOI] [PMC free article] [PubMed] [Google Scholar]
- Hu BH, Henderson D. Changes in F-actin labeling in the outer hair cell and the Deiters cell in the chinchilla cochlea following noise exposure. Hear. Res. 1997;110:209–218. doi: 10.1016/s0378-5955(97)00075-0. [DOI] [PubMed] [Google Scholar]
- Hu BH, Henderson D, Nicotera TM. F-actin cleavage in apoptotic outer hair cells in chinchilla cochleas exposed to intense noise. Hear. Res. 2002;172:1–9. doi: 10.1016/s0378-5955(01)00361-6. [DOI] [PubMed] [Google Scholar]
- Jaffe AB, Hall A. Rho GTPases: biochemistry and biology. Annu. Rev. Cell Dev. Bi. 2005;21:247–269. doi: 10.1146/annurev.cellbio.21.020604.150721. [DOI] [PubMed] [Google Scholar]
- Khan SY, Ahmed ZM, Shabbir MI, et al. Mutations of the RDX gene cause nonsyndromic hearing loss at the DFNB24 locus. Hum. Mutat. 2007;28:417–423. doi: 10.1002/humu.20469. [DOI] [PubMed] [Google Scholar]
- Kitajiri S, Fukumoto K, Hata M, Sasaki H, Katsuno T, Nakagawa T, Ito J, Tsukita S. Radixin deficiency causes deafness associated with progressive degeneration of cochlear stereocilia. J. Cell Biol. 2004;166:559–570. doi: 10.1083/jcb.200402007. [DOI] [PMC free article] [PubMed] [Google Scholar]
- Kitsunai Y, Yoshida N, Murakoshi M, Iida K, Kumano S, Kobayashi T, Wada H. Effects of heat stress on filamentous actin and prestin of outer hair cells in mice. Brain Res. 2007;1177:47–58. doi: 10.1016/j.brainres.2007.08.019. [DOI] [PubMed] [Google Scholar]
- Kruth KA, Rubenstein PA. Two deafness-causing (DFNA20/26) actin mutations affect Arp2/3-dependent actin regulation. J. Biol Chem. 2012;287:27217–27226. doi: 10.1074/jbc.M112.377283. [DOI] [PMC free article] [PubMed] [Google Scholar]
- Leung T, Chen XQ, Manser E, Lim L. The p160 RhoA-binding kinase ROK alpha is a member of a kinase family and is involved in the reorganization of the cytoskeleton. Mol. Cell Biol. 1996;16:5313–5327. doi: 10.1128/mcb.16.10.5313. [DOI] [PMC free article] [PubMed] [Google Scholar]
- Louvet-Vallee S. ERM proteins: from cellular architecture to cell signaling. Biol. Cell. 2000;92:305–316. doi: 10.1016/s0248-4900(00)01078-9. [DOI] [PubMed] [Google Scholar]
- Matsumoto N, Kitani R, Maricle A, Mueller M, Kalinec F. Pivotal role of actin depolymerization in the regulation of cochlear outer hair cell motility. Biophys. J. 2010;99:2067–2076. doi: 10.1016/j.bpj.2010.08.015. [DOI] [PMC free article] [PubMed] [Google Scholar]
- Moolenaar WH, van Meeteren LA, Giepmans BN. The ins and outs of lysophosphatidic acid signaling. Bioessays. 2004;26:870–881. doi: 10.1002/bies.20081. [DOI] [PubMed] [Google Scholar]
- Oishi N, Chen FQ, Zheng HW, Sha SH. Intra-tympanic delivery of short interfering RNA into the adult mouse cochlea. Hear. Res. 2013;296:36–41. doi: 10.1016/j.heares.2012.10.011. [DOI] [PMC free article] [PubMed] [Google Scholar]
- Raphael Y, Altschuler RA. Early microfilament reorganization in injured auditory epithelia. Exp. Neurol. 1992;115:32–36. doi: 10.1016/0014-4886(92)90217-e. [DOI] [PubMed] [Google Scholar]
- Rossman KL, Der CJ, Sondek J. GEF means go: turning on RHO GTPases with guanine nucleotide-exchange factors. Nat. Rev. Mol. Cell Bio. 2005;6:167–180. doi: 10.1038/nrm1587. [DOI] [PubMed] [Google Scholar]
- Shi J, Surma M, Zhang L, Wei L. Dissecting the roles of ROCK isoforms in stress-induced cell detachment. Cell Cycle. 2013;12:1492–1500. doi: 10.4161/cc.24699. [DOI] [PMC free article] [PubMed] [Google Scholar]
- Shi J, Wei L. Rho kinase in the regulation of cell death and survival. Arch Immunol Ther. Exp. (Warsz) 2007;55:61–75. doi: 10.1007/s00005-007-0009-7. [DOI] [PMC free article] [PubMed] [Google Scholar]
- Shimizu Y, Thumkeo D, Keel J, et al. ROCK-I regulates closure of the eyelids and ventral body wall by inducing assembly of actomyosin bundles. J. Cell Biol. 2005;168:941–953. doi: 10.1083/jcb.200411179. [DOI] [PMC free article] [PubMed] [Google Scholar]
- Siehler S. Regulation of RhoGEF proteins by G12/13-coupled receptors. Brit. J. Pharmacol. 2009;158:41–49. doi: 10.1111/j.1476-5381.2009.00121.x. [DOI] [PMC free article] [PubMed] [Google Scholar]
- Street CA, Bryan BA. Rho kinase proteins--pleiotropic modulators of cell survival and apoptosis. Anticancer Res. 2011;31:3645–3657. [PMC free article] [PubMed] [Google Scholar]
- Szarama KB, Gavara N, Petralia RS, Kelley MW, Chadwick RS. Cytoskeletal changes in actin and microtubules underlie the developing surface mechanical properties of sensory and supporting cells in the mouse cochlea. Development. 2012;139:2187–2197. doi: 10.1242/dev.073734. [DOI] [PMC free article] [PubMed] [Google Scholar]
- Thumkeo D, Keel J, Ishizaki T, Hirose M, Nonomura K, Oshima H, Oshima M, Taketo MM, Narumiya S. Targeted disruption of the mouse rho-associated kinase 2 gene results in intrauterine growth retardation and fetal death. Mol. Cellular Biol. 2003;23:5043–5055. doi: 10.1128/MCB.23.14.5043-5055.2003. [DOI] [PMC free article] [PubMed] [Google Scholar]
- Tomsig JL, Snyder AH, Berdyshev EV, Skobeleva A, Mataya C, Natarajan V, Brindley DN, Lynch KR. Lipid phosphate phosphohydrolase type 1 (LPP1) degrades extracellular lysophosphatidic acid in vivo. Biochem. J. 2009;419:611–618. doi: 10.1042/BJ20081888. [DOI] [PMC free article] [PubMed] [Google Scholar]
- Valderrama F, Thevapala S, Ridley AJ. Radixin regulates cell migration and cell-cell adhesion through Rac1. J. Cell Sci. 2012;125:3310–3319. doi: 10.1242/jcs.094383. [DOI] [PubMed] [Google Scholar]
- Weiner JA, Fukushima N, Contos JJ, Scherer SS, Chun J. Regulation of Schwann cell morphology and adhesion by receptor-mediated lysophosphatidic acid signaling. J. Neurosci. 2001;21:7069–7078. doi: 10.1523/JNEUROSCI.21-18-07069.2001. [DOI] [PMC free article] [PubMed] [Google Scholar]
- Welch MD, Mallavarapu A, Rosenblatt J, Mitchison TJ. Actin dynamics in vivo. Curr. Opin. Cell Biol. 1997;9:54–61. doi: 10.1016/s0955-0674(97)80152-4. [DOI] [PubMed] [Google Scholar]
- Xiang SY, Dusaban SS, Brown JH. Lysophospholipid receptor activation of RhoA and lipid signaling pathways. Biochimica et biophysica acta. 2013;1831:213–222. doi: 10.1016/j.bbalip.2012.09.004. [DOI] [PMC free article] [PubMed] [Google Scholar]
- Ye X, Ishii I, Kingsbury MA, Chun J. Lysophosphatidic acid as a novel cell survival/apoptotic factor. Biochim. Biophys. Acta. 2002;1585:108–113. doi: 10.1016/s1388-1981(02)00330-x. [DOI] [PubMed] [Google Scholar]
- Zhang M, Kalinec GM, Urrutia R, Billadeau DD, Kalinec F. ROCK-dependent and ROCK-independent control of cochlear outer hair cell electromotility. J. Biol. Chem. 2003;278:35644–35650. doi: 10.1074/jbc.M301668200. [DOI] [PubMed] [Google Scholar]
- Zhao H, Williams DE, Shin JB, Brugger B, Gillespie PG. Large membrane domains in hair bundles specify spatially constricted radixin activation. J. Neurosci. 2012;32:4600–4609. doi: 10.1523/JNEUROSCI.6184-11.2012. [DOI] [PMC free article] [PubMed] [Google Scholar]
- Zheng HW, Chen J, Sha SH. Receptor-interacting protein kinases modulate noise-induced sensory hair cell death. Cell Death Dis. 2014;5:e1262. doi: 10.1038/cddis.2014.177. [DOI] [PMC free article] [PubMed] [Google Scholar]