

Abstract
The disease burden from diabetic kidney disease is large and growing. Effective therapies are lacking, despite an urgent need. Hyperbaric oxygen therapy (HBOT) activates Nrf2 and cellular antioxidant defenses; therefore, it may be generally useful for treating conditions that feature chronic oxidative tissue damage. Herein, we determined how periodic exposure to oxygen at elevated pressure affected type 2 diabetes mellitus-related changes in the kidneys of db/db mice. Two groups of db/db mice, designated 2.4 ATA and 1.5 ATA, were treated four times per week with 100 % oxygen at either 1.5 or 2.4 ATA (atmospheres absolute) followed by tests to assess kidney damage and function. The sham group of db/db mice and the Hets group of db/+ mice were handled but did not receive HBOT. Several markers of kidney damage were reduced significantly in the HBOT groups including urinary biomarkers neutrophil gelatinase-associated lipocalin (NGAL) and cystatin C (CyC) along with significantly lower levels of caspase-3 activity in kidney tissue extracts. Other stress biomarkers also showed trends to improvement in the HBOT groups, including urinary albumin levels. Expressions of the stress response genes NRF2, HMOX1, MT1, and HSPA1A were reduced in the HBOT groups at the end of the experiment, consistent with reduced kidney damage in treated mice. Urinary albumin/creatinine ratio (ACR), a measure of albuminuria, was significantly reduced in the db/db mice receiving HBOT. All of the db/db mouse groups had qualitatively similar changes in renal histopathology. Glycogenated nuclei, not previously reported in db/db mice, were observed in these three experimental groups but not in the control group of nondiabetic mice. Overall, our findings are consistent with therapeutic HBOT alleviating stress and damage in the diabetic kidney through cytoprotective responses. These findings support an emerging paradigm in which tissue oxygenation and cellular defenses effectively limit damage from chronic oxidative stress more effectively than chemical antioxidants.
Electronic supplementary material
The online version of this article (doi:10.1007/s12192-015-0574-3) contains supplementary material, which is available to authorized users.
Keywords: Hyperbaric oxygen, Kidney, Diabetes, db/db mice, Kidney biomarkers, Antioxidant gene expression
Introduction
During hyperbaric oxygen therapy (HBOT), patients inspire pure oxygen at pressures greater than one atmosphere (Londahl 2012). Under these conditions, tissue levels of oxygen are normalized in hypoxic tissues, and a number of oxygen-dependent reactions and signaling pathways are accentuated (Al-Waili and Butler 2006; Babchin et al. 2011). At present, HBOT is approved for the treatment of carbon monoxide poisoning, air/gas emboli, and selected chronic wounds (Gill and Bell 2004). In diabetic patients, HBOT promotes the healing of chronic foot ulcers (Abidia et al. 2003; Kessler et al. 2003; Duzgun et al. 2008), decreasing limb amputation rates (Faglia et al. 1996; Thackham et al. 2008; Bishop and Mudge 2012), and improving quality of life for these individuals (Londahl et al. 2011).
HBOT can attenuate inflammatory responses by altering cytokine production and signaling (Alex et al. 2005; Daniel et al. 2011; Lin et al. 2012). The anti-inflammatory action of HBOT may arise in part from its ability to increase the expression of antioxidant genes and other cellular defense genes through the induction of a noncytotoxic oxidative stimulus (Matsunami et al. 2009, 2011; Simsek et al. 2011; Godman et al. 2010a, b; He et al. 2011). Expression of these genes can provide insights into the metabolic state of the tissue under different physiological conditions (Hooper and Hooper 2009; Hooper et al. 2014). Evidence that HBOT can condition tissues to promote function and survival comes from the study of rat models of myocardial infarction (Han et al. 2008; Sun et al. 2011) and cerebral ischemia reperfusion injury (Li et al. 2008, 2009; Cheng et al. 2011), as well as a mouse model of repeated UV-A skin exposure (Fuller et al. 2013). Whether or not HBOT can be used therapeutically in selected patient populations to alleviate tissue damage arising from chronic inflammation and oxidative stress remains to be determined.
Endothelial cells are important targets for the beneficial actions of HBOT. These cells are highly responsive to high-pressure oxygen which readily activates the expression of a number of Nrf2-regulated antioxidant genes and molecular chaperones following treatment (Godman et al. 2010a, b). These changes in gene expression correlate with significant protection against cell death in tissues exposed to oxidant stress and acute ischemia-reperfusion. Activation by HBOT of the expression of antioxidant genes occurs in other cell and tissue types as well (Shiraishi et al. 1983; Padgaonkar et al. 1997; Dennog et al. 1999; Rothfuss et al. 2001). Endothelial dysfunction has been implicated as a central feature of kidney failure associated with diabetes mellitus, both types 1 and 2. The hyperglycemic state results in glomerular hypertension, glomerular and interstitial tissue fibrosis, and ultimately renal failure. The ability of HBOT to protect endothelial cells from oxidative damage suggested to us that this treatment could suppress renal injury caused by type 2 diabetes mellitus.
The metabolic abnormalities caused by systemic hyperglycemia include increased mitochondrial superoxide production by endothelial cells (Lowell and Shulman 2005). This increased superoxide production and the subsequent formation of other reactive oxygen species (ROS) appear to underlie the establishment of a chronic pro-inflammatory state that eventually results in renal failure (Forbes et al. 2008; Schieber and Chandel 2014). Although there is considerable experimental support for an underlying role of ROS in diabetic kidney dysfunction, chemical antioxidants provide little if any protection to renal tissue (Jun et al. 2012). For this reason, we decided to test a fundamentally different approach to protecting the kidney from hyperglycemic stress in which periodic exposure to HBOT was employed to stimulate endogenous antioxidant defenses, attenuating acute and chronic inflammation. Here, we provide evidence that this approach can ameliorate the appearance of biomarkers of both acute and chronic kidney damage, thus raising the possibility that HBOT may be useful for slowing the progression of kidney disease in diabetic patients. We employed the db/db mouse for these studies, one of the most widely used models of type 2 diabetes mellitus (Sharma et al. 2003; Tesch and Lim 2011). Although this model has shortcomings (Breyer et al. 2005; Brosius et al. 2009; Breyer 2012), these mice do recapitulate early renal consequences of systemic hyperglycemia, such as the development of glomerular hyperfiltration (elevated glomerular filtration rate (GFR) above the normal filtration rates), increased albuminuria and some histopathologic changes. Metabolomic comparisons of urinary metabolites show similarities between this mouse model and type 2 diabetic humans (Salek et al. 2007). Similar to many cases of human type 2 diabetes mellitus, obesity drives this disease in db/db mice. Obesity may contribute to metabolic dysregulation and kidney damage through the excess production of reactive oxygen and nitrogen intermediates, produced initially in adipose tissue, which can drive vicious cycles of systemic inflammation (Nathan 2008). For these reasons, we selected the db/db mouse model to test our hypothesis that periodic exposure to HBOT stimulates cytoprotective responses that are cellular and tissue defenses. Our data from early time points represent the changes in acute biomarkers, whereas the 20-week tests are biomarkers of chronic disease. In this regard, we consider our HBOT to be a therapeutic regimen.
Materials and methods
Animal model and experimental protocols
The db/db mouse model (BKS.Cg-Doc 7m +/+ Leprdb/J; Jackson Labs, http://jaxmice.jax.org/strain/000642.html) is an extensively studied model for type 2 diabetes mellitus. Homozygous mice are polyphagic, obese, and present with elevated and uncontrolled blood sugar levels. These mice develop severe hyperglycemia by weeks 5–6 and albuminuria by weeks 10–12.
Thirty db/db male mice and five heterozygous nondiabetic male mice (db/+ Hets) at 4–5 weeks of age were obtained from the Jackson laboratory (Bar Harbor, ME, USA) and acclimated for 1 week prior to the initiation of experiments. Mice were housed five per cage in a temperature- and humidity-controlled environment with a 12-h dark/light cycle and provided ad libitum access to chow (2918 Teklad Global irradiated 18 % Protein Rodent Diet; Harlan Laboratories) and water. The mice were treated in accordance with protocols approved by the institutional animal care and use committee at the University of Connecticut. Mice were distributed randomly into four treatment groups: 2.4 ATA (10 db/db mice, 100 % O2, 2.4 ATA HBOT, 1 h, 4 days per week), 1.5 ATA (10 db/db mice, 100 % O2, 1.5 ATA HBOT, 1 h, 4 days per week), sham (10 db/db mice were handled, no HBOT), and Hets (5 db/+ mice were handled, no HBOT). HBOT was administered using an OxyCure 3000 hyperbaric incubator (OxyHeal Health Group, National City, CA, USA). During the HBOT regimen, blood samples were obtained from the mice by a submandibular vein bleed at weeks 1, 8, 14, and 20 of the HBOT (see Fig. 1). Blood was collected in additive-free BD Microtainer tubes (Becton, Dickinson and Company, Franklin Lakes, NJ, USA), allowed to clot at room temperature and centrifuged to separate the serum. Serum was transferred into fresh tubes and stored at −80 °C. Blood glucose levels were measured in whole blood using the ReliOn Confirm blood glucose monitoring system (Walmart, Bentonville, AR, USA). The upper limit of measurement by this meter is 600 mg/dl.
Fig. 1.

a Overview of the experimental protocol indicating the frequency and pressure of HBOT treatment. Also shown are the time points for blood (solid arrows) and urine (broken arrows) collection. b Average weekly weights over the duration of the 20-week HBOT regimen for the Hets, Sham, and 2.4 ATA groups. All groups are shown in Fig. S1. Weeks indicate animal age; for example week 5 is equivalent to week 1 of HBOT
Timed (22 h) urine samples were also obtained from the mice at weeks 4, 10, 15, and 20 of the HBOT (see Fig. 1) by housing them in metabolic cages (Braintree Scientific Inc, MA). Urine samples were clarified by centrifugation, and aliquots were stored at −80 °C. Most urine samples were obtained undiluted; however, some cages had to be rinsed with water, in which case the resulting urine dilutions were noted and corrected in the urinalysis.
Upon completion of the HBOT regimen, the mice were euthanized by CO2 asphyxiation, and both kidneys were harvested. One kidney was snap frozen in liquid nitrogen and stored at −80 °C. The other kidney was fixed with 4 % (w/v) paraformaldehyde in phosphate-buffered saline for 4 h at room temperature (RT), rinsed four times with 70 % ethanol, and stored at RT in 70 % ethanol.
Histological analysis
Blocks of fixed kidney were postfixed for 2–3 h in CBA formalin (Anatech Ltd, MI) and processed to paraffin. Sections were cut at 4–5 μm, stained with periodic acid-Schiff reagent (PAS), and counterstained with hematoxylin. The sections were examined using light microscopy by a certified veterinary pathologist (JAS) blinded to the treatment groups.
Urinary biomarker analysis
Urinary neutrophil gelatinase-associated lipocalin (NGAL), clusterin, and cystatin-C assays were performed on 22-h urine collections and reported as a ratio of biomarker to urine creatinine concentration using a microbead-based assay as described previously in Dr. Sabbisetti’s laboratory at Brigham & Women’s Hospital (Grgic et al. 2012). Urine samples were incubated with microbeads coupled with NGAL, clusterin, cystatin-C antibodies, and recombinant standard proteins (R&D systems) for 1 h, washed three times with PBST (10 mM Na2HPO4, 137 mM NaCl, 1.8 mM KH2PO4, 2.7 mM KCl, 0.05 % Tween 20, pH 7.4), and incubated with detection antibody (R&D Systems), and the amount of analytes in the urine was determined using Bio-Plex 200.
Urinary NAG was measured by a modified 96-well plate assay (Sabbisetti et al. 2013) using an N-acetyl-β-d-glucosamindase kit (Roche Diagnostics). Briefly, 100 μl of activated substrate (Reagent A) was incubated with 5 μl of urine or serially diluted standards (26.4 to 0.21 U/ml) for 45 min at 37 °C, and the reaction was stopped with 200 μl of stop solution (Reagent B). The absorbance was measured at 580 nm using a spectrophotometer (Molecular Diagnostics), and the amount of NAG was calculated based on the standard curve.
Creatinine measurements
Urinary creatinine was measured by the enzymatic assay using the Creatinine Liquid Reagent Assay (Diazyme Laboratories, Poway, CA). The assay was modified to a 96-well plate format. Briefly, 10 μl of urine samples were aliquoted into 96-well plate, followed by the addition of 240-μl reagent R1, and the reagent was mixed and plate was held at 37 °C for 5 min. The initial absorbance was read at 550 nm in a Synergy HT automated plate reader (BioTek). This was followed by the addition of 80 μl of reagent 2 and an additional incubation for 5 min at 37 °C followed by a final absorbance reading at 550 nm. The creatinine concentrations in the urine samples were estimated from a standard curve generated with dilutions of the creatinine calibrator supplied by the manufacturer. Serum creatinine was measured by HPLC at the Analytical Core of the Mouse Metabolic Phenotypic Center at Yale University.
Urinary albumin measurement
The total urinary albumin was quantified using the Mouse Albumin ELISA kit purchased from Bethyl Laboratories (Montgomery, TX). The kit components were reconstituted, and the assay was performed according to manufacturer’s protocol. Briefly, a 96-well plate was coated with 100-μl goat antimouse albumin antibody diluted 1:100 in carbonate-bicarbonate buffer for 1 h at RT. After incubation, the antibody solution was removed and the plate was washed four times with wash buffer. Each well was filled with 200-μl blocking buffer and incubated overnight at 4 °C. The next day, the plate was washed and 100 μl of diluted standards (as per the manufacturer’s protocol) and urine samples (1: 2000) were added to the wells, and the plate was incubated for 1 h at RT. The plate was washed and 100-μl diluted HRP-conjugated secondary antibody (1:70,000) was added to each well and incubated for 1 h at RT. The plate was washed and 100 μl of TMB substrate was added to each well and incubated in the dark for 20 min. The reaction was stopped by addition of 100 μl 2 N H2SO4 to each well, and the plate was read at 450 nm in a Synergy HT automated plate reader (BioTek). The albumin concentrations in the urine samples were estimated from a 4PL curve fit of the standard dilutions. The urinary albumin/creatinine ratios (ACR) were calculated using the 22-h total urine collection data.
Caspase-3 activity
Capase-3 activity in the kidney was determined by homogenizing an ~3-mm frozen kidney section in 150 μl of lysis buffer containing 10 mM TRIS-HCl (pH 7.5), 0.1 M NaCl, 1 mM EDTA and 0.01 % Triton X-100. The homogenate was lysed by two rounds of freeze-thaw and centrifuged at 10,000 × g for 5 min. The assays were performed in 96-well plates by mixing 50 μl of tissue lysis supernatant with 50 μl of 2× reaction mix (10 mM PIPES pH 7.4, 2 mM EDTA, 0.1 % CHAPS, 10 mM DTT) containing 200 nM of the fluorogenic substrate Acetyl-Asp-Glu-Val-Asp-7-Amino-4-methylcoumarin (DEVD-AMC; Enzo Life Sciences). The fluorescence was quantified using a microplate reader (excitation/emission 360/460 nm) at the start of the reaction and after 30 min. Protein concentrations were determined using a CBQCA Protein Quantification Kit (Life Technologies). Caspase activity was determined by dividing the change in fluorescence after 30 min by the total protein content of the reaction mixture.
RNA isolation
Total RNA was isolated by homogenizing an ~2-mm frozen kidney section in 1 ml of TRIzol reagent and purified using the PureLink® RNA Mini kit (Life Technologies, Carlsbad, CA) according to the manufacturer’s protocol. The RNA was eluted in 40 μl of RNase-Free water, and yield was determined using the Nanodrop™ 2000 spectrophotometer (Thermo Scientific).
Quantitative real-time PCR expression analysis
For gene expression analyses, 2 μg of total RNA was reverse transcribed in a 20-μl reaction using the High-Capacity cDNA Reverse Transcription kit (Applied Biosystems, Foster City, CA). Two microliters of the cDNA was used as template in a 20-μl pre-amplification reaction (1× PCR buffer mix, 0.2 mM dNTP mix, 2 U Takara rTaq [Clonetech laboratories, Mountain View, CA] and 0.05× pooled TaqMan gene expression assays. The cycling conditions were hold at 95 °C for 3 min followed by eight pre-amplification cycles: 95 °C for 15 s, 60 °C for 2 min, 72 °C for 2 min, and final hold at 4 °C. The pre-amplification reaction was diluted 20-fold, and 2 μl was used for real-time PCR using the ABI 7500 Fast Real-time PCR system. Reactions were run for 40 cycles with the TaqMan 2× Universal PCR Master mix in 10-μl volumes. The TaqMan gene expression assays purchased from Applied Biosystems were Mm1159846_s1 for Hspa1a, Mm00496660_g1 for Mt1, Mm00516005_m1 for Hmox1, Mm00477784_m1 for Nrf2 (Nfe212), and Mm01205647_g1 for beta-actin. Gene expression changes were calculated relative to the Hets (nondiabetic; db/+, no-HBOT) control animals using the ΔΔCt method with beta-actin as the reference housekeeping gene.
Statistics
All data presented were analyzed using GraphPad Prism 6.01. The data was subjected to the built-in outlier analysis using the ROUS method at Q = 1 %, and the resulting data sets were subjected to a one-way ANOVA with a Fisher’s LSD post hoc test. In all cases, probabilities less than 5 % (P < 0.05) were considered to be statistically significant.
Results
Biomarkers of acute kidney injury
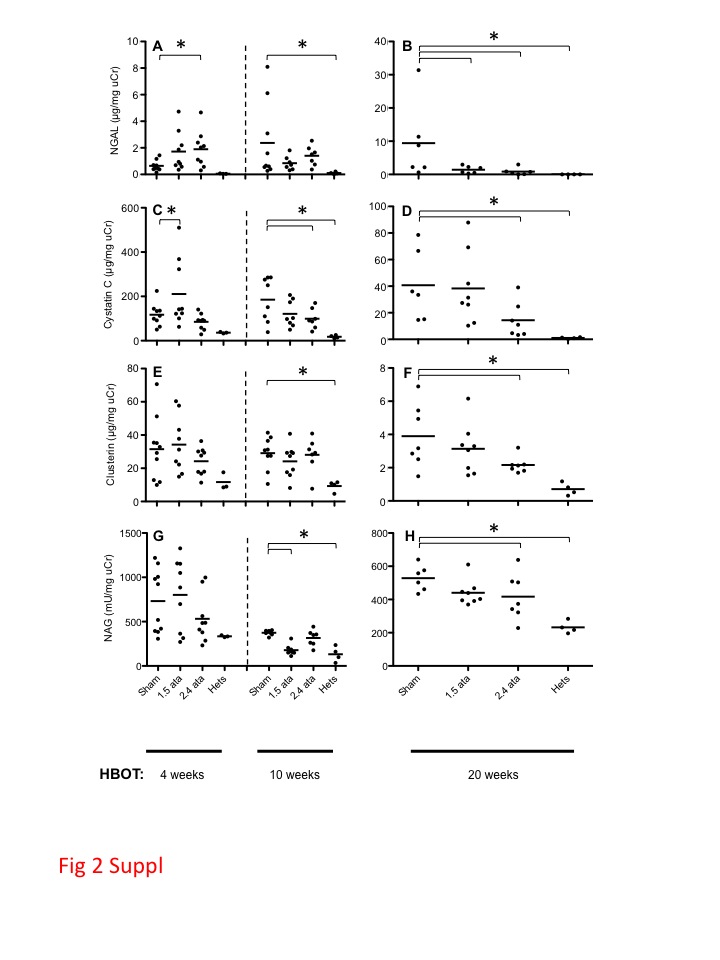
Biomarkers derived from the injured kidney appear in both the urine and serum and can be used to assess the degree of injury and risk of failure. A number of urinary stress biomarkers were assessed to determine whether HBOT treatments were capable of reducing the acute hyperglycemic injury that subsequently progressed to a chronic disease. Of the biomarkers tested, NGAL (Fig. 2a, b) and CyC (Fig. 2c, d) were elevated in db/db animals relative to nondiabetic Hets, suggesting stress or early damage to renal tubules and glomeruli (Koyner et al. 2008). Moreover, these injury biomarkers were reduced when db/db mice were exposed to HBOT treatment. HBOT also showed a trend to reduced urinary clusterin (Fig. 2e, f) and NAG (Fig. 2g, h) levels.
Fig. 2.

Urinary biomarkers of early onset kidney damage. a, c, e, g Results of NGAL, cystatin C, clusterin, and NAG at 4 and 10 weeks, respectively. b, d, f, h The same biomarkers at 20 weeks. Shown are the results for the Het, Sham, and 2.4 ATA groups. All groups are shown in Fig. S2. Dots are individual animals and group means are shown as bars. Asterisks indicate significant differences (p < 0.05). Groups in Figs. 2 and 5, and S2 contain different numbers of data points (mice) due to the removal of a small number of outliers (see statistical section of “Materials and methods”) and a small number of deaths
Blood glucose measurements for all groups of db/db mice ranged from 350 mg/dl to greater than 600 mg/dl at the start of the HBOT regimen. Blood glucose levels were not significantly different among groups, and HBOT did not significantly affect the levels (data not shown).
NGAL is an early response acute phase protein, and as such, NGAL is a systemic animal stress response protein. At the early time point of week 4, NGAL (Fig. 2a) was significantly elevated in response to both 1.5 and 2.4 ATA of HBOT (all data for 1.5 ATA are shown in Supplemental Fig. 2), suggesting that this biomarker is the most sensitive to perturbations caused by HBOT amongst the four markers tested.
Key evidence confirming proximal convoluted tubule epithelium as a site of injury in db/db diabetic mice was provided by CyC, a potent inhibitor of cysteine proteases produced by essentially all organs (Dieterle et al. 2010). CyC (Fig. 2c) was elevated in the Sham and HBOT groups consistent with an early elevation of GFR. NAG is a particularly sensitive indicator of acute oxidative stress, and increased urinary concentrations indicate tubular injury. NAG (Fig. 2g) was elevated in Sham and HBOT groups; however, there was a trend toward lower levels of NAG in the 2.4 vs 1.5 ATA-treated animals that reached statistical significance at the week 20 time point (Supplemental Fig. 2).
At the intermediate time point of 10 weeks (Fig. 2a, c, e, g), all markers continued to increase between the early and intermediate time points consistent with ongoing hyperglycemia-related renal injury in the Sham animals. The HBOT-treated animals remained stable between weeks 4 and 10 time points, with significant reductions seen only for CyC (Fig. 2c) in the 2.4 ATA group and NAG (Supplemental Fig. 2g) in the 1.5 ATA group.
Elevated urine levels of the cellular stress response protein clusterin (Fig. 2e) (Humphreys et al. 1999; Trougakos and Gonos 2009) were observed at 4 and 10 weeks of HBOT (9 and 15 weeks of age) in the Sham and HBOT groups, which reached significance relative to the Hets at 15 weeks of age. This pattern is consistent with oxidative stress at early time points contributing to damage to the proximal convoluted tubule epithelium.
Biomarkers of CKD
By 20 weeks of HBOT (25 weeks of age), the urine samples from all groups showed 8- to 10-fold decreases in levels of clusterin (compare scales in Fig. 2e, f), with significant suppression of clusterin levels by 2.4 ATA HBOT. It is likely that the early damage was repaired and that cytoprotective responses in the HBOT group limited further damage.
The patterns of change in the levels of NAG, an enzyme released from the brush border of proximal tubule epithelial cells, at 4, 10, and 20 weeks of HBOT were remarkably similar to clusterin, with an elevation at early time points followed by a decrease in NAG concentrations in the 2.4 ATA group relative to nondiabetic Het control animals.
At the late time point of 20 weeks, NGAL (Fig. 2b) continued to elevate in the Sham-treated animals but not in the HBOT-treated groups, with significantly decreased levels for both 1.5 and 2.4 ATA groups (Supplemental Fig. 2b). All other markers (cystatin C, clusterin, and NAG) decreased significantly between the early/intermediate timepoints and the late time point of 20 weeks in Sham and HBOT groups; however, there was a significantly greater reduction for each marker in the 2.4 ATA group. The same effect was seen in the 1.5 ATA group but did not reach statistical significance (Supplemental Fig. 2d, f, h). This observation is consistent with a HBOT dose effect.
Since many of the injury biomarkers reflect increased cell turnover in the kidney, we determined whether levels of the apoptotic caspase-3 differed among the groups (Fig. 3). Caspase-3 levels were elevated in the diabetic animals and reduced in the 2.4 ATA group but not the 1.5 ATA HBOT group, consistent with the ability of HBOT to reduce injury and turnover with a clear dose effect.
Fig. 3.

Caspase 3 activity in extracts of kidney tissue taken from animals at the termination of the experiment. Asterisks indicate significant differences (p < 0.05). A protective effect is observed in the 2.4 ATA group relative to the Sham
Stress response gene expression
Tissues under oxidative stress due to metabolic perturbations, inflammatory responses, or fluctuations in oxygen availability frequently respond by activating the expression of antioxidant and other cytoprotective genes such as molecular chaperones (Musial and Zwolinska 2011). We assessed the expression levels of the antioxidant genes Nrf2, Hmox1, and Mt1 and the molecular chaperone HSPA1A (Barrera-Chimal et al. 2011) in nondiabetic Het control animals and diabetic mice with or without HBOT treatment. As shown in Fig. 4, all of these stress response genes were elevated in Sham-treated db/db mice relative to nondiabetic mice. However, repetitive treatment with 2.4 ATA HBOT reduced the expression of all four of these genes. In general, these data are consistent with HBOT establishing a tissue environment that is under reduced levels of oxidative stress.
Fig. 4.

Antioxidant and cytoprotective gene expression levels in kidney tissue at 20 weeks post-HBOT. RNA quantification was performed by real-time PCR. Results are shown for Nrf2, HSPA1A, Mt1, and Hmox1, as indicated. Asterisks indicate significant differences (p < 0.05)
The concept of hormetic adaptive responses involves some of the same genes and oxidative physiology discussed herein. This concept is based on the activation of the vitagene network, a suite of genes primarily involved in the maintenance of cellular homeostasis under conditions of stress (reviewed in Calabrese et al. 2012a). Calabrese and coworkers (Calabrese et al. 2012b) included the vitagene network in their analyses of the plasma and lymphocytes from patients with type 2 diabetes. This work provides evidence for both beneficial oxidative signaling and detrimental oxidative damage to cellular redox homeostasis in these patients.
Assessment of kidney function
Overt kidney damage and filtration impairment in db/db mice can be manifested at later time points by increased serum creatinine levels and albumin leakage (Fig. 5). Urinary albumin increased in the db/db mice relative to the nondiabetic heterozygous controls (Fig. 5a). HBOT-treated animals showed a trend to reduced total albumin excretion (Fig. 5a). A significant reduction in urinary ACR was observed for the 2.4 ATA group compared to Sham controls (Fig. 5b). In our experiments, kidney injury did not proceed to the point of impaired filtration, as creatinine clearance was not significantly increased in db/db mice (Fig. 5c).
Fig. 5.

a Total urinary albumin excreted over 22 h. An increase in excretion was observed in the db/db groups with a trend to reduced excretion in the HBOT groups. b The albumin to creatinine ratio (ACR) is shown for all groups. A significant reduction in the ACR was observed in the Sham versus 2.4 ATA groups (p < 0.05). c Creatinine clearance data for all groups is shown. Urinary creatinine was measured by an enzyme assay, and serum creatinine was quantified by HPLC, as described in the “Materials and methods.” All db/db groups showed reduced creatinine clearance relative to Hets
Histologically, the same types of kidney damage were present in all db/db groups (Fig. 6). Changes were mild and included segmental expansion of the mesangium of a glomerulus (Fig. 6a), tubules with highly vacuolated epithelial cells and PAS-positive material in the lumen (Fig. 6b), numerous variably enlarged clear to PAS-positive nuclei (so-called glycogenated nuclei) in tubular epithelial cells (Fig. 6c), and accumulations of PAS-positive material in tubular epithelial cells (Fig. 6d). Glycogenated nuclei have not been described previously in db/db mice. There was variation in severity within groups, and no overall difference was detected among the three db/db groups. Such changes were not present in the nondiabetic Hets. The other lesions described in Fig. 6 have been reported previously (Sharma et al. 2003; Tesch and Lim 2011), and they provide an independent confirmation of the genetic identity of the db/db mice we used.
Fig. 6.

Histological appearance of db/db kidney sections stained with periodic acid-Schiff reagent (PAS) and counterstained with hematoxylin. All three of the db/db mouse groups contained the lesions noted in the images. a Segmental expansion of mesangium of a glomerulus (arrow). b Tubules with highly vacuolated epithelial cells (arrows) and PAS-positive material in lumen (asterisks). c Numerous variably enlarged clear to PAS-positive nuclei (so-called glycogenated nuclei) in tubular epithelial cells (arrows). d Accumulations of PAS-positive material in tubular epithelial cells. All scale bars represent 10 μm
Discussion
Obesity is a major risk factor for the development of type 2 diabetes mellitus, the most common kind in humans (Wellen and Hotamisligil 2005; Konner and Bruning 2012; Matarese et al. 2012). Both obese humans and db/db mice become insulin resistant and glucose intolerant, all harbingers of diabetes. Insulin resistance is a metabolic state in which adipose, muscle, and hepatic cells no longer respond normally to insulin, and this state can lead to increased blood glucose and fatty acids leading to acute kidney injury. Elevated blood levels of glucose over extended periods to time often lead to chronic kidney disease (CKD) in part by damaging the microvasculature of the kidney resulting in systemic hypertension and impaired filtration.
We have tested the hypothesis that HBOT suppresses kidney injury in the db/db mice, a hypothesis based on our previous work showing that periodic HBOT treatment can protect cells and tissues from stress inducers. The exposures we employed were based on our previous studies (Godman et al. 2010a, b; Fuller et al. 2013) and approximated an extended clinical HBOT treatment course. We tested a number of the urinary biomarkers (Bonventre et al. 2010; Waring and Moonie 2011; Deverajan 2011), and the data revealed evidence of a protective function of HBOT.
A significant decrease in blood glucose concentrations was not observed in the db/db mice subjected to HBOT in our study. It has been reported (Karadurmus et al. 2010) that patients undergoing HBOT have statistically significant decreases in fasting blood glucose levels. It is possible that db/db mice, which maintain considerably higher levels of blood glucose than humans, do not respond the same way as diabetic humans in this facet of glycemic control.
CyC, a small nonglycosylated basic protein, is freely filtered by glomeruli. Once filtered, CyC is reabsorbed by the proximal tubule brush border and metabolized. Elevated urinary concentrations indicate injury to the proximal convoluted tubule epithelium. The patterns of CyC among the groups of mice at 4, 10, and 20 weeks were similar to those of NAG and clusterin. NAG is a biomarker of oxidative stress in the kidney. Clusterin is a stress-inducible cellular defense protein with an undefined function. The suppression by HBOT of urinary levels of CyC was the strongest among these three markers. Interestingly, CyC is likely to be the biomarker most closely tied to proximal tubule function. Indeed, CyC is generally considered to be a functional indicator of glomerular filtration rate (GFR) rather than a predictive marker of proximal tubule injury. Used in this context, it supports further the conclusion that the 2.4 ATA HBOT regime maintained kidney function compared to the Sham group by suppressing injury to both the glomeruli and the proximal convoluted tubule epithelium at 20 weeks of HBOT.
In several respects, the response pattern of NGAL was different. NGAL has evolved to sense and respond quickly to a broad range of stressors including infection, inflammation, ischemia, neoplastic transformation, and tissue involution. In this regard, it is not surprising that NGAL is the most sensitive responder to HBOT. The second difference is the location of NGAL release into urine. In addition to proximal tubule, other major sites of release are the thick ascending limb of Henle’s loop and the collecting ducts in particular. The low NGAL levels at 20 weeks of HBOT are consistent with a repair of the early damage and possibly a reduction in CKD.
Neither of the HBOT groups showed a normalization of blood sugar levels, ruling out this simple explanation for the protection. One plausible mechanism for the reduction in AKI is the enhancement of tissue oxygen delivery and the stimulation of endogenous antioxidant defenses that maintain cell viability. When glucose levels increase in the db/db mice, excess reactive oxygen intermediates (ROI) are generated from three main sources: the mitochondria (Lowell and Shulman 2005), endoplasmic reticulum (Ozcan et al. 2004), and oxygen-utilizing enzymes of the NADPH oxidase family (NOXs). It may seem paradoxical that the addition of HBOT, yet another potential source of ROI, could be helpful. In another paradox, low levels of oxygen in cells can actually increase mitochondrial generation of ROI. Using one paradox to solve another, we propose that one of the effects of HBOT is to deliver oxygen-saturated blood to tissue to restore a state of normoxia that reduces excess ROI production. Nathan 2008 proposed that ROI production associated with obesity involves repetitive cycles of electron carrier loading in hypoxic cells, followed by the periodic inflow of oxygen from adjacent oxygen-rich lipid depots. As a systemic therapeutic, HBOT may be an effective brake to slow this vicious cycle, by limiting the excessive loading of electron carriers in the hypoxic state.
Another beneficial effect of HBOT that extends to virtually all cells in the body is its stimulation of cellular defenses, particularly antioxidant defenses. In a previous study of human microvascular endothelial cells exposed to HBOT (Godman et al. 2010a, b), we showed that HBOT protects these cells against an oxidative stress delivered by t-butyl-hydrogenperoxide. This protection is most likely conveyed through the activation of the oxygen-regulated Nrf2 transcription factor and the increased expression of antioxidant response genes. However, the Nrf2 response is transient and peaks a few hours after HBOT administration. Interestingly, the mRNA levels of Nrf2 and antioxidant response genes in kidney tissue collected at the termination of the experiment (several days after the final HBOT treatment) were significantly lower in the 2.4 ATA HBOT group than Sham animals. Considered together with the AKI markers, these data are consistent with the 2.4 ATA group being under a lower level of oxidative stress. One explanation for these findings is that previous rounds of Nrf2 stimulation by HBOT served to protect the tissue from damage that would otherwise result in chronic ROI generation. This protection may also serve to suppress inflammatory responses, which are also capable of activating antioxidant response gene expression (Wellen and Hotamisligil 2005). It should also be noted that there is a reduction in the expression of the HSPA1A gene in the HBOT-treated group. Since heat shock gene activation is associated with a proteotoxic stress response, this finding suggests that the HBOT treatment course suppresses protein denaturation in the tissue, which may result in part from protein oxidation. These molecular changes are consistent with protection of the microvascular glomerular filtration membrane and the observed reduction in albuminuria, the sine qua non of diabetic kidney disease.
When our group began our study of the mechanisms involved in HBOT more than 5 years ago, we selected as our model a human vascular endothelial cell line based in part on its potential role in tissue cytoprotection as a brake on inflammation (House et al. 2001). Our subsequent work indicated that HBOT, working through the cytoprotection of endothelial cells from oxidative damage, should protect the kidney, especially the glomerular microvasculature, from injury caused by type 2 diabetes. The work presented herein substantiates that hypothesis. In a recent perspectives article (Siddiqi and Advani 2012), the authors pointed out that most patients with diabetic nephropathy never develop end-stage renal disease because they die from cardiovascular disease. A marker held in common by these diseases is the concentration of urinary albumin, likely reflecting the shared pathology of endothelial dysfunction. Therefore, the beneficial effects of HBOT in reducing urinary albumin levels shown herein may extend to therapeutic value for patients with cardiovascular disease as well as type 2 diabetes.
In summary, our findings indicate that the periodic HBOT exposure limits some of the damage associated with the chronic high blood glucose levels, particularly those mediated through oxidative pathways. These findings extend our previous work on HBOT in which we demonstrated protection of human microvascular endothelial cells (HMEC-1) grown in culture from oxidants (Godman et al. 2010a, b) and protection of mouse skin from UV-A damage (Fuller et al. 2013). Whether these observations can be reproduced in patients is not known, although antioxidant genes can be activated in human tissue by HBOT (Ferrer et al. 2007). Importantly, these findings also point to more effective approaches for ameliorating chronic diseases associated with excessive oxidative stress. Specifically, our findings support the concept that the periodic stimulation of endogenous oxygen-dependent metabolic reactions and signaling pathways (Schieber and Chandel 2014) may be a superior approach to suppressing oxidative damage associated with chronic disease than using high levels of radical scavenging “antioxidant” compounds.
Electronic supplementary material
(JPEG 77 kb)
(JPEG 82 kb)
Acknowledgments
We thank OxyHeal Health Group, Inc., for funding and their CEO W. T. “Ted” Gurneè for his vision to extend the applications of HBOT to further improve human health care.
The Mouse Metabolic Phenotypic Center at Yale University is funded by a grant from the NIH/NIDDK # U24 DK-059635.
References
- Abidia A, Laden G, Kuhan G, Johnson BF, Wilkinson AR, Renwick PM, Masson EA, McCollum PT. The role of hyperbaric oxygen therapy in ischaemic diabetic lower extremity ulcers: a double-blind randomised-controlled trial. Eur J Vasc Endovasc Surg. 2003;25:513–518. doi: 10.1053/ejvs.2002.1911. [DOI] [PubMed] [Google Scholar]
- Alex J, Laden G, Cale ARJ, et al. Pretreatment with hyperbaric oxygen and its effect on neuropsychometric dysfunction and systemic inflammatory response after cardiopulmonary bypass: a prospective randomized double-blind trial. J Thorac Cardiovasc Surg. 2005;130:1623–1630. doi: 10.1016/j.jtcvs.2005.08.018. [DOI] [PubMed] [Google Scholar]
- Al-Waili NS, Butler GJ. Effects of hyperbaric oxygen on inflammatory response to wound and trauma: possible mechanism of action. Sci World J. 2006;6:425–441. doi: 10.1100/tsw.2006.78. [DOI] [PMC free article] [PubMed] [Google Scholar]
- Babchin A, Levich E, Melamed MDY, Sivashinsky G. Osmotic phenomena in application for hyperbaric oxygen treatment. Colloids Surf B: Biointerfaces. 2011;83:128–132. doi: 10.1016/j.colsurfb.2010.11.019. [DOI] [PubMed] [Google Scholar]
- Barrera-Chimal J, Perez-Villalva R, Cortes-Gonzalez C, Ojeda-Cervantes M, Gamba G, Morales-Buenrostro LE, Bobadilla NA. Hsp72 is an early and sensitive biomarker to detect acute kidney injury. EMBO Mol Med. 2011;3:5–20. doi: 10.1002/emmm.201000105. [DOI] [PMC free article] [PubMed] [Google Scholar]
- Bishop AJ, Mudge E (2012) A retrospective study of diabetic foot ulcers treated with hyperbaric oxygen therapy. Int Wound J 9:665–676 [DOI] [PMC free article] [PubMed]
- Bonventre JV, Vaidya VS, Schmouder R, Feig P, Dieterle F. Next-generation biomarkers for detecting kidney toxicity. Nat Biotechnol. 2010;28:436–440. doi: 10.1038/nbt0510-436. [DOI] [PMC free article] [PubMed] [Google Scholar]
- Breyer MD. Drug discovery for diabetic nephropathy: trying the leap from mouse to man. Semin Nephrol. 2012;32:445–451. doi: 10.1016/j.semnephrol.2012.07.007. [DOI] [PubMed] [Google Scholar]
- Breyer MD, Böttinger E, Brosius FC, III, Cofffman TM, Harris RC, Heilig CW, Sharma K. Mouse models of diabetic nephropathy. J Am Soc Nephrol. 2005;16:27–45. doi: 10.1681/ASN.2004080648. [DOI] [PubMed] [Google Scholar]
- Brosius FC, Alpers CE, Bottinger EP, et al. Mouse models of diabetic nephropathy. J Am Soc Nephrol. 2009;20:2503–2512. doi: 10.1681/ASN.2009070721. [DOI] [PMC free article] [PubMed] [Google Scholar]
- Calabrese V, Cornelius C, Leso V, Trovato-Salinaro A, Ventimiglia B, Cavallaro M, Scuto M, Rizza S, Zanoli L, Neri S, Castellino P. Oxidative stress, glutathione status, sirtuin and cellular stress response in type 2 diabetes. Biochim Biophys Acta. 2012;1822(5):729–736. doi: 10.1016/j.bbadis.2011.12.003. [DOI] [PubMed] [Google Scholar]
- Calabrese V, Cornelius C, Dinkova-Kostova AT, et al. Cellular stress responses, hormetic phytochemicals and vitagenes in aging and longevity. Biochim Biophys Acta. 2012;1822:753–783. doi: 10.1016/j.bbadis.2011.11.002. [DOI] [PubMed] [Google Scholar]
- Cheng O, Ostrowski RP, Wu B, Liu W, Chen C, Zhang JH. Cyclooxygenase-2 mediates hyperbaric oxygen preconditioning in the rat model of transient global cerebral ischemia. Stroke. 2011;42:484–490. doi: 10.1161/STROKEAHA.110.604421. [DOI] [PMC free article] [PubMed] [Google Scholar]
- Daniel RAF, Cardoso VK, Góis E, Jr, Parra RS, Garcia SB, Rocha JJ, Féres O. Effect of hyperbaric oxygen therapy on the intestinal ischemia reperfusion injury. Acta Cir Bras. 2011;26:463–469. doi: 10.1590/S0102-86502011000600010. [DOI] [PubMed] [Google Scholar]
- Dennog C, Radermacher P, Barnett YA, Speit G. Antioxidant status in humans after exposure to hyperbaric oxygen. Mutat Res. 1999;428:83–89. doi: 10.1016/S1383-5742(99)00034-4. [DOI] [PubMed] [Google Scholar]
- Deverajan P. Biomarkers for the early detection of acute kindey injury. Curr Opin Pediatr. 2011;23:194–200. doi: 10.1097/MOP.0b013e328343f4dd. [DOI] [PMC free article] [PubMed] [Google Scholar]
- Dieterle F, Perentes E, Cordier A, et al. Urinary clusterin, cystatin C, [beta]2-microglobulin and total protein as markers to detect drug-induced kidney injury. Nat Biotechnol. 2010;28:463–469. doi: 10.1038/nbt.1622. [DOI] [PubMed] [Google Scholar]
- Duzgun AP, Satır HZ, Ozozan O, Saylam B, Kulah B, Coskun F. Effect of hyperbaric oxygen therapy on healing of diabetic foot ulcers. J Foot Ankle Surg. 2008;47:515–519. doi: 10.1053/j.jfas.2008.08.002. [DOI] [PubMed] [Google Scholar]
- Faglia E, Favales F, Aldeghi A, et al. Adjunctive systemic hyperbaric oxygen therapy in treatment of severe prevalently ischemic diabetic foot ulcer. A randomized study. Diabetes Care. 1996;19:1338–1343. doi: 10.2337/diacare.19.12.1338. [DOI] [PubMed] [Google Scholar]
- Ferrer M, Sureda A, Batle J, Tauler P, Tur J, Pons A. Scuba diving enhances endogenous antioxidant defenses in lymphocytes and neutrophils. Free Radic Res. 2007;41:274–281. doi: 10.1080/10715760601080371. [DOI] [PubMed] [Google Scholar]
- Forbes JM, Coughlan MT, Cooper ME (2008) Oxidative stress as a major culprit in kidney disease in diabetes. Diabetes 57:1446–1454 [DOI] [PubMed]
- Fuller AM, Giardina C, Hightower LE, Perdrizet GA, Tierney CA. Hyperbaric oxygen preconditioning protects skin from UV-A damage. Cell Stress Chaperones. 2013;18:97–107. doi: 10.1007/s12192-012-0362-2. [DOI] [PMC free article] [PubMed] [Google Scholar]
- Gill AL, Bell CNA. Hyperbaric oxygen: its uses, mechanisms of action and outcomes. QJM. 2004;97:385–395. doi: 10.1093/qjmed/hch074. [DOI] [PubMed] [Google Scholar]
- Godman C, Chheda K, Hightower L, Perdrizet G, Shin D-G, Giardina C (2010a) Hyperbaric oxygen induces a cytoprotective and angiogenic response in human microvascular endothelial cells. Cell Stress Chaperones 15:431–442 [DOI] [PMC free article] [PubMed]
- Godman CA, Joshi R, Giardina C, Perdrizet G, Hightower LE. Hyperbaric oxygen treatment induces antioxidant gene expression. Ann N Y Acad Sci. 2010;1197:178–183. doi: 10.1111/j.1749-6632.2009.05393.x. [DOI] [PubMed] [Google Scholar]
- Grgic I, Campanholle G, Bijol V, Wang C, Sabbisetti VS, Ichimura T, Humphreys BD, Bonventre JV. Targeted proximal tubule injury triggers interstitial fibrosis and glomerulosclerosis. Kidney Int. 2012;82:172–183. doi: 10.1038/ki.2012.20. [DOI] [PMC free article] [PubMed] [Google Scholar]
- Han C, Lin L, Zhang W, et al. Hyperbaric oxygen preconditioning alleviates myocardial ischemic injury in rats. Exp Biol Med. 2008;233:1448–1453. doi: 10.3181/0801-RM-8. [DOI] [PubMed] [Google Scholar]
- He X, Xu X, Fan M, et al. Preconditioning with hyperbaric oxygen induces tolerance against renal ischemia-reperfusion injury via increased expression of heme oxygenase-1. J Surg Res. 2011;170:e271–e277. doi: 10.1016/j.jss.2011.06.008. [DOI] [PubMed] [Google Scholar]
- Hooper PL, Hooper PL. Inflammation, heat shock proteins, and type 2 diabetes. Cell Stress Chaperones. 2009;14:113–115. doi: 10.1007/s12192-008-0073-x. [DOI] [PMC free article] [PubMed] [Google Scholar]
- Hooper PL, Balogh G, Riivas E, Kavanagh K, Vigh L. The importance of the cellular stress response in the pathogenesis and treatment of type 2 diabetes. Cell Stress Chaperones. 2014;19:447–464. doi: 10.1007/s12192-014-0493-8. [DOI] [PMC free article] [PubMed] [Google Scholar]
- House SD, Guidon PT, Jr, Perdrizet GA, Rewinski M, Kyriakos R, Bockman RS, Mistry T, Gallagher PA, Hightower LE. Effects of heat shock, stannous chloride, and gallium nitrate on the rat inflammatory response. Cell Stress Chaperones. 2001;6(2):164–171. doi: 10.1379/1466-1268(2001)006<0164:EOHSSC>2.0.CO;2. [DOI] [PMC free article] [PubMed] [Google Scholar]
- Humphreys D, Carver J, Easterbrook-Smith S, Wilson M. Clusterin has chaperone-like activity similar to that of small heat shock proteins. J Biol Chem. 1999;274:6875–6881. doi: 10.1074/jbc.274.11.6875. [DOI] [PubMed] [Google Scholar]
- Jun M, Venkataraman V, Razavian M, Cooper B, Zoungas S, Ninomiya T, Webster AC, Perkovic V (2012) Antioxidants for chronic kidney disease. Cochrane Database Syst Rev [DOI] [PMC free article] [PubMed]
- Karadurmus N, Sahin M, Tasci C, Naharci I, Ozturk C, Ilbasmis S, Dulkadir Z, Sen A, Saglam K. Potential benefits of hyperbaric oxygen therapy on atherosclerosis and glycaemic control in patients with diabetic foot. Endokrynologia Pol. 2010;61(3):275–279. [PubMed] [Google Scholar]
- Kessler L, Bilbault P, Ortéga F, Grasso C, Passemard R, Stephan D, Pinget M, Schneider F. Hyperbaric oxygenation accelerates the healing rate of nonischemic chronic diabetic foot ulcers. Diabetes Care. 2003;26:2378–2382. doi: 10.2337/diacare.26.8.2378. [DOI] [PubMed] [Google Scholar]
- Konner A, Bruning J. Selective insulin and leptin resistance in metabolic disorders. Cell Metab. 2012;16:144–152. doi: 10.1016/j.cmet.2012.07.004. [DOI] [PubMed] [Google Scholar]
- Koyner J, Bennett M, Worcester E, et al. Urinary cystatin C as an early biomarker of acute kidney injury following adult cardiothoracic surgery. Kindney Int. 2008;74:1059–1069. doi: 10.1038/ki.2008.341. [DOI] [PMC free article] [PubMed] [Google Scholar]
- Li J, Liu W, Ding S, Xu W, Guan Y, Zhang JH, Sun X. Hyperbaric oxygen preconditioning induces tolerance against brain ischemia–reperfusion injury by upregulation of antioxidant enzymes in rats. Brain Res. 2008;1210:223–229. doi: 10.1016/j.brainres.2008.03.007. [DOI] [PubMed] [Google Scholar]
- Li JS, Zhang W, Kang ZM, Ding SJ, Liu WW, Zhang JH, Guan YT, Sun XJ. Hyperbaric oxygen preconditioning reduces ischemia–reperfusion injury by inhibition of apoptosis via mitochondrial pathway in rat brain. Neuroscience. 2009;159:1309–1315. doi: 10.1016/j.neuroscience.2009.01.011. [DOI] [PubMed] [Google Scholar]
- Lin KC, Niu KC, Tsai KJ, Kuo JR, Wang LC, Chio CC, Chang CP. Attenuating inflammation but stimulating both angiogenesis and neurogenesis using hyperbaric oxygen in rats with traumatic brain injury. J Trauma Acute Care Surg. 2012;72:650–659. doi: 10.1097/TA.0b013e31823c575f. [DOI] [PubMed] [Google Scholar]
- Londahl M. Hyperbaric oxygen therapy as treatment of diabetic foot ulcers. Diabetes Metab Res Rev. 2012;28(Suppl 1):78–84. doi: 10.1002/dmrr.2256. [DOI] [PubMed] [Google Scholar]
- Londahl M, Landin-Olsson M, Katzman P. Hyperbaric oxygen therapy improves health-related quality of life in patients with diabetes and chronic foot ulcer. Diabet Med. 2011;28:186–190. doi: 10.1111/j.1464-5491.2010.03185.x. [DOI] [PubMed] [Google Scholar]
- Lowell B, Shulman G. Mitochondrial dysfunction and type 2 diabetes. Science. 2005;307:384–387. doi: 10.1126/science.1104343. [DOI] [PubMed] [Google Scholar]
- Matarese G, Procaccini C, Rosa V. At the crossroad of T cells, adipose tissue, and diabetes. Immunol Rev. 2012;249:116–134. doi: 10.1111/j.1600-065X.2012.01154.x. [DOI] [PubMed] [Google Scholar]
- Matsunami T, Sato Y, Sato T, Ariga S, Shimomura T, Yukawa M. Oxidative stress and gene expression of antioxidant enzymes in the streptozotocin-induced diabetic rats under hyperbaric oxygen exposure. Int J Clin Exp Pathol. 2009;3:177–188. [PMC free article] [PubMed] [Google Scholar]
- Matsunami T, Sato Y, Hasegawa Y, Ariga S, Kashimura H, Sato T, Yukawa M. Enhancement of reactive oxygen species and induction of apoptosis in streptozotocin-induced diabetic rats under hyperbaric oxygen exposure. Int J Clin Exp Pathol. 2011;4:255–266. [PMC free article] [PubMed] [Google Scholar]
- Musial K, Zwolinska D. Heat shock proteins in chronic kidney disease. Pediatr Nephrol. 2011;26:1031–1037. doi: 10.1007/s00467-010-1709-5. [DOI] [PMC free article] [PubMed] [Google Scholar]
- Nathan C. Epidemic inflammation: pondering obesity. Mol Med. 2008;14:485–492. doi: 10.2119/2008-00038.Nathan. [DOI] [PMC free article] [PubMed] [Google Scholar]
- Ozcan U, Cao Q, Yilmaz E, et al. Endoplasmic reticulum stress links obesity, insulin action, and type 2 diabetes. Science. 2004;306:457–461. doi: 10.1126/science.1103160. [DOI] [PubMed] [Google Scholar]
- Padgaonkar VA, Giblin FJ, Fowler K, Leverenz VR, Reddan JR, Dziedzic DC. Heme oxygenase synthesis is induced in cultured lens epithelium by hyperbaric oxygen or puromycin. Exp Eye Res. 1997;65:435–443. doi: 10.1006/exer.1997.0356. [DOI] [PubMed] [Google Scholar]
- Rothfuss A, Radermacher P, Speit G. Involvement of heme oxygenase-1 (HO-1) in the adaptive protection of human lymphocytes after hyperbaric oxygen (HBO) treatment. Carcinogenesis. 2001;22:1979–1985. doi: 10.1093/carcin/22.12.1979. [DOI] [PubMed] [Google Scholar]
- Sabbisetti V, Ito K, Wang C, Yang L, Mefferd S, Bonventre J. Novel assays for detection of urinary KIM-1 in mouse models of kidney injury. Toxicol Sci. 2013;131:13–25. doi: 10.1093/toxsci/kfs268. [DOI] [PMC free article] [PubMed] [Google Scholar]
- Salek R, Maguire M, Bentley E, et al. A metabolomic comparision of urinary changes in type 2 diabetes in mouse, rat, and human. Physiol Genomics. 2007;29:99–108. doi: 10.1152/physiolgenomics.00194.2006. [DOI] [PubMed] [Google Scholar]
- Schieber M, Chandel N. ROS function in redox signaling and oxidative stress. Curr Biol. 2014;24:R453–R462. doi: 10.1016/j.cub.2014.03.034. [DOI] [PMC free article] [PubMed] [Google Scholar]
- Sharma K, McCue P, Dunn S. Diabetic kidney disease in the db/db mouse. Am J Physiol Renal Physiol. 2003;284:F1138–F1144. doi: 10.1152/ajprenal.00315.2002. [DOI] [PubMed] [Google Scholar]
- Shiraishi N, Aono K, Utsumi K. Increased metallothionein content in rat liver induced by X irradiation and exposure to high oxygen tension. Radiat Res. 1983;95:298–302. doi: 10.2307/3576256. [DOI] [PubMed] [Google Scholar]
- Siddiqi FS, Advani A. Endothelial-podocyte crosstalk: the missing link between endothelial dysfunction and albuminuria in diabetes. Diabetes. 2012;62(11):3647–3655. doi: 10.2337/db13-0795. [DOI] [PMC free article] [PubMed] [Google Scholar]
- Simsek K, Ay H, Topal T, et al. Long-term exposure to repetitive hyperbaric oxygen results in cumulative oxidative stress in rat lung tissue. Inhal Toxicol. 2011;23:166–172. doi: 10.3109/08958378.2011.558528. [DOI] [PubMed] [Google Scholar]
- Sun Q, Sun Q, Liu Y, Sun X, Tao H. Anti-apoptotic effect of hyperbaric oxygen preconditioning on a rat model of myocardial infarction. J Surg Res. 2011;171:41–46. doi: 10.1016/j.jss.2010.01.036. [DOI] [PubMed] [Google Scholar]
- Tesch GH, Lim AKH. Recent insights into diabetic renal injury from the db/db mouse model of type 2 diabetic nephropathy. Am J Physiol Renal Physiol. 2011;300:F301–F310. doi: 10.1152/ajprenal.00607.2010. [DOI] [PubMed] [Google Scholar]
- Thackham JA, McElwain DLS, Long RJ. The use of hyperbaric oxygen therapy to treat chronic wounds: a review. Wound Repair Regen. 2008;16:321–330. doi: 10.1111/j.1524-475X.2008.00372.x. [DOI] [PubMed] [Google Scholar]
- Trougakos IP, Gonos ES (2009) Chapter 9 oxidative stress in malignant progression: the role of clusterin, a sensitive cellular biosensor of free radicals. In: Advances in Cancer Research, ed Van de Waude GF, Klein G.. Academic Press, 171-210 [DOI] [PubMed]
- Waring W, Moonie A. Earlier recognition of nephrotoxicity using novel biomarkers of acute kidney injury. Clin Toxicol. 2011;49:720–728. doi: 10.3109/15563650.2011.615319. [DOI] [PubMed] [Google Scholar]
- Wellen K, Hotamisligil G. Inflammation, stress, and dabetes. J Clin Invest. 2005;115:1111–1119. doi: 10.1172/JCI200525102. [DOI] [PMC free article] [PubMed] [Google Scholar]
Associated Data
This section collects any data citations, data availability statements, or supplementary materials included in this article.
Supplementary Materials
(JPEG 77 kb)
(JPEG 82 kb)