Abstract
The Reactome database of curated biological pathways provides a tool for visualizing user-supplied expression data as an overlay on pathway diagrams, thereby providing an effective means to examine expression of the constituents of the pathway and determine whether all that are necessary are present. Several experiments can be visualized in succession, to determine whether expression changes with experimental conditions, a useful feature for examining a time-course, dose-response or disease progression.
Keywords: Reactome, Pathway, Expression Analysis, Microarray, quantitative proteomics
Introduction
Reactome (UNIT 8.7; Haw and Stein, 2012) is a collaborative project between the Ontario Institute for Cancer Research, Cold Spring Harbor Laboratory, New York University Medical Center and the European Bioinformatics Institute. It is a database of freely accessible curated human biological pathways, representing many areas of biology in a consistently curated manner. Pathways are authored by biologists who are recruited for their expertise in the area. Reactome's Curators convert the information provided by experts into entries saved in Reactome's open data model, representing biological molecules (entities) that interact as they participate in reactions (events, or pathway steps), which connect into pathways. The resulting pathways are reviewed by a second external expert to ensure they represent the consensus in the field. Pathways are represented graphically as Pathway Diagrams in Reactome's Pathway Browser. The underlying data is available for download in several reusable data exchange formats including BioPAX and SBML.
This unit describes how to use the Reactome database to analyze expression data, or any other form of data where molecular identifiers are associated with a numeric value or values.
Strategic Planning
The Analyze Data Tool provides a common entry point for several types of data analysis. The format of the data submitted determines which analyses are performed. Data must consist of a list of identifiers, one per row, which can be matched to molecules present in Reactome pathways. A header line starting with # must be present. All analysis submissions initiate pathway over-representation and topology analysis. Expression analysis is performed if numeric values are added in columns subsequent to the identifiers in column 1. The columns must be consecutive (tab-delimited text). Numeric values are associated with the molecular identifier in column 1 and are used to determine a colour that is overlaid onto Pathway Diagram objects that correspond to the identifier.
The expression analysis method was created for use with microarray data, but works equally well with any dataset that consists of a list of identifiers with associated numeric values, e.g. quantitative proteomics or GWAS scores. If the values submitted were obtained using more than one technology it is desirable to normalise the data before submission. Equally if you wish to represent differential expression this should be pre-calculated.
Submitted identifiers are mapped to objects (molecules and groups of molecules such as complexes or sets) present in Reactome pathways. Many identifier types can be used, but optimal mapping accuracy will be achieved if submitted data represents proteins with UniProt accessions, small molecules with ChEBI IDs, RNA and DNA molecules with EnsEMBL IDs. HGNC gene symbols may be used, these are mapped to the gene, transcript and derived protein. UniProt isoform-specific identifiers if used will match only that isoform, while UniProt identifiers representing the canonical peptide will match all isoforms of the protein. If several identifiers match the same Reactome molecule, for instance when using data from some microarray data sets, the values are averaged. If you prefer to ignore the values associated with certain identifiers (probes), the associated numeric values or the entire row of data can be removed before submission. Null values (blanks) may be included, all non-numeric values are ignored; in results these will be replaced by the abbreviation NaN (Not a Number). Identifiers do not need to be from the same database source, identifiers for gene, protein and compound may be mixed, and may represent more than one species. See the section Project to Human for more information on how mixed species lists are handled.
Each column of numeric data is handled as a separate sample or experimental condition. When the results are displayed, an Experiment Browser tool allows the user to select and view separate coloured overlays for each submitted data column. This feature is particularly useful for visualizing time-points or a disease progression.
Basic Protocol 1
Using the Analyze Data Tool with Expression Data
Using the Analyze Data tool, expression data can be submitted and used to generate colored overlays representing expression values on Reactome pathway diagrams.
Necessary resources
Hardware
A computer capable of running a current web browser and an internet connection.
Software
Any current web browser such as Internet Explorer, Firefox, Google Chrome or Safari.
Files
Files in the proper format (see Strategic Planning for guidelines)
The Analyze Data Tool
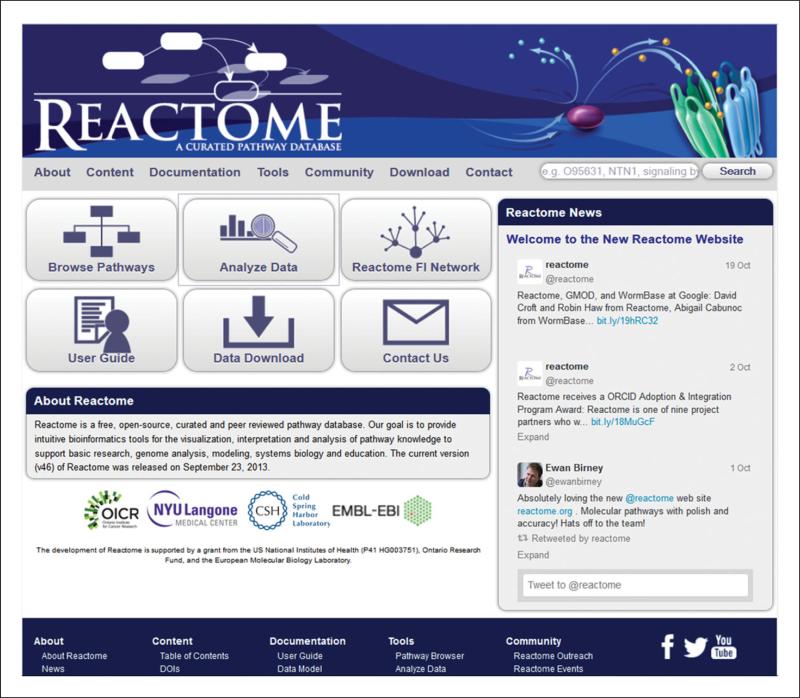
Open the Reactome home page at www.reactome.org. On this page is a panel of 6 buttons. Select the Analyze Data button, which is the middle button on the top row (Figure 1).
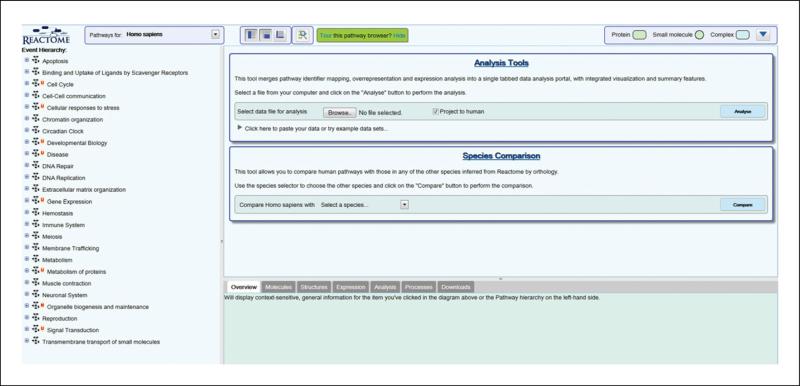
Click the Analyse Data button to open the analysis submission interface (ASI), in the Pathway Browser (Figure 2). The Analysis Tools form is the upper blue-boxed section of the ASI, combining those tools that require input in the form of a user data set or file.
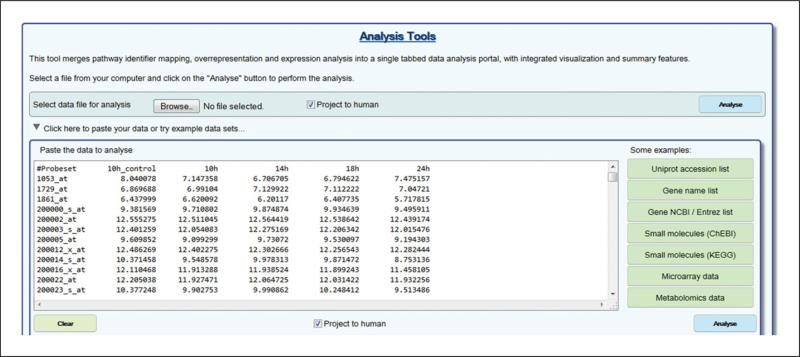
Enter data for submission. Either use the Browse button to select a saved file containing data in the correct format (Figure 3), or enter data directly by typing or pasting into the form that appears after clicking on the triangle labelled ‘Click here to paste your data...’ If you don't have your own data set, click on the triangle labelled ‘Microarray data’ to open an example data set in the correct format for expression analysis.
- Project to Human. Choose whether or not to convert non-human identifiers to their human equivalents.When the ‘Project to human’ box is checked (refer to Figure 3), all submitted gene or protein identifiers for non-human species are converted to their human orthologues and only human pathway matches are shown in the results. If mixed identifier lists are submitted only non-human identifiers are converted. Small molecule identifiers are considered to be of equal relevance to all species. Orthologues are identified using the same orthology inference process used by Reactome to predict pathways for several non-human species. Conversion of non-human identifiers to their human equivalents will in most cases improve the likelihood and statistical significance of a match with a Reactome pathway. Possible exceptions include identifier lists representing an infectious process, where the human host and infecting agent are both represented, when this is the case a better match may be obtained if the Project to Human selection is unchecked.
Submit the Data for Analysis. Click on the Analyse button in the corresponding submission panel to submit data for analysis.
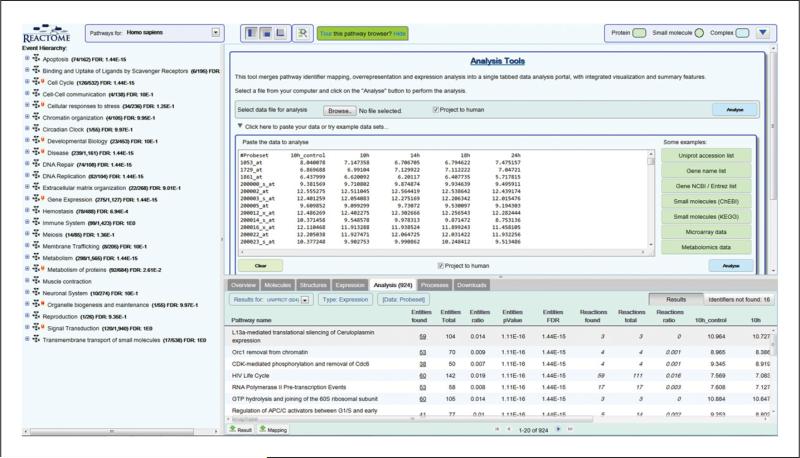
- View Results. View the analysis results in the Analysis results tab, within the Details Panel, which is the lower-right panel visible in the Pathway Browser (Figure 4).All Reactome pathways are shown, in blocks of 20 pathways, ranked by the FDR value obtained from over-representation analysis.Use the results navigation buttons at the bottom of the Analysis results tab panel to open further blocks of 20 pathways.Columns in the analysis results table (refer to Figure 4) represent:
- Pathway name. Click on the name to select it and open the pathway diagram.
- Entities found. The number of molecules of the type selected with Results Type that are common between the submitted data set and the pathway named in column 1. Click on this number to display matched identifiers and their mapping to Reactome molecules. Click on the Results tab to go back to the results view.
- Entities total. The total number of molecules of the type selected with Results Type within the pathway named in column 1.
- Entities ratio. The ratio of entities from this pathway that are molecules of the type selected with Results Type vs. all entities in Reactome of the type selected with Results Type.
- Entities pvalue. The result of the statistical test for over-representation, for molecules of the results type selected.
- Entities FDR. Over-representation probability corrected for false discovery rate.
- Reactions found. The number of reactions in the pathway that are represented by at least one molecule in the submitted data set, for the molecule type selected with Results Type.
- Reactions Total. The number of reactions in the pathway that contain molecules of the type selected with Results Type.
- Reactions ratio. The ratio of reactions from this pathway that contain molecules of the type selected with Results Type vs. all Reactome reactions that contain molecules of the type selected with Results Type.
- Columns 10 and above represent the numeric values submitted. If a header row was used, the submitted column names are used here. The final column gives the species name for the molecule that was matched by the submitted identifier.
Note that the number of molecules matched/total number of molecules and FDR values are also shown after the pathway names listed in the Pathway Hierarchy Pane, the left side panel of the Pathway Browser. - Switch between molecule subtypes. Use the ‘Results for:’ selector located top-left of the analysis results table to choose the desired molecule subtype from a drop-down list (Figure 5).By default, all identified molecule subtypes (proteins, small molecules, genes, transcripts) are used for analyses and overlays. Selecting one of these subtypes will display analysis/overlay results that consider only the selected subtype. If the submitted identifiers represent only one molecule subtype this is selected by default and there will be no dropdown list.
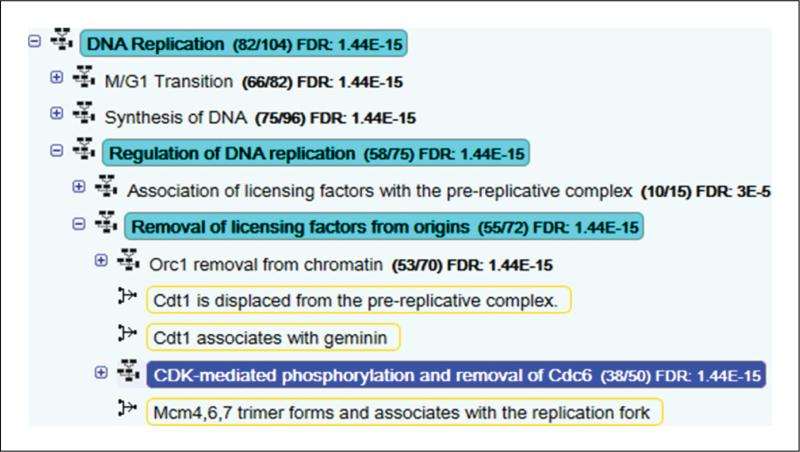
- Select a pathway of interest. Either in the Analysis tab or in the Pathway Hierarchy Pane, select a pathway that is of interest.Note that if you were using the Pathway Browser to view a pathway before you submitted a data set for analysis, this pathway will be selected if it has been hit by the sample, even if the pathway is not in the first block of 20 results. The pathway name will be highlighted in dark blue in the Pathway Hierarchy Panel or mid-blue in the Analysis tab. The Pathway Diagram for this pathway will open, replacing the ASI panel on the upper-right side of the Pathway Browser. If you selected a sub-pathway in the Analysis tab, the Pathway Hierarchy will automatically expand to show it, highlighted in dark blue, with the name of the parent pathway highlighted in pale blue. You can show/hide levels of the Pathway Hierarchy by clicking on the plus/minus button to the left of a pathway name (Figure 6).
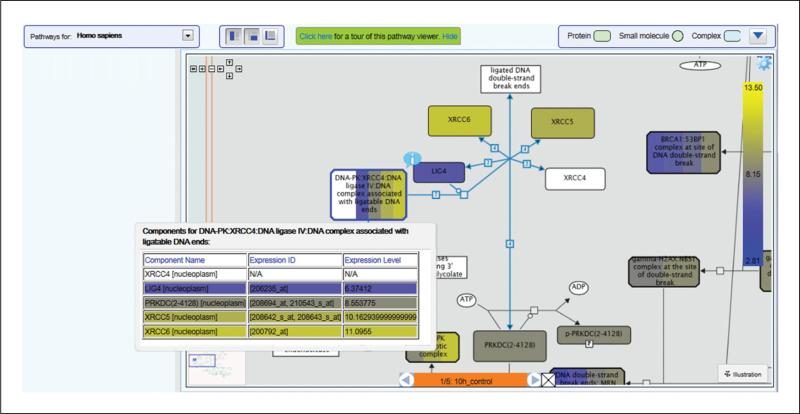
- Click on the plus button to the left of a pathway name to reveal the reactions and possible subpathways that it contains.Pathways are indicated by an icon immediately to the left of the pathway name, showing seven boxes connected by lines, while reactions (pathway steps) are indicated by an icon representing two connected boxes joined by an arrow headed line to a third box to their right. When reactions are visible, those that contain any of the molecules represented by the submitted identifiers are boxed in orange (Figure 6).Pathway diagrams represent expression data as a colored overlay (see example in Figure 7).Objects in the pathway diagram are colored according to the numeric values submitted. The colors are based on a scale, represented by a scale bar on the right hand side of the diagram. The scale bar automatically adjusts to fit the range of values in the dataset. The highest values are represented by bright yellow, through pale yellow to pale blue, to bright blue representing the lowest values. White is used for objects that were not represented in the input data. For microarray data this typically includes all small molecules, shown in Reactome pathway diagrams as circles or ovals.Objects with bands of color represent complexes or sets containing more than one molecule. The size and color of the bands reflect the distribution of values submitted for the molecules within the complex or set.
View details of Complexes and Sets. To view details of the component molecules for a complex or set right click it and select the menu option ‘Display Participating Molecules'. A table opens, representing each component of the complex/set as a row (Figure 7).
- Cycle through experiments. Use the orange Experiment browser toolbar (bottom of Figure 7) to select the column of numeric values that is used to overlay color onto the diagram, if more than one was submitted. Click on the arrow buttons to cycle between data columns.In effect this tool allows the user to cycle through the columns of data, e.g. time-points or stages of disease progression.The headers provided are displayed as a label between the arrow buttons. The Pathway Diagram will re-color to reflect the values in the selected data column.
Figure 1.
The Reactome home page with panel of 6 buttons. The Analyze Data button, middle of the top row, is used to open the analysis submission interface.
Figure 2.
The Analysis Submission Interface, on the upper-right side of the pathway browser.
Figure 3.
The microarray data example file opened in the ASI.
Figure 4.
Expression analysis results table in Analysis results tab.
Figure 5.
Molecular subtype dropdown.
Figure 6.
Detail of the Pathway Hierarchy showing analysis results. The pathway CDK-mediated phosphorylation and removal of Cdc6 is selected (highlighted in dark blue). The ‘parents’ of this pathway representing higher levels in the hierarchical organisation are highlighted in pale blue. Over-representation analysis results are to the right of the pathway name. Pathway topology results are indicated by orange boxes around matching reaction names.
Figure 7.
Example of pathway coloring following expression data analysis, showing details table for a complex and the experiment browser bar.
Results Downloads
-
12Download analysis results. Use the Results button at the bottom left of the analysis results tab (Figure 4).This will download a CSV file that duplicates the results in the Analysis Results tab, with the following additional columns:
- Species identifier. An identifier code for the Species of the pathway.
- Species name. The species name corresponding to the above.
- Submitted entities found. The submitted identifiers that match the pathway.
- Mapped entities. Identifiers that the pre-analysis mapping process found to correspond to the submitted identifiers listed in Mapped entities.
- Found reaction identifiers. The internal identifier for the reactions that were identified by Pathway Topology Analysis.
-
13
Download mapping file. Select the ‘Mapping’ button in the bottom left corner of the Analysis results view to download a CSV file that contains a complete listing of all submitted identifiers that the mapping process could match to a molecule in Reactome.
-
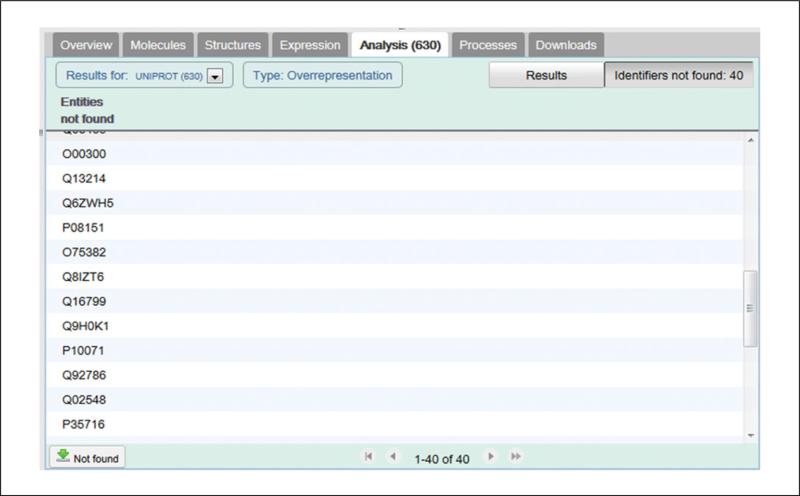
14Refer to the Identifiers not Found tab. Select the ‘Identifiers not found button in the top right corner of the Analysis results view to view and download a list of submitted identifiers that could not be associated with a pathway molecule in Reactome. The number of submitted identifiers that could not be associated with a molecule in a Reactome pathway is shown on this button (Figure 8). The Not found list includes a download link at the bottom.Unmatched identifiers should be considered as part of the interpretation of analysis results. If a significant proportion of the submitted identifiers do not match a pathway, they could represent a pathway that is not represented in Reactome, or it could be that the identifiers were not recognised, in which case you may wish to replace the identifiers with equivalents from UniProt, ChEBI or EnsEMBL.
Figure 8.
The ‘Not found’ tab, with download button bottom left.
Commentary
Background Information
Molecular objects represented as part of Reactome pathways are assigned to cellular compartments, all named using GO compartment terms. With a small number of exceptions, molecules are represented within a generic cell, having no specific cell-type or tissue. Pre-computed expression profiles from the Expression Atlas (http://www.ebi.ac.uk/gxa/) can be viewed in the Details section of Reactome's Pathway Browser, but for complete flexibility Reactome provides a simple Expression Analysis tool that any biologist can use to submit user-determined expression values, or indeed any form of numeric values, such as quantitative proteomics or genotyping scores. This allows the submitter to use a data set perfectly tailored to their requirements, perhaps after a rigourous selection process to eliminate poor-quality data, or obtained from an unusual tissue, cell-type, or disease-state, or following a candidate drug treatment. The coloured overlay onto curated human pathways provides an intuitive visualization, facilitating insights that would be much harder to achieve with a tabular or other graphical representation. In particular, the ability to see a succession of samples with associated changes in colouring representing changes in the expression of individual pathway molecules is an effective way to identify patterns of conditional or temporally-regulated changes.
Reactome is a fully open access and open-source project. All the software developed for use in Reactome is available for download and redistribution, and the data itself is available in a variety of formats. The Download link on the Reactome web site provides instructions for obtaining data and software.
The Reactome dataset is available as relational database tables in a format compatible with MySQL (http//www.mysql.com; UNIT 9.2; Jamieson, 2003) and as files compatible with the Protégé-2000
knowledgebase editor (http://protege.stanford.edu) and available as tab-delimited text, BioPAX, SBML (http://www.sbml.org) and PSI-MITAB (http://www.psidev.info) files.
Critical Parameters
Pay particular attention to the formatting requirements as explained in Necessary Resources, files. Molecular identifiers must be provided as the first item on each line, and only one per line. Although the analysis tool can perform mapping of identifiers, the inherent ambiguity can be avoided by using UniProt identifiers for proteins, chEBI IDs for small molecules and EnsEMBL gene IDs for genes. Gene symbols may be used but will map to the gene plus corresponding transcripts and proteins.
Acknowledgement
Reactome is funded by The National Human Genome Research Institute at the National Institutes of Health [U41 HG003751]; the Ontario Research (GL2) fund; the European Bioinformatics Institute; the European Commission (PSIMEx); Google Summer of Code Program (2011–2013).
Footnotes
Internet Resources
BioPAX: Biological Pathways Exchange. Standardizing the file format for representing biological pathways.
The Reactome home page.
SBML: Systems Biology Markup Language. Standardizing the file format for representing models of biological pathways.
Literature Cited
- Haw R, Stein L. Using the Reactome Database. Curr. Protoc. Bioinform. 2012;38:8.7:8.7.1–8.7.23. doi: 10.1002/0471250953.bi0807s38. [DOI] [PMC free article] [PubMed] [Google Scholar]
- Jamison DC. Structured Query Language (SQL) Fundamentals. Curr. Protoc. Bioinform. 2003;00:9.2:9.2.1–9.2.29. doi: 10.1002/0471250953.bi0902s00. [DOI] [PubMed] [Google Scholar]


