

Abstract
Background and Aims The evolution of selfing is one of the most common transitions in flowering plants, and this change in mating pattern has important systematic and ecological consequences because it often initiates reproductive isolation and speciation. Petunia axillaris (Solanaceae) includes three allopatric subspecies widely distributed in temperate South America that present different degrees of self-compatibity and incompatibility. One of these subspecies is co-distributed with P. exserta in a restricted area and presents a complex, not well-understood mating system. Artificial crossing experiments suggest a complex system of mating in this sympatric area. The main aims of this study were to estimate the pollen dispersal distance and to evaluate the breeding structure of P. axillaris subsp. axillaris, a hawkmoth-pollinated taxon from this sympatric zone.
Methods Pollen dispersal distance was compared with nearest-neighbours distance, and the differentiation in the pollen pool among mother plants was estimated. In addition, the correlation between genetic differentiation and spatial distance among plants was tested. All adult individuals (252) within a space of 2800 m2 and 15 open-pollinated progeny (285 seedlings) were analysed. Genetic analyses were based on 12 polymorphic microsatellite loci.
Key Results A high proportion of self-pollination was found, indicating a mixed-mating system. The maximum pollen dispersal distance was 1013 m, but most pollination events (96 %) occurred at a distance of 0 m, predominantly in an inbreeding system. Both parents among sampled individuals could be identifed in 60–85 % of the progeny.
Conclusions The results show that most pollen dispersal in the hawkmoth-pollinated P. axillaris subsp. axillaris occurs within populations and there is a high proportion of inbreeding. This mating system appears to favour species integrity in a secondary contact zone with the congener species P. exserta.
Keywords: Pollen dispersal, breeding structure, Petunia axillaris, P. exserta, Solanaceae, Pampas, selfing, inbreeding, genetic structure, microsatellites, hawkmoth pollination, gene flow
INTRODUCTION
Among the numerous traits that influence life history, those that govern reproduction are particularly influential in facilitating adaptive radiation. Indeed, mating patterns affect key evolutionary processes, including genetic transmission, selection response, speciation and the evolutionary diversification of lineages (Barrett, 2013).
The evolution of selfing is one of the most common transitions in flowering plants (Stebbins, 1957; Baker, 1959); this change in mating pattern has importance in systematics and ecological consequences because the evolution of selfing often initiates the reproductive isolation and speciation (Baker, 1961; Barrett, 1989). The importance of mating system evolution in contributing to reproductive isolation between co-occurring species has recently received considerable attention (e.g. Fishman and Wyatt, 1999; Fishman, 2000; Lowe and Abbott, 2004; Martin and Willis, 2007; Ruhsam et al., 2011; Ruhsam, 2013; Brys et al., 2014).
Petunia axillaris (Solanaceae) is a historical parent of garden petunias (Sink, 1984), and this species is of particular interest in mating system studies because not all of its allopatric infraspecific taxa have the same status of self (in)-compatibility. Currently, three allopatric subspecies, P. axillaris subsp. axillaris, P. axillaris subsp. parodii (Cabrera, 1977) and P. axillaris subsp. subandina (Ando, 1996), are recognized (hereafter referred to only as axillaris, parodii and subandina subspecies). These subspecies occupy nearly adjacent territories (Ando, 1996) but are morphologically distinguishable from each other based on the size of the corolla limb, length of the corolla tube and condition of the stamen (Ando, 1996; Kokubun et al., 2006). These subspecies also present genetic differences (Turchetto et al., 2014a), and diversification between them can be associated with adaptive selection to ecological factors, such as pollinators and soil composition (Turchetto et al., 2014b). Although some Petunia species are narrowly endemic and are associated with specific phytoecological regions, the P. axillaris complex is widely distributed in temperate South America, occurring throughout the entire Pampas region. These P. axillaris populations usually form spatially distributed local patches in which several individuals grow together in a small area (Stehmann et al., 2009).
This species is the only one in the Petunia genus that has white flowers (Fig. 1) and is mainly pollinated by hawkmoths (Ando et al., 1995; Venail et al., 2010; Klahre et al., 2011). Autochory, seeds falling close to the mother plant (van der Pijl, 1982), is the rule in P. axillaris as well as in other Petunia species (Stehmann et al., 2009), and the plastid genome is maternally inherited (Derepas and Dulieu, 1992). Flowering usually occurs during the spring in the Southern Hemisphere (September–December).
Fig. 1.

(A) Schematic representation of the area studied showing ten towers and 23 populations. Each circle represents one population (number of individuals per population according to Table 1). Black circles are populations from which only adult individuals were collected. Coloured circles represent mother plants with the respective percentage of: selfing events (yellow); cross-pollination between individuals from the same population (green); cross-pollination between individuals from different populations (red); and non-attributed paternity considering a 95 % confidence interval (blue). (B) Landscape of the Serra do Sudeste/Guaritas region highlighting sandstone towers. The arrow represents the AB tower in (A). (C) Petunia axillaris subsp. axillaris corolla flower. (D) Petunia axillaris subsp. axillaris individual.
Previous studies have suggested that the parodii and subandina subspecies are self-compatible (SC) (Ando et al., 1998; Kokubun et al., 2006), whereas the axillaris subspecies presents a more complex and not completely understood reproductive system over its entire range of geographic distribution. Initially, this subspecies was described as self-incompatible (SI) (Ando, 1996), but further studies showed that some individuals are SC in some populations in Uruguay, Brazil and Argentina (Ando et al., 1998, 2001; Kokubun et al., 2006). Moreover, it is interesting that the few analysed populations in the distribution edges of this subspecies in Uruguay and in a sympatric region with P. exserta in Brazil present a high number of SC individuals (Kokubun et al., 2006).
The axillaris subspecies occurs in sympatry with P. exserta in a specific region in Brazil named Guaritas (Serra do Sudeste, Caçapava do Sul municipality, Rio Grande do Sul). The Guaritas region is characterized by the presence of sandstone towers on which the axillaris subspecies grows only in sunny patches of grasslands; P. exserta, an SC bird-pollinated species that presents red flowers, inhabits small caves inside the towers. Although natural hybridization has been described between these species (Lorenz-Lemke et al., 2006; Segatto et al., 2014), putative hybrids were observed only inside the caves, sharing the microenvironment with P. exserta.
Here, we evaluate the pollen dispersal distance and breeding structure in subspecies axillaris distributed in the Serra do Sudeste region. Our working hypothesis is that pollen dispersal follows the distribution of nearest neighbours due to vegetation patch distribution. We also hypothesize that P. axillaris has a high capacity for autonomous selfing that may function as a protective mechanism against heterospecific pollen deposition and hybrid seed formation with its sister species.
MATERIALS AND METHODS
Study site and sampling
We analysed 23 patches (hereafter called populations) of the Petunia axillaris subsp. axillaris from the Guaritas region distributed among ten towers (Fig. 1). Most of the towers present more than two different axillaris populations in different rock faces. We used a Global Positioning System (GPS) to obtain geographic co-ordinates for each population. The number of adult individuals in each population varied from one to 45 (Table 1).
Table 1.
Origin of the Petunia axillaris subsp. axillaris populations analysed in this study
| Population | Tower | n | Geographic co-ordinate |
|---|---|---|---|
| CO1 | CO | 1 | 30·83664115 °S, 53·50501430 °W |
| TO1 (2) | TO | 12 | 30·83749722 °S, 53·50689722 °W |
| TO2 | TO | 8 | 30·83765833 °S, 53·50696944 °W |
| TO3 | TO | 14 | 30·8372222 °S, 53·50666666 °W |
| GA1 (1) | GA | 8 | 30·83425414 °S, 53·50482285 °W |
| GA2 | GA | 29 | 30·83439161 °S, 53·50526207 °W |
| BO1 | BO | 8 | 30·83861181 °S, 53·50449571 °W |
| BO2 | BO | 5 | 30·83897022 °S, 53·50325862 °W |
| BO3 (1) | BO | 18 | 30·83972652 °S, 53·50529165 °W |
| BO4 | BO | 4 | 30·83823588 °S, 53·50266862 °W |
| AF1 | AF | 3 | 30·83102912 °S, 53·49563537 °W |
| AF2 | AF | 1 | 30·83228498 °S, 53·49622042 °W |
| PF1 | PF | 1 | 30·8328853 °S, 53·49840659 °W |
| PF2 (3) | PF | 25 | 30·83286132 °S, 53·49832789 °W |
| GR1 | GR | 8 | 30·83822624 °S, 53·49508392 °W |
| GR2 (1) | GR | 27 | 30·83837133 °S, 53·49511493 °W |
| ER1 (1) | ER | 4 | 30·83427677 °S, 53·50045136 °W |
| ER2 (3) | ER | 45 | 30·83429396 °S, 53·50020350 °W |
| GE1 | GE | 7 | 30·83037424 °S 53·50211609 °W |
| GE2 (2) | GE | 7 | 30·83078823 °S, 53·50228255 °W |
| GE3 | GE | 7 | 30·83218909 °S, 53·50368635 °W |
| GE4 (1) | GE | 5 | 30·83125305 °S, 53·50327682 °W |
| AB | AB | 5 | 30·83726434 °S, 53·49937655 °W |
| Total | 10 | 252 |
Populations in bold are those from which mother plants originated, with the number of mother plants collected per population in parentheses.
All adult individuals (252) of axillaris were mapped, and leaves were collected for DNA extraction. Fifteen individuals were randomly selected (Fig. 1) for sampling open-pollinated progeny arrays. We collected 1–3 fruits per mother plant and cultivated the seeds in a growth chamber with controlled temperature and luminosity. We collected 16–21 seedlings per mother plant, for a total of 285 seedlings. We used the CTAB (cetyltrimethylammonium bromide) protocol (Roy et al., 1992) to extract genomic DNA from all individuals (537 individuals including adults and seedlings).
Characterization of microsatellite loci
The adults and progeny were genotyped using 12 microsatellite loci named PM188, PM8, PM21, PM195, PM177, PM167, PM192, PM173, PM88, PM191, PM101 and PM184 (Bossolini et al., 2011). The polymerase chain reactions (PCRs) were conducted in a final volume of 10 µL containing approx. 10 ng of genomic DNA as template, 200 µm of each dNTP (Invitrogen, Carlsbad, CA, USA), 1·7 pmol of each fluorescently labelled M13(–21) primer, 3·5 pmol of reverse primer, 0·35 pmol of forward primer with a 5′-M13(–21) tail, 2·0 mm MgCl2 (Invitrogen), 0·5 U of Platinum Taq DNA polymerase (Invitrogen) and 1× Platinum Taq reaction buffer (Invitrogen). The PCR conditions were as follow: an initial denaturation at 96 °C for 3 min; 32 cycles of 96 °C for 15 s, 50–52 °C for 30 s and 72 °C for 1 min; and a final extension cycle at 72 °C for 7 min. The forward primers were FAM, NED, or HEX labelled. The DNA fragments were denatured and size-fractionated using capillary electrophoresis on a MegaBACE 1000 automated sequencer (GE Healthcare Biosciences, Pittsburgh, PA, USA) with a GeneTab-500 internal size ladder (GE Healthcare). The manufacturer’s software was used to determine the alleles. The primer sequences, repeat motif, fragment size range and chromosome localization are described in Bossolini et al. (2011) and are available at the website http://www.botany.unibe.ch/deve/caps/ssrlist.html.
We used Micro-Checker software (Oosterhout et al., 2004; http://www.microchecker.hull.ac.uk/) to estimate genotyping errors due to stutter bands, allele dropout and null alleles, and FSTAT 2.9.3.2 software (Goudet, 2002; http://www2.unil.ch/popgen/softwares/fstat.htm) to obtain the number of alleles per locus and inbreeding coefficient (FIS). We obtained the observed (HO) and expected (HE) heterozygosity under Hardy–Weinberg equilibrium (after Bonferroni’s correction), as performed in ARLEQUIN 3.5.1.2 software (Excoffier and Lischer, 2010), and also tested for deviation from linkage equilibrium for all loci (Goudet et al., 1996) with Bonferroni’s correction. All these analyses and estimates were performed considering all 252 adult individuals. In addition, these same summary statistics were also performed in ARLEQUIN and FSTAT for each one of the 23 sampled populations.
Genetic identity (I; Chakravaratt and Li, 1983) and paternity exclusion (Q; Weir, 1996) probabilities were estimated for each locus, and paternity exclusion {QC 1/4 1[P(1Q i)]} and genetic identity (IC 1/4 PI i) combined probabilities were estimated for the overall loci using the IDENTITY 1.0 software (Wagner and Sefc, 1999).
Population structure
We evaluated the population structure based on the 252 adult individuals sampled in Guaritas. We implemented analyses of molecular variance (AMOVA; Excoffier et al., 1992) in ARLEQUIN among the 23 populations and among the ten towers, and computed the pairwise estimators of FST between the pairs of population or towers to measure the level of differentiation between them. The significance was tested using 10 000 permutations. We also used a Bayesian clustering approach, as implemented in STRUCTURE 2.3 (Pritchard et al., 2000), to infer the population structure of adult individuals. The number of groups (K) was evaluated from 1 to 26, with ten independent runs per K-value. Each run was performed using 2·5 × 105 burn-in periods and 106 Markov chain Monte Carlo (MCMC) repetitions after burn-in was used for population clustering without prior information under an admixture model and assuming correlated allele frequencies (Falush et al., 2003). The optimal K-value was identified using the maximum value of ΔK (Evanno et al., 2005), as implemented in STRUCTURE HARVESTER 0.6.93 (Earl and von Holdt, 2012). We used CLUMPP 1.1.2 to summarize the results of the optimal K-value based on the pairwise similarity average of individual assignments across runs using Greedy’s method and the G' statistic (Jakobsson and Rosenberg, 2007). We used the DISTRUCT 1.1 program (Rosenberg, 2004) to visualize the STRUCTURE results after processing with CLUMPP.
To verify whether there are significant correlations between FST and geographical distance, we performed a Mantel test between the pairwise FST and spatial distance among the 23 populations as well among as the ten towers.
Breeding structure and pollen dispersal
Fifteen open-pollinated progenies were analysed, with 16–21 individuals per mother plant, for a total of 285 seedlings. Before performing paternity analyses, mismatching between the mother plant and each offspring was visually inspected. All genotyped individuals were included because we did not find exclusion of any mother.
We used the genotypes of the progeny arrays to estimate mating system parameters in the software MLTR 3.4 (Ritland, 2002, 2004). We used all sampled families under the mixed mating model of Ritland and Jain (1981) and Ritland (1989) and all 12 loci in the analysis. We also calculated multilocus (tm) and single locus (ts) outcrossing rates. The difference tm − ts can be used to estimate biparental inbreeding (Ritland, 2002); under biparental inbreeding, the magnitude of the difference tm − ts should be positive, as single locus estimates of outcrossing rates will include apparent selfing due to mating between relatives. We also calculated the correlation of paternity estimated for a single locus (rps) or multiple loci (rpm); the difference rps − rpm can be employed to indicate whether outcrossed mating within a progeny array occurs between related males. The correlation of selfing among families (rs) was also estimated. For instance, a positive rps − rpm may occur when the population sub-structure results in genetic similarity among male parents, whereas a negative value indicates biparental inbreeding (Ritland, 2002). All parameters of the model were estimated via the Expectation–Maximization method, and the pollen allele frequencies were assumed to be equivalent to those of the ovules. The results were subjected to 1000 bootstraps using families as the resampling unit to assess significance using 95 % confidence intervals.
To identify the most likely pollen donor and to determine the mating structure and pollen dispersal distance, we used the paternity assignment test approach (Marshall et al., 1998). The assignment test was performed using the maximum likelihood-based method implemented in CERVUS 3.0.6 software (Kalinowski et al., 2007; http://helios.bto.ed.ac.uk/evolgen). The results were based on the multilocus genotypes of 285 seedlings and 252 reproductive individuals of the 23 populations. The most likely parents and parent pairs were determined by the Δ statistic (Marshall et al., 1998) using the allele frequencies of the adults as a reference. The significance of Δ (critical Δ) was determined through paternity tests simulated in CERVUS. An individual with the highest calculated Δ value was accepted as the father of a seed if the difference between its LOD score (logarithm of likelihood ratios) and the second most likely candidate’s LOD score was greater than the critical Δ. We used the following parameters for simulations: 10 000 repetitions; 0·9262 proportion of loci; 95 % (strict) and 85 % (relaxed) confidence levels; and 252 sampled individuals (all adult individuals in the plot) as pollen donor candidates for each mother plant. We considered 90 % of the parents in the area to be sampled and 1 % genotyping error. The pollen dispersal distance was obtained based on the pairwise distance between mother plant and pollen donator estimated using the geographic co-ordinates of each patch. The mean and variance of distance of pollen dispersal were generated, and the effective distance of pollen dispersal was compared with the distance among all adult individuals using the Kolmogorov–Smirnov test (Sokal and Rohlf, 1995).
In addition, to estimate the differentiation of allele frequencies among the sampled pollen pool by mother plants in the populations (ΦFT; Austerlitz and Smouse, 2001, 2002) and the effective pollen donor density (de), we used TWOGENER software (Austerlitz and Smouse, 2001, 2002) as part of the POLDIST package (Robledo-Arnuncio et al., 2007). Due to missing data for the mother plants, only ten loci were used in these analyses. A Mantel test was performed between the pairwise ΦFT and spatial distance matrices to test the hypothesis of differentiation increasing with distance. All Mantel tests were performed using the software SAM 4.0 (Rangel et al., 2010).
Spatial genetic structure
Spatial genetic structure in P. axillaris populations was evaluated by a spatial autocorrelation analysis performed to verify kinship structure in all adult individuals and estimate seed dispersal using the Nason estimator Fij (Loiselle et al., 1995). We computed Fij values between all pairs of adult individuals using SPAGeDI 1.2 (Hardy and Vekemans, 2002), and these values were regressed onto the natural logarithm of the spatial distance between individuals to test for kinship structure. The multilocus Fij average was computed for ten distance classes that were defined to keep the number of pairwise comparisons within each distance interval approximately constant. Permutation tests (10 000 permutations) were used to verify the deviation of the observed kinship for each distance class from the null expectation and of regression. Standard errors (s.e.) over loci were estimated by Jackknife.
The strength of the spatial genetic structure was quantified using the parameter Sp = b/(F1 – 1), where F1 is the average kinship coefficient among individuals of the first distance class and b is the slope of the regression (for details, see Vekemans and Hardy, 2004).
RESULTS
Characterization of microsatellite loci
The characterization of loci was based on adult individuals. All pairs of loci were in linkage equilibrium (almost all P < 0·001, Bonferroni’s adjusted value for a nominal level of 5 %), and most of the 12 microsatellite loci displayed high levels of polymorphism and diversity. We detected 119 alleles among the adult individuals (Table 2). For all loci, the observed heterozygosity (HO) was lower than the expected (HE), showing a deficit of heterozygotes in relation to the Hardy–Weinberg principle (P < 0·005). For all loci, the inbreeding coefficient (FIS) was positive but not significant (Table 2). Nevertheless, the high combined paternity exclusion probability (QC = 0·9997) and the low combined probability of identity (IC = 1·6 × 10–11) showed that this locus set is suitable for parentage analyses (Table 2). When we performed this same analysis on the 23 populations, we observed that only some loci and populations were not under Hardy–Weinberg equilibrium, showing a deficit of heterozygotes. Similarly, the inbreeding coefficient results for the populations showed positive but not significant values (see Supplementary Data Table S1).
Table 2.
Characterization of 12 microsatellite loci of Petunia axillaris subsp. axillaris based on 252 adult individuals sampled in the Guaritas region, Serra do Sudeste, Rio Grande do Sul/Brazil
| Locus | A | HE | HO | FIS | Q | I |
|---|---|---|---|---|---|---|
| PM188 | 9 | 0·787 | 0·484 | 0·385 | 0·602 | 0·070 |
| PM8 | 6 | 0·573 | 0·312 | 0·456 | 0·353 | 0·220 |
| PM21 | 7 | 0·611 | 0·313 | 0·487 | 0·341 | 0·222 |
| PM195 | 7 | 0·543 | 0·236 | 0·566 | 0·270 | 0·290 |
| PM177 | 24 | 0·906 | 0·402 | 0·556 | 0·812 | 0·015 |
| PM167 | 11 | 0·816 | 0·520 | 0·363 | 0·649 | 0·054 |
| PM192 | 12 | 0·767 | 0·425 | 0·447 | 0·579 | 0·080 |
| PM173 | 17 | 0·557 | 0·321 | 0·424 | 0·363 | 0·219 |
| PM88 | 10 | 0·582 | 0·183 | 0·686 | 0·374 | 0·205 |
| PM191 | 6 | 0·590 | 0·322 | 0·455 | 0·360 | 0·209 |
| PM101 | 6 | 0·756 | 0·394 | 0·479 | 0·535 | 0·098 |
| PM184 | 4 | 0·599 | 0·164 | 0·726 | 0·309 | 0·244 |
| Overall | 0·6739 | 0·496 | QC = 0·9997 | IC = 1·564 × 10–11 |
A, number of alleles; FIS, inbreeding coefficient (all values were not significant, P > 0·004, Bonferroni’s adjusted P-value for a nominal level of 5 %); HE, expected heterozygosity; HO, observed heterozygosity (all values were significant, P < 0·005, Bonferroni’s adjusted P-value for a nominal level of 5 %); I, probability of genetic identity; IC, combined probability of genetic identity; Q, probability of paternity exclusion; QC, combined probability of paternity exclusion.
Population structure
The AMOVA analysis revealed that 17 % of the genetic variation (P < 0·001) was distributed among the 23 populations, whereas 83 % (P < 0·001) was within the populations. When we considered each tower, the AMOVA analysis also showed the highest fraction of genetic variation within populations (82 %; P < 0·001) rather than among towers (3·5 %; P < 0·001). We also measured the level of differentiation among the 23 populations by considering adult individuals computing pairwise estimators of FST. The FST values showed significant differentiation for most comparisons (Supplementary Data Table S2). Note that the highest FST value was found in the comparisons between BO3 vs. GA1 (0·376) and BO3 vs. PF2 (0·303); these three populations grow on the top of three different towers (Fig. 1).
A Mantel test based on correlations between FST values and geographic distances showed no significant values when we considered all 23 populations (R2 = 0·003; P = 0·30) or when each tower was considered as a population (R2 = 0·022; P > 0·50).
In the Bayesian clustering approach to infer the adult individual population structure, we observed that the best inferred number of clusters was K = 3 (Fig. 2). We also observed that the majority of individuals of each population and the majority of populations of each tower were grouped preferentially in one or another cluster (e.g. CO, TO and GA towers in the blue cluster; AF, PF and GR towers in the yellow cluster; ER, AB and GE towers in the orange cluster; Figs 1 and 2). However, a few individuals in some populations appeared as migrants from other populations, even in more distant towers.
Fig. 2.

STRUCTURE bar plot under an admixture coefficients model based on 12 microsatellite loci and 23 populations of Petunia axillaris subsp. axillaris. Bars represent individuals, and black vertical lines represent each population; different colours indicate K = 3 genetic components representing individual membership of one of the genetic clusters.
Breeding structure and pollen dispersal
The mating parameters estimated by the MLTR analysis are summarized in Table 3. The multilocus estimates of outcrossing rates (tm) were 0·619 (± 0·069). However, the single locus estimates of outcrossing rates (ts) were somewhat lower, 0·222 (± 0·033), and hence the difference between tm and ts was 0·397 (± 0·0549). The latter relatively high values of tm − ts may have been influenced by consanguineous mating, indicating biparental inbreeding. The negative value of rps – rpm (Table 3) also indicated biparental inbreeding. The high multilocus correlation of paternity was in agreement with CERVUS results (60 % of the offspring were assigned with only one father candidate) and indicates that most progeny were full sibs (Table 3). The correlation of selfing among families (rs) was 0·386 (± 0·067), and this value indicates that the events of fertilization are not structured among families.
Table 3.
Inbreeding and mating system parameters of Petunia axillaris subsp. axillaris estimated from 15 families by MLTR analysis
| Parameters | Estimate (s.d.) |
|---|---|
| Parental F | 0·141 (0·049) |
| Multilocus t (tm) | 0·619 (0·069) |
| Single locus (ts) | 0·222 (0·033) |
| Difference (tm – ts) | 0·397 (0·055) |
| Correlation of paternity singlelocus (rps) | 0·237 (0·096) |
| Correlation of paternity multilocus (rpm) | 0·907 (0·070) |
| Difference (rps – rpm) | –1·906 (0·076) |
| Correlation of selfing among families (rs) | 0·386 (0·067) |
In the paternity assignment analysis, when we considered the strict confidence interval (95 %, critical value Δ = 2·04), 60 % of the offspring were assigned with only one father candidate from the sampled individuals. This percentage was increased to 85 % when we considered the relaxed confidence interval (85 %, critical value Δ = 0·18). However, paternity was still unknown for 15 % of the progeny when considering all adults sampled in Guaritas. The proportion of self-pollination was higher than outcrossing, with only 13 % of progeny assigned as a result of outcrossing with a strict confidence interval and 21 % when the relaxed confidence interval was considered.
The greatest pollen dispersion distance observed was 1013 m between towers BO3 and PF2, with both populations located on the top of the towers.
The distance among the distribution of adult individuals was significantly different from the distribution of the pollen dispersal distance (Kolmogorov–Smirnov test, P < 0·001). The mean distance among adult individuals was 649·41 m (s.d. = 271·07 m), and most individuals (73 %) were at a distance of <700 m from each other. The mean pollen dispersal distance was 27·46 m (s.d. = 141·34), and most pollen dispersal (96 %) occurred at a distance of 0 m (Fig. 3).
Fig. 3.
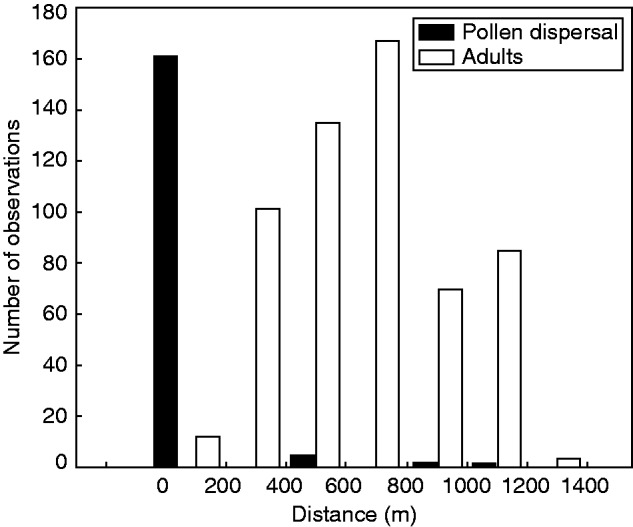
Pairwise distance distribution of individual adults (white bars, right scale) and pollen dispersal distribution based on the distance between each pollen donor assigned by CERVUS (black bars, left scale).
A high differentiation in the pollen pool received by each mother plant was observed: the pairwise ΦFT ranged from 0·136 to 0·681, and the global ΦFT was 0·434 (according to TWOGENER results). However, a Mantel test showed no significant correlation between the pollen pool of mother plants and the pairwise spatial distance (R2 = 0·037; P = 0·296). The effective pollen donor density (de) was 0·00153 m–2.
Spatial genetic structure
An autocorrelation analysis showed a cline pattern with a significant spatial autocorrelation up to 400 m (P < 0·001). Kinship coefficients were slightly related to the logarithm of the distance class (b = –0·0321; R2 = 0·0354; P < 0·001; Fig. 4). The spatial genetic structure (Sp) was 0·037.
Fig. 4.

Relationship between kinship (Fij) and distance classes of adult individuals of Petunia axillaris subsp. axillaris with the respective 95 % confidence intervals.
DISCUSSION
The genetic diversity structure and distribution found within and among populations is primarily affected by gene flow (Wright, 1940; Slatkin, 1985). In animal-pollinated species, pollen presentation and behavioural differences of pollinators and their geographic dispersion capacity determine pollen carryover and thus the distances over which the pollen is dispersed (Barrett and Harder, 1996; Barrett, 2003). Ecological factors such as population spatial distribution, density and flowering phenology may also affect the foraging behaviour of pollinators and, in turn, the distance of pollen dispersal (Handel, 1983; Ghazoul, 2005). In mass-flowering species, with a high synchrony of flowering in neighbouring plants, the pollen dispersal distance may be shorter because of the high proportion of pollination among neighbours, but the asynchrony of flowering of neighbouring plants may result in a longer distance of pollen dispersal (Augspurger, 1980; White and Boshier, 2000). Furthermore, species with limited dispersal and spatially structured populations may have reduced genetic neighbourhoods, implying an increase in mating between relatives (e.g. Carrillo-Angeles et al., 2011).
This study was conducted in 23 populations of the P. axillaris subsp. axillaris from Serra do Sudeste, belonging to the Pampas region. The vegetation structure in the Pampas is very diverse as a consequence of several factors such as climate, soil and topography, which are variable across the region, and due to anthropic vegetation management (Boldrini, 2009).
Rambo (1956) stated that it was not be possible to make a detailed description of all landscapes from Serra do Sudeste, which often diverge from the rest of the Pampa by presenting a savannah vegetation (trees and shrubs) on shallow soils. The region has undulations ranging from 150 to 500 m, and it is characterized by the presence of sandstone towers in an approx. 30 km2 region called Guaritas. Interestingly, in this region, the axillaris subspecies only grows in patches of grasslands on the towers and does not occur among towers (Fig. 1). The individuals are found in relatively large spots made up of several individuals, and this spatial arrangement could be responsible for the major proportion of cross-pollination that has been found between individuals from the same population, with an overall low pollen dispersal distance (96 %). Selfing individuals often live in different environments compared with their outcrossing progenitors. This observation is usually interpreted as being a function of invasion demography. As only a few individuals establish in new habitats, selfing or biparental inbreeding is initially a necessity (Kamran-Disfani and Agrawal, 2014). In the case of the axillaris subspecies, this could be due to a combination of the patchy occurrence of suitable habitats and limited seed dispersal, resulting in the clustering of related individuals because Serra do Sudeste may be considered as a secondary colonization event in the Petunia genus (Reck-Kortmann et al., 2014).
Our results showed a mixed mating system for the axillaris subspecies, with a high proportion of SC in all analysed populations. Moreover, we observed that most cross-pollination occurs within patches (tm − ts = 0·397), suggesting biparental inbreeding, a result in accordance with the population genetic structure observed in adult individuals (Fig. 2). This preferential selfing status suggests a more complex or flexible mating system for this subspecies than previously proposed (Ando et al., 1998; Kokubun et al., 2006). When pollen dispersal occurs between patches, it can be at long distances (at least 1063 m). However, most pollination events occurred at distances of 0 m. Gleiser et al. (2014) analysed one population of the axillaris subspecies from Uruguay, revealing that individuals were strictly outcrossing, with the most successful pollination occurring preferentially among neighbours.
In our study, when cross-pollination involved individuals from different populations, it occurred in populations at the top of the towers. On the top of towers, we found the majority of the 15 % individuals to which we could not assign a father among the sampled adult individuals. Due to the longer distance pollen dispersal found among these towers and their spatial distribution (in the periphery of the sampled area), a plausible explanation for this lack of assignment is the occurrence of gene flow at a greater distance than expected in this study. This is congruent with the MLTR results, which showed a higher proportion of cross-pollination (60 %) than paternity assignment estimated in the CERVUS analysis.
The flowers of P. axillaris present characteristics that suggest that they are preferentially hawkmoth pollinated (Ando et al., 2001; Hoballah et al., 2005), though several other floral visitors were found that could also act as effective pollinators for this species (Hoballah et al., 2007; Dell’Olivo et al., 2011). Moreover, hawkmoths are powerful flyers and have the ability to disperse broadly and visit widely spaced plants, with some being recaptured in mark–release studies (Powell and Brown, 1990) at several kilometres from the site of origin. Combined with their learning behaviour, hawkmoth pollinators can enhance gene flow between fragmented populations of specialized plants (Martins and Johnson, 2007, 2009, 2013).
The axillaris subspecies is primarily SI. Ando et al. (1998) surveyed >100 natural populations from Uruguay and found that most of them were composed of virtually all SI individuals. Only a few populations encompassed some SC individuals in addition to the prevalent SI ones, and these populations were referred to as mixed populations. Tsukamoto et al. (1999) studied the cause of breakdown of self-incompatibility in these individuals from Uruguay and showed that an S-haplotype carried by three SC individuals was not functional in the style but was functional in the pollen. Tsukamoto et al. (2003) later suggested that a modifier locus, unlinked to the S-locus, specifically suppresses the expression of an S-RNase gene in the same three SC plants, explaining the reduced self-incompatibility.
The evolution of self-compatibility due to the loss of self-incompatibility is regarded as one of the most frequent transitions in flowering plants and is influenced by biotic or abiotic factors that affect seed and pollen dispersal, resulting in the rise of sub-population structures (Griffin and Eckert, 2003). In this study, we found high self-pollination in all the axillaris subspecies populations. Our findings may also be related to the scenarios of speciation between P. axillaris and its sister species P. exserta, for which natural hybridization events have been suggested (Lorenz-Lemke et al., 2006; Segatto et al., 2014). The transition to selfing in P. axillaris in the Guaritas region may constitute a reproductive barrier that is primarily responsible for preventing hybridization (pre-zygotic barrier) with P. exserta. Moreover, the characteristics of P. axillaris floral display (positional proximity between anthers and stigma) can result in a higher capacity for autonomous selfing, which could function as an efficient barrier to counterbalance the higher risk for interspecific hybrid mating.
Transitions in plant reproductive systems involve changes in reproductive traits driven largely by natural selection. The traits initially appear within populations and, if adaptive, can spread to survive numerous speciation events and ultimately characterize entire lineages, as with wind pollination evolution (Friedman and Barrett, 2008). Alternatively, some transitions appear repeatedly but are ephemeral (Igic and Busch, 2013). Populations with mixed mating often possess standing genetic variation for traits promoting outcrossing, for example herkogamy, the spatial separation of anthers and stigmas (Shore and Barrett, 1990); however, there is no evidence that they exhibit reduced inbreeding depression compared with predominantly outcrossing species (Winn et al., 2011).
Differences in mating systems between co-occurring plant species can be expected to shape pre-zygotic barriers and therefore have important effects on the direction of heterospecific pollen flow and the extent of hybridization (Brys et al., 2014). For instance, Lowe and Abbott (2004) reported in two recently divergent species of Senecio that the predominant self-fertilization in S. eboracensis contributed to strong reproductive isolation and ecological differentiation. Martin and Willis (2007) also showed that in Mimulus nasutus almost exclusive autogamy offered nearly complete isolation from its close relative M. guttatus when growing in sympatry. However, Coyne and Orr (2004) argued that exclusive autogamy differs profoundly from other isolating barriers and is in fact not an isolating barrier because gene flow between individuals of different taxa is as much impeded as gene flow between individuals of the same taxon. In many cases, however, plants are neither exclusive selfers nor obligate outcrossers but show a breeding system that represents an intermediate form between both extremes, so-called mixed-mating species (Goodwillie et al., 2005). This may be the situation for P. axillaris from Serra do Sudeste because a previous study demonstrated under experimental conditions that all Petunia species preserve intercrossing ability (Watanabe et al., 2001). However, hybrids in nature are rare, despite the lack of intrinsic barriers to crossing in most of these species (Ando et al., 2001; Dell’Olivio et al., 2011).
The finding of low autocorrelation values confirmed previous observations that seed dispersal is restricted and that most siblings grow near the mother plant, with ΦFT showing positive and significant values of kinship in the first distance class quickly decreasing after 0 m. Similar values of genetic spatial structure, measured by the statistic Sp, have been observed for other herbaceous species and for species with gravity-dispersed seeds (Vekemans and Hardy, 2004).
In conclusion, our results showed that the hawkmoth-pollinated axillaris subspecies is capable of long-distance pollen dispersal, but most dispersal occurs within populations and a high proportion of inbreeding is observed. A high proportion of self-fertilization occurs in the Serra do Sudeste region sympatric area where the axillaris subspecies occurs with its sister species P. exserta.
SUPPLEMENTARY DATA
Supplementary data are available online at www.aob.oxfordjournals.org and consist of the following. Table S1: parameters of genetic diversity per locus per population. Table S2: pairwise FST among 23 populations analysed in this study.
ACKNOWLEDGEMENTS
We thank A.L.A. Segatto, J.N. Fregonezi, G. Mäder and C. Kuhlemeier for help during field collection. We are grateful to the Handling Editor and two anonymous reviewers for comments and suggestions that improved our manuscript. This work was supported by the Conselho Nacional de Desenvolvimento Científico e Tecnológico (CNPq), Coordenação de Aperfeiçoamento de Pessoal de Nível Superior (CAPES) and Programa de Pós Graduação em Genética e Biologia Molecular da Universidade Federal do Rio Grande do Sul (PPGBM-UFRGS).
LITERATURE CITED
- Ando T. 1996. Distribution of Petunia axillaris (Solanaceae) and its new subspecies in Argentina and Bolivia. Acta Phytotaxonomica et Geobotanica 47: 19–30. [Google Scholar]
- Ando T, Lida S, Kokubun H, Ueda Y, Marchesi E. 1995. Distribution of Petunia axillaris sensu lato in Uruguay as revealed by discriminant analysis of the live plants. Journal of the Japanese Society for Horticultural Science 64: 381–391. [Google Scholar]
- Ando T, Tsukamoto T, Akiba N, et al. 1998. Differentiation in the degree of self-incompatibility in Petunia axillaris (Solanaceae) occurring in Uruguay. Acta Phytotaxonomica et Geobotanica 49: 37–47. [Google Scholar]
- Ando T, Nomura M, Tsukahara J, et al. 2001. Reproductive isolation in a native population of Petunia sensu Jussieu (Solanaceae). Annals of Botany 88: 403–413. [Google Scholar]
- Augspurger CK. 1980. Mass-flowering of a tropical shrub (Hybanthus prunifolius): influence on pollinator attraction and movement. Evolution 34: 475–488 [DOI] [PubMed] [Google Scholar]
- Austerlitz F, Smouse PE. 2001. Two-generation analysis of pollen flow across a landscape. II. Relation between ΦFT, pollen dispersal and inter-females distance. Genetics 157: 851–857. [DOI] [PMC free article] [PubMed] [Google Scholar]
- Austerlitz F, Smouse PE. 2002. Two-generation analysis of pollen flow across a landscape. IV. Estimating the dispersal parameter. Genetics 161: 355–363. [DOI] [PMC free article] [PubMed] [Google Scholar]
- Baker HG. 1959. Reproductive methods as factors in speciation in flowering plants. Cold Spring Harbor Symposia on Quantitative Biology 24: 177–191. [DOI] [PubMed] [Google Scholar]
- Baker HG. 1961. Rapid speciation in relation to changes in the breeding system of plants. In: Recent advances in botany. Toronto: University of Toronto Press, 881–885. [Google Scholar]
- Barrett SCH. 1989. Mating system evolution and speciation in heterostylous plants. In: Otte D, Endler J, eds. Speciation and its consequences. Sunderland, MA: Sinauer Associates, 257––283.. [Google Scholar]
- Barrett SCH. 2003. Mating strategies in flowering plants: the outcrossing–selfing paradigm and beyond. Philosophical Transactions of the Royal Society B: Biologial Sciences 358: 991–1004. [DOI] [PMC free article] [PubMed] [Google Scholar]
- Barrett SCH. 2013. The evolution of plant reproductive systems: how often are transitions irreversible? Proceedings of the Royal Society B: Biological Sciences 280: 1765. [DOI] [PMC free article] [PubMed] [Google Scholar]
- Barrett SCH, Harder LD. 1996. Ecology and evolution of plant mating. Trends in Ecology and Evolution 11: 73–79. [DOI] [PubMed] [Google Scholar]
- Boldrini II. 2009. A flora dos Campos do Rio Grande do Sul. In: Pillar V, Müller SC, Castilhos ZMS, Jacques AVA, eds. Campos Sulinos – conservação e uso sustentável da biodiversidade. Brasília: Ministério do Meio Ambiente, 63–77. [Google Scholar]
- Bossolini E, Klahre U, Brandenburg A, Reinhardt D, Kuhlemeier C. 2011. High-resolution linkage maps of the model organism Petunia reveal substantial synteny decay with the related genome of tomato. Genome 54: 327–340. [DOI] [PubMed] [Google Scholar]
- Brys R, Broeck AV, Mergeay J, Jacquemyn H. 2014. The contribution of mating system variation to reproductive isolation in two closely related Centaurium species (Gentianaceae) with a generalized flower morphology. Evolution 68: 1281–1293. [DOI] [PubMed] [Google Scholar]
- Cabrera AL. 1977. Novedades en las Solanaceas de Entre Rios. Hickenia 14: 79–81. [Google Scholar]
- Carrillo-Angeles IG, Mandujano MC, Golubov J. 2011. Influences of the genetic neighborhood on ramet reproductive success in a clonal desert cactus. Population Ecology 53: 449–458. [Google Scholar]
- Chakravaratt I, Li CC. 1983. The effect of linkage on paternity calculations. In: Walkera RH, ed. Inclusion probabilities in parentage testing . Arlington, VA: American Association of Blood Banks, 411–420. [Google Scholar]
- Coyne JA, Orr HA. 2004. Speciation. Sunderland, MA: Sinauer Associations. [Google Scholar]
- Dell’Olivo, Hoballah AME, Gübitz T, Kuhlemeier C. 2011. Isolation barriers between Petunia axillaris and Petunia integrifolia (Solanaceae). Evolution 65: 1979–1991. [DOI] [PubMed] [Google Scholar]
- Derepas A, Dulieu H. 1992. Inheritance of the capacity to transfer plastids by pollen parent in Petunia hybrida Hort . Journal of Heredity 83: 6–10. [Google Scholar]
- Earl EA, von Holdt BM. 2012. Structure Harvester: a website and program for visualizing Structure output and implementing the Evanno method. Conservation Genetics Resources 4: 359–361. [Google Scholar]
- Evanno G, Regnaut S, Goudet J. 2005. Detecting the number of clusters of individuals using the software STRUCTURE: a simulation study. Molecular Ecology 14: 2611–2620. [DOI] [PubMed] [Google Scholar]
- Excoffier L, Lischer HEL. 2010. Arlequin suite ver. 3.5: a new series of programs to perform population genetics analyses under Linux and Windows. Molecular Ecology Resources 10: 564–567. [DOI] [PubMed] [Google Scholar]
- Excoffier L, Smouse PE, Quattro J. 1992. Analysis of molecular variance inferred from metric distances among DNA haplotypes: application to human mitochondrial DNA restriction data. Genetics 131: 479–491. [DOI] [PMC free article] [PubMed] [Google Scholar]
- Falush D, Tephens MS, Pritchard JK. 2003. Inference of population structure using multilocus genotype data: linked loci and correlated allele frequencies. Genetics 164: 1567–1587. [DOI] [PMC free article] [PubMed] [Google Scholar]
- Fishman L. 2000. Pollen discounting and the evolution of selfing in Arenaria uniflora (Caryophyllaceae). Evolution 54: 1558–1565. [DOI] [PubMed] [Google Scholar]
- Fishman L, Wyatt R. 1999. Pollinator-mediated competition, reproductive character displacement, and the evolution of selfing in Arenaria uniflora (Caryophyllaceae). Evolution 53: 1723–1733. [DOI] [PubMed] [Google Scholar]
- Friedman J, Barrett SCH. 2008. Wind of change: new insights on the ecology and evolution of pollination and mating in wind-pollinated plants. Annals of Botany 103: 1515–1527. [DOI] [PMC free article] [PubMed] [Google Scholar]
- Ghazoul J. 2005. Pollen and seed dispersal among dispersed plants. Biological Review 80: 413–443. [DOI] [PubMed] [Google Scholar]
- Gleiser G, Internicola AI, Austerlitz F, Bernasconi G. 2014. Stabilizing selection on nectar concentration in wild Petunia axillaris, as revealed by genetic analysis of pollen dispersal. Evolutionary Ecology 28: 869–884. [Google Scholar]
- Goodwillie C, Kalisz S, Eckert CG. 2005. The evolutionary enigma of mixed mating systems in plants: occurrence, theoretical explanations, and empirical evidence. Annual Review of Ecology, Evolution and Systematics 36: 47–79. [Google Scholar]
- Goudet J. 2002. FSTAT, a program to estimate and test gene diversities and fixation indices. Available free from http://www2.unil.ch/popgen/softwares/fstat.htm. [Google Scholar]
- Goudet J, Raymond M, Demeeüs T, Rousset F. 1996. Testing genetic differentiation in diploid populations. Genetics 144: 1933–1940. [DOI] [PMC free article] [PubMed] [Google Scholar]
- Griffin CAM, Eckert CG. 2003. Experimental analysis of biparental inbreeding in a self-fertilizing plant. Evolution 57: 1513–1519. [DOI] [PubMed] [Google Scholar]
- Handel SN. 1983. Pollination ecology, plant population structure and gene flow. In: Real L, ed. Pollination biology. Orlando: Academic Press; 163–212. [Google Scholar]
- Hardy OJ, Vekemans X. 2002. SPAGeDi: a versatile compute program to analyze spatial genetic structure at the individual or population levels. Molecular Ecology Notes 2: 618. [Google Scholar]
- Hoballah ME, Stuurman J, Turlings TCJ, Guerin PM, Connétable S, Kuhlemeier C. 2005. The composition and timing of flower odour emission by wild Petunia axillaris coincide with the antennal perception and nocturnal activity of the pollinator Manduca sexta . Planta 222: 141–150. [DOI] [PubMed] [Google Scholar]
- Hobbalah ME, Gübitz T, Stuurman J, et al. 2007. Single gene-mediated shift in pollinator attraction in Petunia. The Plant Cell 19: 779–790. [DOI] [PMC free article] [PubMed] [Google Scholar]
- Igic B, Busch JW. 2013. Is self-fertilization an evolutionary dead end? New Phytologist 198: 386–397. [DOI] [PubMed] [Google Scholar]
- Jakobsson M, Rosenberg NA. 2007. CLUMPP: a cluster matching and permutation program for dealing with label switching and multimodality in analysis of population structure. Bioinformatics 23: 1801–1806. [DOI] [PubMed] [Google Scholar]
- Kalinowski ST, Taper ML, Marshall TC. 2007. Revising how the computer program CERVUS accommodates genotyping error increases success in paternity assignment. Molecular Ecology 16: 1099–1106. [DOI] [PubMed] [Google Scholar]
- Kamran-Disfani A, Agrawal AF. 2014. Selfing, adaptation and background selection in finite populations. Journal of Evolutionary Biology 27: 1360–1371. [DOI] [PubMed] [Google Scholar]
- Klahre U, Gurba A, Hermann K, et al. 2011. Pollinator choice in Petunia depends on two major genetic loci for floral scent production. Current Biology 21: 1–10. [DOI] [PubMed] [Google Scholar]
- Kokubun H, Nakano M, Tsukamoto T, et al. 2006. Distribution of self-compatible and self-incompatible populations of Petunia axillaris (Solanaceae) outside Uruguay. Journal of Plant Research 119: 419–430. [DOI] [PubMed] [Google Scholar]
- Loiselle BA, Sork VL, Nason J, Graham C. 1995. Spatial genetic structure of a tropical understory shrub, Psychotria officinalis (Rubiaceae). American Journal of Botany 82: 1420–1425. [Google Scholar]
- Lorenz-Lemke AP, Mäder G, Muschner VC, et al. 2006. Diversity and natural hybridization in a highly endemic species of Petunia (Solanaceae): a molecular and ecological analysis. Molecular Ecology 15: 4487–4497. [DOI] [PubMed] [Google Scholar]
- Lowe AJ, Abbott RJ. 2004. Reproductive isolation of a new hybrid species, Senecio eboracensis Abbott & Lowe (Asteraceae). Heredity 92: 386–395. [DOI] [PubMed] [Google Scholar]
- Marshall TC, Slate J, Kruuk LEB, Pemberton JM. 1998. Statistical confidence for likelihood-based paternity inference in natural populations. Molecular Ecology 7: 639–655. [DOI] [PubMed] [Google Scholar]
- Martin NH, Willis JH. 2007. Ecological divergence associated with mating system causes nearly complete reproductive isolation between sympatric Mimulus species. Evolution 61: 68–82. [DOI] [PubMed] [Google Scholar]
- Martins DJ, Johnson SD. 2007. Hawkmoth pollination of aerangoid orchids in Kenya, with special reference to nectar sugar gradients in the floral spurs. American Journal of Botany 94: 650–659. [DOI] [PubMed] [Google Scholar]
- Martins DJ, Johnson SD. 2009. Distance and quality of natural habitat influence hawkmoth pollination of cultivated papaya. International Journal of Tropical Insect Science 29: 114–123. [Google Scholar]
- Martins DJ, Johnson SD. 2013. Interactions between hawkmoths and flowering plants in East Africa: polyphagy and evolutionary specialization in an ecological context. Biological Journal of the Linnean Society 110: 199–213 [Google Scholar]
- Oosterhout CV, Hutchinson WF, Wills DPM, Shipley P. 2004. MICRO-CHECKER: software for identifying and correcting genotyping errors in microsatellite data. Molecular Ecology Notes 4: 535–538. [Google Scholar]
- van der Pijl L. 1982. Principles of dispersal in higher plants . Berlin: Springer-Verlag. [Google Scholar]
- Powell JA, Brown JW. 1990. Concentrations of lowland sphingid and noctuid moths at high mountain passes in Eastern Mexico. Biotropica 22: 316–319. [Google Scholar]
- Pritchard JK, Stephens M, Donnelly P. 2000. Inference of population structure using multilocus genotype data. Genetics 155: 945–959. [DOI] [PMC free article] [PubMed] [Google Scholar]
- Rambo B. 1956. A fisionomia do Rio Grande do Sul, 3rd edn São Leopoldo: UNISINOS. [Google Scholar]
- Rangel TF, Diniz-Filho JAF, Bini LM. 2010. SAM: a comprehensive application for Spatial Analysis in Macroecology. Ecography 33: 1–5. [Google Scholar]
- Reck-Kortmann M, Silva-Arias GA, Segatto ALA, Mäder G, Bonatto SL, Freitas LB. 2014. Multilocus phylogeny reconstruction: new insights into the evolutionary history of the genus Petunia. Molecular Phylogenetics and Evolution 81: 19–28. [DOI] [PubMed] [Google Scholar]
- Ritland K. 1989. Correlated mattings in the partial selfer, Mimulus guttatus. Evolution 43: 848–859. [DOI] [PubMed] [Google Scholar]
- Ritland K. 2002. Extensions of models for the estimation of mating systems using n independent loci. Heredity 88: 221–228. [DOI] [PubMed] [Google Scholar]
- Ritland K. 2004. Multilocus mating system program MLTR. Version 3.1. University of British Columbia, Canada. Free program distributed by the authors from kritland@interchange.ubc.ca [Google Scholar]
- Ritland K, Jain SK. 1981. A model for the estimation of outcrossing rate and gene frequencies using independent loci. Heredity 47: 35–52. [Google Scholar]
- Robledo-Arnuncio J, Austerlitz F, Smouse PE. 2007. POLDISP: a software package for indirect estimation of contemporary pollen dispersal. Molecular Ecology Resources 7: 763–766. [Google Scholar]
- Rosenberg NA. 2004. DISTRUCT: a program for the graphical display of population structure. Molecular Ecology Notes 4: 137–138. [Google Scholar]
- Roy A, Frascaria N, MacKay J, Bousquet J. 1992. Segregating random amplified polymorphic DNAs (RAPDs) in Betula alleghaniensis. Theoretical and Applied Genetics 85: 173–180. [DOI] [PubMed] [Google Scholar]
- Ruhsam M. 2013. Patterns of mating, generation of diversity, and fitness of off-spring in a Geum hybrid swarm. Evolution 67: 2728–2740. [DOI] [PubMed] [Google Scholar]
- Ruhsam M, Hollingsworth PM, Ennos RA. 2011. Early evolution in a hybrid swarm between outcrossing and selfing lineages in Geum. Heredity 107: 246–255. [DOI] [PMC free article] [PubMed] [Google Scholar]
- Segatto ALA, Cazé ALR, Turchetto C, et al. 2014. Nuclear and plastid markers reveal the persistence of genetic identity: a new perspective on the evolutionary history of Petunia exserta. Molecular Phylogenetics and Evolution 70: 504–512. [DOI] [PubMed] [Google Scholar]
- Shore JS, Barrett SCH. 1990. Quantitative genetics of floral characters in homostylous Turnera ulmifolia var. angustifolia (Turneraceae). Heredity 64: 105–112. [Google Scholar]
- Slatkin M. 1985. Gene flow in natural population. Annual Review in Ecology, Systematics and Evolution 16: 393–430. [Google Scholar]
- Sink KC. 1984. Petunia monograph. Theoretical and Applied Genetics 9: 3–9. [Google Scholar]
- Sokal RR, Rohlf F. 1995. Biometry: the principles and practices of statistics in biological research, 3rd edn New York: WH Freeman and Company. [Google Scholar]
- Stebbins GL. 1957. Self-fertilization and population viability in the higher plants. American Naturalist 41: 337–354. [Google Scholar]
- Stehmann JR, Lorenz-Lemke AP, Freitas LB, Semir J. 2009. The genus Petunia. In: Gerats T, Strommer J, eds. Petunia evolutionary, developmental and physiological genetics. New York: Springer, 1–28. [Google Scholar]
- Tsukamoto T, Ando T, Kokubun H, et al. 1999. Breakdown on self-incompatibility in a natural population of Petunia axillaris (Solanaceae) in Uruguay containing both self-incompatible and self-compatible plants. Sexual Plant Reproduction 12: 6–13 [Google Scholar]
- Tsukamoto T, Ando T, Kokubun H, et al. 2003. Breakdown of self-incompatibility in a natural population of Petunia axillaris caused by a modifier locus that suppresses the expression of an S-RNase gene. Sexual Plant Reproduction 15: 255–263. [Google Scholar]
- Turchetto C, Fagundes NJR, Segatto ALA, et al. 2014a. Diversification in the South American Pampas: the genetic and morphological variation of the widespread Petunia axillaris complex (Solanaceae). Molecular Ecology 23: 374–389. [DOI] [PubMed] [Google Scholar]
- Turchetto C, Segatto ALA, Telles MPC, Diniz-Filho JAF, Freitas LB. 2014b. Infraspecific classification reflects genetic differentiation in the widespread Petunia axillaris complex: a comparison among morphological, ecological, and genetic patterns of geographic variation. Perspectives in Plant Ecology, Evolution and Systematics 16: 75–82. [Google Scholar]
- Vekemans X, Hardy OJ. 2004. New insights from fine-scale spatial genetic structure analyses in plant populations. Molecular Ecology 13: 921–935. [DOI] [PubMed] [Google Scholar]
- Venail J, Dell’Olivo A, Kuhlemeier C. 2010. Speciation genes in the genus Petunia. Philosophical Transactions of the Royal Society B: Biological Sciences 365: 461–468. [DOI] [PMC free article] [PubMed] [Google Scholar]
- Wagner HW, Sefc KM. 1999. IDENTITY 1.0. Centre for Applied Genetics, University of Agricultural Sciences Vienna. Available free from http://www-ang.kfunigraz.ac.at/∼sefck. [Google Scholar]
- Watanabe H, Ando T, Tsukamoto T, Hashimoto G, Marchesi E. 2001. Cross-compatibility of Petunia exserta with other Petunia taxa. Engei Gakkai Zasshi 70: 33–40. [Google Scholar]
- Weir BS. 1996. Genetic data analysis II. Sunderland, MA: Sinauer Associates. [Google Scholar]
- White GM, Boshier DH. 2000. Fragmentation in Central American dry forests: genetic impacts on Swietenia humilis (Meliaceae). In: Young AG, Clarke GM, eds. Genetics, demography and viability of fragmented populations. Cambridge: Cambridge University Press, 293–311. [Google Scholar]
- Winn AA, Elle E, Kalisz S, et al. 2011. Analysis of inbreeding depression in mixed-mating plants provides evidence for selective interference and stable mixed mating. Evolution 65: 3339–3359. [DOI] [PubMed] [Google Scholar]
- Wright S. 1940. Breeding structure of populations in relation to speciation. American Naturalist 74: 232–248. [Google Scholar]
Associated Data
This section collects any data citations, data availability statements, or supplementary materials included in this article.