

Abstract
Background and Aims Volatile organic compounds (VOCs) play various roles in plant–plant interactions, and constitutively produced VOCs might act as a cue to sense neighbouring plants. Previous studies have shown that VOCs emitted from the barley (Hordeum vulgare) cultivar ‘Alva’ cause changes in biomass allocation in plants of the cultivar ‘Kara’. Other studies have shown that shading and the low red:far-red (R:FR) conditions that prevail at high plant densities can reduce the quantity and alter the composition of the VOCs emitted by Arabidopsis thaliana, but whether this affects plant–plant signalling remains unknown. This study therefore examines the effects of far-red light enrichment on VOC emissions and plant–plant signalling between ‘Alva’ and ‘Kara’.
Methods The proximity of neighbouring plants was mimicked by supplemental far-red light treatment of VOC emitter plants of barley grown in growth chambers. Volatiles emitted by ‘Alva’ under control and far-red light-enriched conditions were analysed using gas chromatography–mass spectrometry (GC-MS). ‘Kara’ plants were exposed to the VOC blend emitted by the ‘Alva’ plants that were subjected to either of the light treatments. Dry matter partitioning, leaf area, stem and total root length were determined for ‘Kara’ plants exposed to ‘Alva’ VOCs, and also for ‘Alva’ plants exposed to either control or far-red-enriched light treatments.
Key Results Total VOC emissions by ‘Alva’ were reduced under low R:FR conditions compared with control light conditions, although individual volatile compounds were found to be either suppressed, induced or not affected by R:FR. The altered composition of the VOC blend emitted by ‘Alva’ plants exposed to low R:FR was found to affect carbon allocation in receiver plants of ‘Kara’.
Conclusions The results indicate that changes in R:FR light conditions influence the emissions of VOCs in barley, and that these altered emissions affect VOC-mediated plant–plant interactions.
Keywords: Barley, Hordeum vulgare, ethylene, phytochrome, plant–plant signalling, shade avoidance, volatile organic compounds, VOCs, biomass allocation, light quality, red:far-red ratio, plant density
INTRODUCTION
Plants adjust to environmental changes using a variety of cues derived from proximate vegetation. Above-ground information transfer through neighbour-induced changes in light quality and the responses initiated by these cues are well described (reviewed in Casal, 2013; Pierik and De Wit, 2014). The dominant above-ground light signal appears to be a reduced red:far-red light ratio (R:FR), caused by reflection of far-red and absorption of red light by leaves of neighbouring vegetation. In addition to changes in light quality, volatile organic compounds (VOCs) emitted by neighbouring plants might also serve as cues for surrounding plants (reviewed in Kegge and Pierik, 2010). VOCs are particularly well studied in the context of plant–herbivore interactions. Upon herbivore-induced plant damage, the emission of many VOCs increases (Turlings and Tumlinson, 1992; Dicke, 1994; Dicke et al., 1999). These herbivore-induced VOCs serve in various systems as attractants for predators and parasitoids of the herbivores (Turlings and Tumlinson, 1992; Dicke et al., 1999; Thaler, 1999). Interestingly, herbivore-induced VOCs have also been shown to induce resistance in proximate neighbours, indicating that VOCs can serve as chemical cues between plants. For example, in cabbage (Brassica oleracea), exposure to VOCs from herbivore-infested conspecifics primes direct and indirect defence responses in intact plants (Peng et al., 2011). Volatile information transfer is not restricted to intraspecific interactions. For example, VOCs produced by clipped sagebrush (Artemisia tridentate) can induce resistance to herbivory in wild tobacco (Nicotiana attenuata) (Karban et al., 2003).
In addition to plant–plant interactions mediated by herbivore-induced VOCs, there is also evidence for information transfer by VOCs between non-attacked plants. VOCs emitted by one plant can inhibit growth of neighbouring individuals of other species (e.g. Li et al., 1992; Nishida et al. 2005). VOCs can even help the parasitic plant Cuscuta pentagona locate its tomato host (Solanum lycopersicum), and the parasite can even discriminate the host VOC blend from non-host VOCs (Runyon et al., 2006). At high plant densities of cultivated tobacco (Nicotiana tabacum), the volatile plant hormone ethylene has been shown to accumulate in the atmosphere inside stands to levels that will stimulate stem elongation and vertical leaf orientation of neighbouring plants (Pierik et al., 2003, 2004), responses that are reminiscent of shade avoidance. Shade avoidance responses constitute mostly internode and petiole elongation, which brings the leaves higher in the canopy, i.e. closer to the light. Shade avoidance is induced by exposure to reduced R:FRs, following from reflection of far-red light and absorption of red light by nearby plants.
We showed recently that shading and low R:FR conditions that prevail at high plant densities reduce the quantity and alter the composition of the VOC blend emitted by Arabidopsis thaliana (Kegge et al., 2013). However, whether low R:FR exposure of emitter plants affected VOC-dependent information transfer between vegetative plants was not studied, and there are no reports showing that VOC-mediated information transfer, leading to growth adjustments, occurs between arabidopsis plants. However, information transfer through VOCs has been shown between two cultivars of barley (‘Alva’ VOCs affect carbon allocation of ‘Kara’ neighbours) and leads to altered carbon allocation between the root and shoot (Ninkovic, 2003). In the current study, we exploit this plant–plant signalling system to investigate (1) if exposure to low R:FR affects constitutive VOC emissions of barley to verify the generality of previous findings in arabidopsis; and (2) whether low R:FR-induced changes in volatile emission determine their effects on biomass allocation in neighbouring plants that are exposed to these VOCs. We demonstrate that exposure to a low R:FR leads to a reduction in the total emission of ‘Alva’ VOCs. Furthermore, ‘Kara’ exposed to VOCs of control light-grown ‘Alva’ has a different carbon allocation from ‘Kara’ exposed to VOCs from ‘Alva’ grown at low R:FR conditions. We conclude that low R:FR conditions affect VOC-mediated interactions between ‘Alva’ and ‘Kara’ plants through their impact on VOC emissions.
MATERIALS AND METHODS
Plant growth
Two spring barley (Hordeum vulgare) cultivars (‘Kara’ and ‘Alva’) were used for these experiments (Petterson et al., 1999; Ninkovic, 2003). Plants were grown in a climate chamber at the Swedish University of Agricultural Sciences (SLU), Uppsala, Sweden using a 16 h day/8 h night regime. Light intensity was set at 150 μmol m–2 s–1 (Hortilux Schréder, HPS 400 W, The Netherlands), with an R:FR of 1·9, measured with a Skye SK110 660/730 (red/far-red) Sensor (Skye Instruments Ltd, Powys, UK); the temperature was 20 ± 2 °C and relative humidity was 60 ± 5 %. Seeds were germinated on sand and transferred to perforated cylindrical polyethylene tubes (1 m with a diameter of 0·05 m) filled with washed silver sand 55 (Sibelco Nordic AB, Västerås, Sweden). Plants were watered automatically with a nutrient solution (130 mg L–1 N, 20 mg L–1 P, 103 mg L–1 K, 9 mg L–1 S, 6 mg L–1 Ca, 6 mg L–1 Mg, plus 1 mg L–1 micronutrients) (Wallco plant nutrient 51–10–43+mikro, Cederroth International AB, Falun, Sweden) every 2 h, and excess solution was drained from the tubes.
Plant–plant signalling experiments
Eight-day-old plants, each grown in individual pots (n = 18–19), were placed in transparent twin-chamber cages as described by Ninkovic (2003) for 10 d. In this cage set-up, receiver ‘Kara’ plants were exposed to air containing VOCs of ‘Alva’ grown under control light (KAc) conditions or air containing VOCs of ‘Alva’ grown at low R:FR (R:FR = 0·2) (KAfr) (Fig. 1). Unexposed ‘Kara’ plants were used as a negative control. ‘Alva’ plants under low R:FR conditions received, in addition to the standard white light, far-red light from far-red-emitting LEDs (730 nm, Philips Green power, Philips, Eindhoven, The Netherlands). The two chambers (each 10 × 10 × 80 cm) of the clear plexiglass twin-chamber cages were separated by clear plexiglass tubes with a diameter of 7 cm and length of 30 cm, and an aluminium foil curtain. Air flowed through these tubes from emitter to receiver with a flow rate of 1·3 L min–1, thus replacing the entire air volume per chamber every 6 min. Separation of the chambers allowed exposure of plants in the emitter cage to different light conditions from the receiver plants and prevented light signalling between emitter and receiver plants. After 10 d of treatment, both ‘Alva’ and ‘Kara’ plants were harvested and the following measurements were taken: leaf area, leaf dry weight, stem length, plant height (the plant height from soil to the tip when leaves are held upright), stem dry weight, root dry weight and total root length. Using some of these parameters, we also calculated three allocation parameters: leaf mass fraction (LMF, g leaf g–1 total plant), specific leaf area (SLA, m2 leaf g–1 leaf) and shoot mass fraction (SMF, g shoot g–1 plant). Leaf area was measured with a Li-3100 Area Meter (LI-COR); stem length and plant height were measured with a ruler. Plant material was dried in an oven at 70 °C for 3 d and subsequently weighed on a balance (Sartorius, Sartorius Megatronics, Nieuwegein, The Netherlands). Roots were scanned for root length using a scanner (EPSON Perfection 4900 3.4, Regent Instruments, Quebec, Canada), and root length was determined using WinRHIZO Pro V 2007 software (Regent Instruments, Quebec, Canada).
Fig. 1.

Experimental set-up for the plant–plant gassing experiments. Barley ‘Alva’ plants were grown in a Plexiglas plant chamber under (B) control HPS white light (Ac ‘Alva’) or (C) white light supplemented with far-red (FR) light (Afr ‘Alva’). A forced air stream directed air from the ‘Alva’ plant chamber into a second chamber with barley ‘Kara’ plants, that were either unexposed (A), or exposed to (B) air from Ac plants (KAc ‘Kara’) or (C) air from Afr plants (yielding KAfr ‘Kara’). An aluminium foil curtain prevented far-red scattering from Afr treatment onto ‘Kara’ plants and prevented general light reflection between the plants.
Collection and analysis of barley volatiles
Volatiles from barley plants were collected by dynamic headspace air entrainment (Glinwood et al. 2011). Barley ‘Alva’ plants were grown with 10–11 plants per pot to produce sufficient biomass to generate measureable amounts of VOCs per replicate pot. After 10 d, eight replicate pots per treatment were placed under low R:FR (R:FR = 0·2) and under control light (R:FR = 1·9) for 5 d (n = 8). After 5 d of low R:FR pre-treatment, plants were placed for 72 h in polyester bags (Melitta Scandinavia AB, Toppits 60 × 55 cm), which had been baked previously for 2 h at 140 °C to purge volatile components from the polyester. Pots were wrapped in aluminium foil to minimize VOC release from the pots. Control light and low R:FR conditions were identical to those described in the previous paragraph. Bags were closed from the side with a plastic tie and plants were placed back in low R:FR or control conditions. Charcoal-filtered air was pumped into the bag (push flow 600 mL min–1) from the lower part of the bag through a Teflon tube fastened with a plastic tie. VOCs were trapped in glass tubes containing Porapak Q (PPQ, 50 mg of PPQ per tube, mesh 50/80, Supelco, Bellefonte, PA, USA) from the outgoing air (pull flow 450 mL min–1). The PPQ-filled tubes were fastened with a plastic tie at the top of the bag without touching the leaves, but were not airtight. There was thus a slight positive pressure in the bags that prevented unfiltered air from entering. Teflon tubes and aluminium foil were baked overnight at 180 °C. Charcoal filters were baked overnight at 180 °C with a constant nitrogen flow. PPQ tubes were rinsed with redistilled dichloromethane (DCM) and baked overnight under nitrogen flow (400 mL min–1) at a temperature of 150 °C and cooled down to room temperature just before volatile collection started.
After 72 h of volatile collection, the collected volatile compounds were rinsed from each of the PPQ traps with 750 μL of redistilled DCM into a 2 ml glass vial. Next, 1 μl of (30 ng μl–1) 1-nonene was added as internal standard and the samples were reduced to 50 μl volume under a gentle flow of nitrogen. Compounds were identified using coupled gas chromatography–mass spectrometry (GC-MS).
A 2 μl aliquot of each sample was injected onto a HP1 column (30 m × 0·25 mm i.d., J & W Scientific) housed in a 7890A gas chromatograph (Agilent Technologies, Santa Clara, CA, USA) coupled to an Agilent 5975C mass spectrometer. Ionization was achieved by electron impact at 70 eV. The oven temperature was maintained at 30 °C for 1 min, and then programmed at 5 °C min–1 to 150 °C and held for 0·1 min, then 10 °C min–1 to 250 °C. The carrier gas was helium with a flow rate of 1 mL min–1. Identifications were made by comparison of spectra with those of authentic samples in a database (NIST 2008) and confirmed by comparing retention times with those of authentic standards. Quantifications were made by dividing the total ion count for each target peak by that of the internal standard and multiplying by the known amount of standard in each sample.
Chemical standards were obtained as follows: caryophyllene oxide 95 %, dodecane >99 %, (Z)-3-hexen-1-ol 98 %, (Z)-3-hexenyl acetate 98 %, α-humulene 98 %, linalool 97 %, linalool oxide (mixture of isomers) 97 %, 1-octen-3-ol 98 %, 3-octanone 98 %, 6-methyl-5-hepten-2-one 99 %, methyl salicylate 98 %, naphthalene 99 %, tridecane >99 %, undecane >99 % (all from Sigma-Aldrich, Sweden), E-β-caryophyllene 98·5 % (Fluka, Sweden), hexahydrofarnesyl acetone 98 % (Bedoukian, Danbury, CT, USA), myrcene 90 % (Fluka, Sweden) and 3-methyl tridecane (Chiron, Trondheim, Norway). Identifications were made by comparison of spectra with a commercially available database (NIST 2008) and confirmed by comparing spectra and retention times with those of authentic standards where available. Standards for humulene oxide and longipinocarvone were not available, and identification of these compounds should be considered preliminary.
Ethylene gassing and sampling
For experiments to determine ethylene production and the barley growth response to prolonged ethylene exposure, seeds were stratified for 3 d at 4 °C to synchronize germination and subsequently germinated and grown in growth chambers at Utrecht University, The Netherlands. Three days after germination, plants were placed in separate pots (9 × 9 × 9·5 cm), filled with primasta soil® (Primasta BV, Asten, The Netherlands), and 100 mL of nutrient solution (Millenaar et al., 2005) was added per plant. Plants were placed in growth chambers and automatically watered daily with tap water.
Eight-day-old ‘Kara’ plants (n = 12 plants per treatment) were exposed to different concentrations of ethylene in glass cuvettes (18 L, 30 × 30 × 21 cm). Pure ethylene (Hoek Loos BV, Schiedam, The Netherlands) was mixed with air, using flow meters and controllers (Brooks Instruments BV, Ede, The Netherlands) to reach the desired concentrations of 0, 25 and 230 ppb. The temperature was 20 ± 1 °C, and the relative humidity was set at 70 ± 3 % at a flow rate of 75 L h–1. Ethylene concentrations were calibrated prior to the start of the experiment, using a GC955 gas chromatograph with Photo ionization detector and 160 cm Haye Sep R column, filled with Haye Sep 80/100 mesh (Synspec, Groningen, The Netherlands).
Ethylene production was measured from freshly harvested shoot tissue [approx. 1·0–1·2 g fresh weight (f. wt), n = 5] after 20 min of headspace accumulation in a syringe, as described previously (Millenaar et al., 2005), using the GC955 mentioned above.
Statistics
In the volatile measurements, the presence of equal volatile profiles was confirmed using multivariate analysis of variance (MANOVA) based on interpretation of Wilk’s Lambda. This was followed by individual ANOVAs for each of the compounds. Growth and allocation data were analysed with ANOVA or Student’s t-test in the IBM SPSS statistics 20 software.
RESULTS
Exposure to low R:FR changes carbon allocation and the emission of volatiles
To verify whether VOC emissions are affected upon exposure to low R:FR, as was previously shown for A. thaliana (Kegge et al., 2013), barley plants (‘Alva’) were grown under normal and low R:FR conditions. Low R:FR-exposed plants had a similar total dry weight to plants grown in control light (Fig. 2A). Although low R:FR-exposed plants invested more dry mass in the shoot relative to the root compared with control plants (Fig. 2B), they had a higher leaf mass fraction (LMF; g leaf g–1 total plant) and specific leaf area (SLA; m2 leaf g–1 leaf) (Fig. 2C, D), which corresponded to a higher leaf dry weight and leaf area in low R:FR-grown ‘Alva’ plants compared with plants grown in control light (Fig. 2E, F). Consistent with these enhanced investments in shoot organs, stem elongation was also stimulated in low R:FR (Fig. 3), a well-known shade avoidance feature. ‘Alva’ VOCs collected from plants grown under control light or low R:FR conditions were analysed by GC-MS. In total, 20 different compounds were detected (Table 1). Control plants were found to emit higher quantities of VOCs than low R:FR-grown plants (Fig. 4). The emission of six out of these 20 VOCs was significantly lower for low R:FR-exposed plants than for control plants, whereas there was a trend towards such suppression for 1-octen-3-ol (P = 0·05) (Table 1). The emissions of the sesquiterpenes (E)-β-caryophyllene, α-humulene and caryophyllene oxide were significantly reduced by low R:FR (Table 1). Three other compounds, 6-methyl-5-hepten-2-one, the polycyclic aromatic hydrocarbon naphthalene and hexahydrofarnesyl acetone, also showed reduced emission under low R:FR (Table 1). The emission of linalool oxide, on the other hand, was increased under low R:FR (Table 1), whereas the emission of 13 other compounds was not significantly affected by low R:FR exposure (Table 1). Likewise, the emission of the volatile plant hormone ethylene was enhanced under low R:FR (Fig. 5), both after 6 h and after 10 d of low R:FR exposure.
Fig. 2.

Growth response of ‘Alva’ plants after 10 d exposure to low R:FR conditions (low R:FR, n = 18) or under control light conditions (control, n = 19). In (C), leaf mass fraction (LMF; g leaf g–1 plant) is shown. (D) Specific leaf area (SLA; cm2 leaf g–1 leaf). Bars represent means ± s.e. Data were analysed with a Student’s t-test. Significant differences are indicated by *P < 0·05, **P < 0·01 or ***P < 0·001.
Fig. 3.
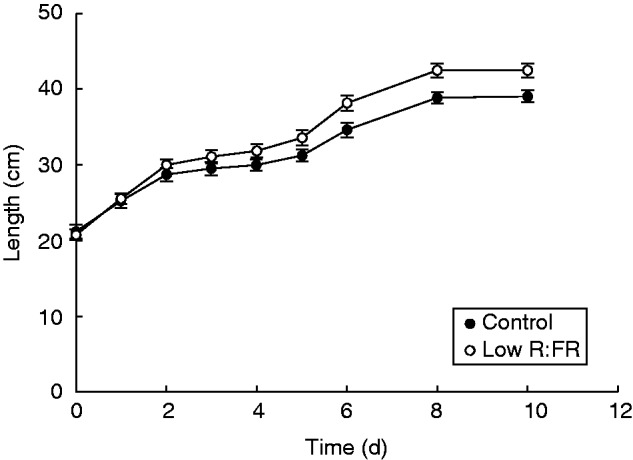
Length of ‘Alva’ plants grown in control light (filled symbols) or low R:FR light conditions (open symbols). Data points are means ± s.e. (n = 10). A significant interaction between time and light treatment was found (Wilk’s Lambda P = 0·013).
Table 1.
Emission (ng g–1 shoot f. wt) of volatile organic compounds by ‘Alva’ plants under control light (control) and low R:FR light conditions (low R:FR)
| Compound | Control | s.e. | Low R:FR | s.e. | P-value |
|---|---|---|---|---|---|
| (Z)-3-Hexen-1-ol | 0·1054 | 0·075 | 0·0799 | 0·045 | 0·78 |
| 6-Methyl-5-hepten-2-one | 0·5475 | 0·069 | 0·2786 | 0·046 | 0·01* |
| 1-Octen-3-ol | 0·3592 | 0·066 | 0·2018 | 0·033 | 0·05 |
| 3-Octanone | 0·1941 | 0·096 | 0·1766 | 0·091 | 0·90 |
| Myrcene | 0·2675 | 0·049 | 0·3347 | 0·097 | 0·55 |
| (Z)-3-Hexenyl acetate | 0·6781 | 0·081 | 0·5364 | 0·075 | 0·22 |
| Linalool oxide | 0·0000 | 0·000 | 0·4831 | 0·099 | 0·00* |
| Linalool | 0·3989 | 0·030 | 0·5833 | 0·120 | 0·16 |
| Naphthalene | 0·4003 | 0·045 | 0·0547 | 0·040 | 0·00* |
| Methyl salicylate | 0·3104 | 0·080 | 0·4155 | 0·103 | 0·44 |
| Undecane | 0·9649 | 0·117 | 0·7514 | 0·175 | 0·33 |
| Dodecane | 0·5917 | 0·105 | 0·6782 | 0·129 | 0·61 |
| Tridecane | 0·7224 | 0·085 | 0·7963 | 0·177 | 0·71 |
| 3-Methyl tridecane | 0·4853 | 0·067 | 0·4233 | 0·190 | 0·76 |
| (E)-β-Caryophyllene | 5·1062 | 0·789 | 1·9724 | 0·411 | 0·00* |
| α-Humulene | 2·2148 | 0·338 | 1·1985 | 0·186 | 0·02* |
| Longipinocarvone | 0·7521 | 0·103 | 0·7731 | 0·237 | 0·94 |
| Caryophyllene oxide | 2·7162 | 0·446 | 1·2168 | 0·191 | 0·01* |
| Humulene oxide | 0·8189 | 0·167 | 0·7975 | 0·339 | 0·96 |
| Hexahydrofarnesyl acetone | 3·4785 | 0·417 | 2·0839 | 0·389 | 0·03* |
Plants were grown with 10–11 plants per pot. Per treatment, independent samples were collected from eight replicate plots.
P-values were obtained with a Student’s t-test; * indicates a significant treatment effect.
Fig. 4.
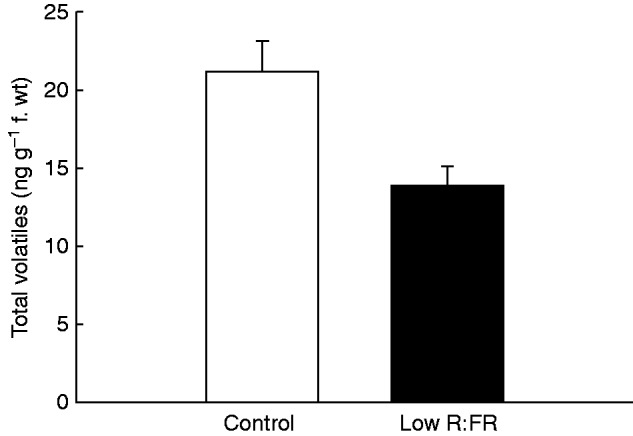
Total amount of emitted volatiles of ‘Alva’ plants under control light (control) and low R:FR light conditions (low R:FR). Bars represent means ± s.e. (n = 8). A significant difference (P = 0·009, Student’s t-test) is indicated by **.
Fig. 5.
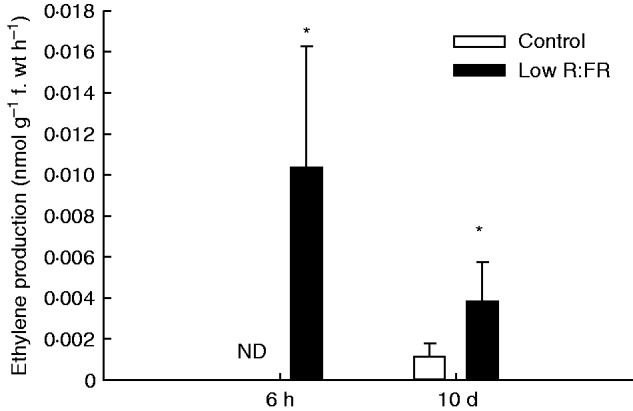
Ethylene production of ‘Alva’ plants after 6 h and 10 d of low R:FR exposure. Bars represent means ± s.e. (n = 5). Significant differences per time-point (P < 0·05, Student’s t-test) are indicated by an asterisk, ND, not detected.
Exposure to low R:FR changes effects of ‘Alva’ VOCs on ‘Kara’ receiver plants
Given the clear changes in VOC emissions upon low R:FR exposure, we investigated if this has consequences for plant–plant interactions. To investigate this, a previously established system in which exposure to ‘Alva’ VOCs leads to altered resource allocation in ‘Kara’ receiver plants (Ninkovic, 2003) was used. ‘Kara’ plants exposed to volatiles from ‘Alva’ plants grown in control light (KAc) accumulated significantly less biomass than ‘Kara’ plants exposed to volatiles from low R:FR-grown ‘Alva’ plants (KAfr) (Fig. 6A). ‘Kara’ plants that were not exposed to neighbour-derived volatiles were not significantly different from either KAc or KAfr in terms of above-ground dry weight measures. Leaf weight, leaf area and stem weight were higher for KAfr than for KAc (Fig. 6B–D). For stem length, no differences between different treatments have been observed (Fig. 6E). The total shoot weight was also higher in KAfr than in KAc (Fig. 6F), which is in line with the observations on leaf weight and stem weight (Fig. 6B, D). For total plant height, KAfr was higher than KAc, while both these treatments did not differ from control plants that were not exposed to neighbour-derived volatiles (Fig. 6G). The accumulation of root dry weight was inhibited by exposure to control light-grown ‘Alva’ plants relative to plants that were not exposed to volatiles from other plants, and this effect was lost when ‘Alva’ emitters were exposed to low R:FR conditions. (Fig. 6H). In addition, KAfr had a higher total root length than KAc (Fig. 6I). Although KAfr and KAc differed in total leaf area and leaf dry weight (Fig. 6B, C), the SLA was found to be similar for all treatments (Fig. 6J). The shoot mass fraction (SMF, g shoot g–1 plant) was highest in KAc (Fig. 6K), indicating an increased dry mass allocation to shoots of ‘Kara’ plants in response to control light-grown ‘Alva’ VOCs. Finally, the LMF was higher in KAfr than in KAc and not different between KAc and control ‘Kara’ plants that were not exposed to ‘Alva’ at all (Fig. 6L). It is noteworthy that for most parameters, ‘Kara’ plants that were not exposed to an ‘Alva’ neighbour at all were not significantly different from either KAc or KAfr, except for root dry weight and LMF (Fig. 6H, L).
Fig. 6.

Growth parameters of unexposed ‘Kara’ plants (C), ‘Kara’ exposed to control ‘Alva’ VOCs (KAc) and to VOCs of low R:FR-grown ‘Alva’ (KAfr). Means and s.e. are shown (n = 15–19). (J) Specific leaf area (cm2 leaf g–1 leaf). (K and L) Shoot and leaf mass fraction (SMF and LMF, respectively, g leaf g–1 plant). Significant differences are represented by different letters (P < 0·05, one-way ANOVA, Bonferroni-post-hoc).
Ethylene exposure reduces plant height and leaf area of ‘Kara’ plants
Ethylene production by ‘Alva’ plants is enhanced by low R:FR conditions (Fig. 5). Therefore, we tested whether differences in resource allocation between KAc and KAfr could be due to differential ethylene emissions by ‘Alva’ plants. To this end, ‘Kara’ plants exposed to air containing 25 or 230 ppb ethylene were compared with control plants. No effect of ethylene exposure was found on total dry weight, or dry weight of leaves, stems or roots (Fig. 7A–D). However, total plant height of ‘Kara’ exposed to 230 ppb ethylene was reduced compared with control plants (Fig. 7E), although no differences in stem length were observed (Fig. 7F). Both 25 and 230 ppb ethylene led to reduced leaf area compared with control plants (Fig. 7G), but no differences in the SLA were found (Fig. 7 H). In contrast to the observed differences in SMF and LMF between KAc and KAfr (Fig. 6K, L), no ethylene-induced differences in LMF were found (Fig. 7I, J).
Fig. 7.

Growth response of ‘Kara’ plants after 10 d exposure to 0, 25 or 230 ppb ethylene. Bars represent means ± s.e. (n = 12). In (H–J), specific leaf area (SLA), leaf mass fraction (LMF) and shoot mass fraction (SMF) are shown. Significant differences are indicated with different letters (one-way ANOVA, Bonferroni post hoc test, α = 0·05).
DISCUSSION
We demonstrate that exposure of barley ‘Alva’ plants to low R:FR conditions results in reduced total emission of VOCs. In addition, the relative composition of the VOC blend is affected by low R:FR, since the emission of some components is reduced and the emission of other compounds is unaffected or even increased. Coinciding with these changes in volatile emission, exposure of ‘Kara’plants to VOCs of low R:FR-exposed ‘Alva’ plants no longer led to the increased shoot mass fraction or reduced root dry weight that was observed in response to VOCs emitted by control light-grown ‘Alva’ plants. Moreover, ‘Kara’ plants exposed to VOCs of low R:FR-grown ‘Alva’ plants accumulated more shoot dry weight and had a higher LMF than ‘Kara’ plants exposed to ‘Alva’ plants grown under normal light.
We showed recently (Kegge et al., 2013) that both constitutive and methyl jasmonate-induced volatile emissions of A. thaliana are reduced under low R:FR. In the current study, it is demonstrated that exposure to low R:FR also reduced the emission of several VOCs in barley (Table 1), suggesting that reduced volatile emission in low R:FR conditions might be a general phenomenon in plants. Three out of six significantly downregulated ‘Alva’ VOCs are sesquiterpenes. Emission of the sesquiterpene (E)-β-caryophyllene in maize (Zea mays) is sensitive to changes in light intensity and temperature (Gouinguene and Turlings, 2002). The data provided here indicate that the emission of (E)-β-caryophyllene is also reduced under low R:FR conditions, thus adding light quality to the environmental parameters that control the emission of this volatile sesquiterpene. However, both these data and the previously published data on light intensity and temperature (Gouingene and Turlings, 2002) do not address whether the observed changes in β-caryophyllene emission are due to environmental control of β-caryophyllene biosynthesis, volatilization, stomatal conductance or other factors that influence VOC emission. Since only the emissions of specific VOCs are reduced by low R:FR, it is likely that the effects on sesquiterpenes are not related to stomatal conductance or other factors that would affect emissions of all VOCs.
VOC-mediated interactions are unlikely to be caused by ethylene
Although the majority of VOCs were suppressed or unaffected by low R:FR, the emission of two compounds was clearly enhanced: linalool oxide and ethylene. The enhanced ethylene emission of ‘Alva’ is in accordance with enhanced ethylene production of low R:FR-exposed sorghum (Sorghum bicolor) (Finlayson et al., 1999), arabidopsis (Pierik et al., 2009) and many other species (reviewed in Kegge and Pierik, 2010). In cultivated tobacco (N. tabacum), it has been suggested that perception of ethylene levels that accumulated in dense stands (approx. 25 ppb) may serve as a neighbour detection cue (Pierik et al., 2004). We show here that low R:FR exposure also induces ethylene emission of ‘Alva’, but the absolute ethylene emission rate by barley is very low compared with other species. Low R:FR-exposed A. thaliana, for example, produced up to 0·10 nmol ethylene g–1 f. wt h–1 (Kegge et al., 2013), while barley produced no more than 0·012 nmol ethylene g–1 f. wt h–1 (Fig. 5). Therefore, in cuvettes with ‘Kara’ receivers, ethylene levels were unlikely to reach concentrations that are physiologically meaningful. In addition, ethylene-exposed plants showed reduced plant height, whereas ‘Kara’ plants exposed to VOCs from low R:FR-grown ‘Alva’ (KAfr) were longer than ‘Kara’ plants exposed to normal light-grown ‘Alva’ (KAc). The observation that exposure to high levels of ethylene did not affect shoot and root mass fraction, root length or root weight (Fig. 7) further argues against an important role for ethylene in affecting biomass allocation in ‘Kara’ in response to air derived from ‘Alva’ plants.
Low R:FR effects on VOC emission control carbon allocation in receiver plants
The consequences of modulation of VOC emission by low R:FR exposure were studied in neighbouring plants exposed to these VOCs. It was previously shown that ‘Kara’ undergoes changes in carbon allocation upon exposure to the VOC blend emitted by ‘Alva’ neighbours (Ninkovic, 2003), but does not respond to VOC blends from conspecific ‘Kara’ neighbours. Here, we confirm that ‘Alva’ VOCs affect carbon allocation in ‘Kara’ neighbours. Notably, the shoot mass fraction increased and root weight decreased in ‘Kara’ exposed to control light-grown ‘Alva’ compared with plants that were not exposed to neighbours. These allocation changes are partly different from those observed by Ninkovic (2003) and, since the same cultivars have been used in both studies, we speculate that differences between the two studies are related to major differences in growth conditions. The current experiments used plants grown in growth chamber conditions and with a light-impenetrable separation between the receiver and emitter plants. The experiments by Ninkovic (2003) were collected in a greenhouse with much higher, but less constant, light intensities and with light reflection between emitter and receiver plants.
As indicated above, the emission of several VOCs is reduced upon low R:FR exposure. However, since in dense stands some VOCs may still accumulate to sufficiently high levels to exert effects on neighbours before shading would reduce their emissions, it would still be possible that ‘Kara’ plants respond to ‘Alva’ VOCs as a cue of neighbour proximity. Indeed, the observed increased SMF in KAc as compared with KAfr could be interpreted as an optimization towards above-ground competitive performance in response to neighbour-derived VOCs prior to low R:FR exposure, for example by investing carbon in stems that allow a plant to grow taller and reach the light; the shade avoidance syndrome. However, stem length did not increase in KAc, compared with other treatments (Fig. 6E), suggesting that the increase in SMF in KAc does not represent induction of shade avoidance-like responses. Theoretically, barley might not show shoot elongation at all as a shade avoidance response, but Fig. 3 shows that at least ‘Alva’ does show low R:FR-induced elongation growth. We therefore speculate that responses to VOCs from neighbours that are not exposed to low R:FR do not represent a shade avoidance-like response. Rather, the observed reduction in total dry weight in KAc compared with KAfr could imply that compounds in the VOC blend derived from ‘Alva’ neighbours that are not exposed to low R:FR conditions are allelopathic to ‘Kara’ plants. Although these VOC-mediated effects of ‘Alva’ on ‘Kara’ plants may affect ‘Kara’ competitive performance prior to the occurrence of low R:FR conditions, these VOC effects are negated once ‘Alva’ plants become exposed to low R:FR conditions, which is the light scenario that occurs already early on in development of high-density stands.
Conclusions and future perspectives
Changes in R:FR appeared to affect the emission of volatiles in barley. These changes in VOC emission play a role in plant–plant interactions, shown in the current study with the barley model. Although changes in VOC emission affect carbon allocation in ‘Kara’ plants, it is important to note that, under field conditions, growth at high plant density will also have a major impact on the carbon allocation of receiver plants. In this study, only emitter plants were exposed to reduced R:FR levels, whereas under field conditions both the emitter and receiver plant will face reduced R:FR levels. Thus it remains to be investigated how low R:FR-mediated changes in VOC emissions affect receivers that are also exposed to low R:FR. The findings in barley are in agreement with data on arabidopsis where low R:FR also affected the emission of VOCs, and in both species the total VOC emission is reduced under low R:FR. We showed previously in arabidopsis (Kegge et al., 2013) that these light quality effects have implications for VOC-mediated plant–herbivore interactions, and the current data set shows that these R:FR effects on VOC emissions also affect VOC-mediated plant–plant information transfer. A future challenge is to determine the relative importance of VOC signalling for carbon allocation in dense stands in the field.
ACKNOWLEDGEMENTS
The authors thank M. Dicke for valuable comments on earlier versions of this manuscript, E. Qvarfordt for technical assistance with the entrapment of barley volatiles, R. Khalaf for help with the analysis of root lengths, and A. Andersson for help with shoot measurements of barley plants. This work was supported by The Netherlands Organization for Scientific Research [NWO grant 818.01.003 to R.P.] and by the Swedish Foundation for Strategic Environmental Research (MISTRA) through the PlantComMistra program.
LITERATURE CITED
- Casal JJ. 2013. Photoreceptor signaling networks in plant responses to shade. Annual Review of Biology 64: 403–427. [DOI] [PubMed] [Google Scholar]
- Dicke M. 1994. Why do plants ‘talk’? Chemoecology 5/6: 159–165. [Google Scholar]
- Dicke M, Gols R, Ludeking D, Posthumus MA. 1999. Jasmonic acid and herbivory differentially induce carnivore-attracting plant volatiles in lima bean plants. Journal of Chemical Ecology 25: 1907–1922. [Google Scholar]
- Finlayson SA, Lee IJ, Mullet JE, Morgan PW. 1999. The mechanism of rhythmic ethylene production in sorghum. The role of phytochrome B and simulated shading. Plant Physiology 119: 1083–1089. [DOI] [PMC free article] [PubMed] [Google Scholar]
- Glinwood R, Ahmed E, Qvarfordt E, Ninkovic V. 2011. Olfactory learning of plant genotypes by a polyphagous predator. Oecologia 166: 637–647 [DOI] [PMC free article] [PubMed] [Google Scholar]
- Gouinguene SP, Turlings TCJ. 2002. The effects of abiotic factors on induced volatile emissions in corn plants. Plant Physiology 129: 1296–1307. [DOI] [PMC free article] [PubMed] [Google Scholar]
- Karban R, Maron J, Felton GW, Ervin G, Eichenseer H. 2003. Herbivore damage to sagebrush induces resistance in wild tobacco: evidence for eavesdropping between plants. Oikos 100: 325–332. [Google Scholar]
- Kegge W, Pierik R. 2010. Biogenic volatile organic compounds and plant competition. Trends in Plant Science 15: 126–132. [DOI] [PubMed] [Google Scholar]
- Kegge W, Weldegergis BT, Soler R, et al. 2013. Canopy light cues affect emission of constitutive and methyl jasmonate-induced volatile organic compounds in Arabidopsis thaliana. New Phytologist 200: 861–874. [DOI] [PMC free article] [PubMed] [Google Scholar]
- Li H, Nishimura H, Hasegawa K, Mizutani J. 1992. Allelopathy of Sasa cernua. Journal of Chemical Ecology 18: 1785–1796. [DOI] [PubMed] [Google Scholar]
- Millenaar FF, Cox MCH, De Jong-van Berkel YEM, et al. 2005. Ethylene-induced differential growth of petioles in Arabidopsis. Analyzing natural variation, response kinetics, and regulation. Plant Physiology 137: 998–1008. [DOI] [PMC free article] [PubMed] [Google Scholar]
- Ninkovic V. 2003. Volatile communication between barley plants affects biomass allocation. Journal of Experimental Botany 54: 1931–1939. [DOI] [PubMed] [Google Scholar]
- Nishida N, Tamotsu S, Nagata N, Saito C, Sakai A. 2005. Allelopathic effects of volatile monoterpenoids produced by Salvia leucophylla: inhibition of cell proliferation and DNA synthesis in the root apical meristem of Brassica campestris seedlings. Journal of Chemical Ecology 31: 1187–1203. [DOI] [PubMed] [Google Scholar]
- Peng J, van Loon JJA, Zheng S, Dicke M. 2011. Herbivore-induced volatiles of cabbage (Brassica oleracea) prime neighbour responses in neighbouring intact plants. Plant Biology 13: 276–284. [DOI] [PubMed] [Google Scholar]
- Petterson J, Ninkovic V, Ahmed E. 1999. Volatiles from different barley cultivars affect aphid acceptance of neighbouring plants. Acta Agriculturae Scandinavica 49: 152–157. [Google Scholar]
- Pierik R, De Wit M. 2014. Shade avoidance: phytochrome signalling and other aboveground neighbour detection cues. Journal of Experimental Botany 65: 2815–2824 [DOI] [PubMed] [Google Scholar]
- Pierik R, Visser EJW, De Kroon H, Voesenek LACJ. 2003. Ethylene is required in tobacco to successfully compete with proximate neighbours. Plant, Cell and Environment 26: 1229–1234. [Google Scholar]
- Pierik R, Whitelam GC, Voesenek LACJ, De Kroon H, Visser EJW. 2004. Canopy studies on ethylene-insensitive tobacco identify ethylene as a novel element in blue light and plant–plant signalling. The Plant Journal 38: 310–319. [DOI] [PubMed] [Google Scholar]
- Pierik R, Djakovic-Petrovic T, Keuskamp DH, de Wit M, Voesenek LAJC. 2009. Auxin and ethylene regulate elongation to neighbour proximity signals independent of gibberellin and DELLA proteins in Arabidopsis. Plant Physiology 149: 1701–1712. [DOI] [PMC free article] [PubMed] [Google Scholar]
- Poorter H, Niklas KJ, Reich PB, Oleksyn J, Poot P, Mommer L. 2012. Biomass allocation to leaves, stems and roots: meta-analyses of interspecific variation and environmental control. New Phytologist 193: 30–50. [DOI] [PubMed] [Google Scholar]
- Runyon JB, Mescher MC, De Moraes CM. 2006. Volatile chemical cues guide host location and host selection by parasitic plants. Science 313: 1964–1967. [DOI] [PubMed] [Google Scholar]
- Thaler JS. 1999. Jasmonate-inducible plant neighbours cause increased parasitism of herbivores. Nature 399: 686–688. [Google Scholar]
- Turlings TC, Tumlinson JH. 1992. Systemic release of chemical signals by herbivore-injured corn. Proceedings of the National Academy of Sciences, USA 89: 8399–8402. [DOI] [PMC free article] [PubMed] [Google Scholar]