

Wang et al. use diffusion basis spectrum imaging (DBSI) to noninvasively differentiate and quantify axon and myelin injury/loss, cellular inflammation and oedema in multiple sclerosis. They validate DBSI-derived metrics by showing close agreement with histological analyses of autopsied multiple sclerosis spinal cord, before applying the method to patients with multiple sclerosis.
Keywords: diffusion basis spectrum imaging, diffusion tensor imaging, white matter injury, inflammation, multiple sclerosis
Wang et al. use diffusion basis spectrum imaging (DBSI) to noninvasively differentiate and quantify axon and myelin injury/loss, cellular inflammation and oedema in multiple sclerosis. They validate DBSI-derived metrics by showing close agreement with histological analyses of autopsied multiple sclerosis spinal cord, before applying the method to patients with multiple sclerosis.
Abstract
Axon injury/loss, demyelination and inflammation are the primary pathologies in multiple sclerosis lesions. Despite the prevailing notion that axon/neuron loss is the substrate of clinical progression of multiple sclerosis, the roles that these individual pathological processes play in multiple sclerosis progression remain to be defined. An imaging modality capable to effectively detect, differentiate and individually quantify axon injury/loss, demyelination and inflammation, would not only facilitate the understanding of the pathophysiology underlying multiple sclerosis progression, but also the assessment of treatments at the clinical trial and individual patient levels. In this report, the newly developed diffusion basis spectrum imaging was used to discriminate and quantify the underlying pathological components in multiple sclerosis white matter. Through the multiple-tensor modelling of diffusion weighted magnetic resonance imaging signals, diffusion basis spectrum imaging resolves inflammation-associated cellularity and vasogenic oedema in addition to accounting for partial volume effects resulting from cerebrospinal fluid contamination, and crossing fibres. Quantitative histological analysis of autopsied multiple sclerosis spinal cord specimens supported that diffusion basis spectrum imaging-determined cellularity, axon and myelin injury metrics closely correlated with those pathologies identified and quantified by conventional histological staining. We demonstrated in healthy control subjects that diffusion basis spectrum imaging rectified inaccurate assessments of diffusion properties of white matter tracts by diffusion tensor imaging in the presence of cerebrospinal fluid contamination and/or crossing fibres. In multiple sclerosis patients, we report that diffusion basis spectrum imaging quantitatively characterized the distinct pathologies underlying gadolinium-enhanced lesions, persistent black holes, non-enhanced lesions and non-black hole lesions, a task yet to be demonstrated by other neuroimaging approaches. Diffusion basis spectrum imaging-derived radial diffusivity (myelin integrity marker) and non-restricted isotropic diffusion fraction (oedema marker) correlated with magnetization transfer ratio, supporting previous reports that magnetization transfer ratio is sensitive not only to myelin integrity, but also to inflammation-associated oedema. Our results suggested that diffusion basis spectrum imaging-derived quantitative biomarkers are highly consistent with histology findings and hold promise to accurately characterize the heterogeneous white matter pathology in multiple sclerosis patients. Thus, diffusion basis spectrum imaging can potentially serve as a non-invasive outcome measure to assess treatment effects on the specific components of underlying pathology targeted by new multiple sclerosis therapies.
Introduction
Quantitative MRI methods have shown specificities to various pathologies (Oh et al., 2013a). Notably, magnetization transfer ratio (MTR) is sensitive to myelin integrity (Schmierer et al., 2004; Vavasour et al., 2011). N-acetyl aspartate (NAA) to creatine ratio (Matthews et al., 1991) measured by magnetic resonance spectroscopy (De Stefano et al., 1995) is considered a biomarker of axonal integrity (McDonald et al., 1992; McDonald, 1994). Diffusion tensor imaging (DTI) derived axial diffusivity and radial diffusivity has been used to detect and distinguish axon and myelin abnormalities (Song et al., 2005; Kim et al., 2006; Sun et al., 2006a, b). However, all of these methods have drawbacks. MTR cannot distinguish disrupted myelin integrity from oedema or tissue loss (Vavasour et al., 2011). Not only myelin damage, but also axonal loss and macrophage infiltration can all contribute to MTR contrast (Dousset et al., 1995; Kimura et al., 1996; Samsonov et al., 2012). NAA might reflect a number of pathological processes in multiple sclerosis, such as reversible axonal damage due to inflammatory demyelination, altered neuronal/axonal metabolism, and oedema (Lovas et al., 2000; Cook, 2006). DTI is most accurate when applied to well-defined tightly packed white matter tracts without inflammation, as it is confounded by inflammation or crossing fibres (Naismith et al., 2010; Oh et al., 2013b). To address the limitations of current CNS imaging modalities, we developed diffusion basis spectrum imaging (DBSI) to model myelinated and unmyelinated axons as anisotropic diffusion tensors, and to model cells and oedema/extracellular space as isotropic diffusion tensors to simultaneously quantify axonal injury, demyelination and inflammation in the CNS (Wang et al., 2011b).
Materials and methods
Histological validation of DBSI using autopsy multiple sclerosis spinal cord specimens
To validate MRI-derived white matter pathological metrics, it is necessary to quantify corresponding histological staining of cross-sectional sections of white matter tracts via manual or automatic counting of axons, myelin sheaths, and nuclei. Autopsy spinal cord specimens are ideal for this purpose, whereas use of the complex white matter tracts with frequent bending, fanning and crossing tracts in brain tissues does not allow for such counting in an optimal cross-sectional fashion. Cervical spinal cord specimens were obtained following autopsy from three patients with multiple sclerosis. Post-mortem time until autopsy was within 10 h. The spinal cord tissues were fixed in 10% formalin in phosphate-buffered saline (PBS) at room temperature after autopsy. A segment of fixed cervical spinal cord was imaged and analysed using DBSI. The specimens were then embedded in paraffin and sectioned at 5-µm thick. Sections were individually stained with Bielschowsky’s silver, haematoxylin and eosin, and Luxol Fast Blue-Periodic Acid Schiff (LFB-PAS) stains. Images were acquired with a Hamamatsu NanoZoomer 2.0-HT System (Hamamatsu) using a ×40 objectives for analyses.
MRI of multiple sclerosis spinal cord specimens
The three multiple sclerosis cervical spinal cord tissues were examined using an Agilent DirectDrive console equipped with a 4.7 T magnet and a 15-cm inner diameter, actively shielded Magnex gradient coil (60 G/cm, 270 μs rise time). The tissue contained in a 3 ml syringe with 10% formalin was placed in a custom-made solenoid coil for data acquisition using the following parameters: repetition time 2 s, spin echo time 39 ms, time between application of gradient pulse 20 ms, diffusion gradient on time 8 ms, slice thickness 0.5 mm, number of slices 5, field-of-view 2.4 × 2.4 cm2, number of average 1, data matrix 96 × 96. Diffusion sensitizing gradients were applied in 99 directions as employed in human brain DBSI with max b-value = 3200 s/mm2. In-plane resolution was 250 × 250 µm2. The specimens were imaged at the ambient temperature of the magnet bore, ∼17°C, estimated using apparent diffusion coefficient of fixative (4% formalin) in which all specimens bathed.
Down-sampling high resolution histology images
ImageJ (http://rsbweb.nih.gov/ij/) with NDPI Tools plugin (Deroulers et al., 2013) was used to down-sample the raw high-resolution histology images. At ×40 magnification, the linear dimension of raw histology image pixels was 0.23 µm in contrast to 250 µm of MRI voxels. Thus, the raw histology image was down-sampled to match MRI voxel size, resulting in each down-sampled histology image voxel, containing 1087 × 1087 raw histology image pixels (voxel with black dashed line in Fig. 1A inset).
Figure 1.

Co-registration between histology and MRI. Raw histology images were down-sampled to MRI resolution. Each down-sampled MRI voxel contains 1087 × 1087 pixels in the raw high-resolution histology image (A, inset). Thirteen pairs of landmarks along the perimeter of the multiple sclerosis spinal cord were manually placed on the histology image (Bielschowsky’s silver, A), and magnetic resonance image (T2-weighted, B). The transformation matrix of rigid-body registration was computed in ImageJ and applied to warp the MRI to the orientation of the down-sampled histology image (C). Voxels were randomly selected in the spinal cord white matter on the down-sampled histology images (red squares in A). Sequential tissue sections were stained for axons (Bielschowsky’s silver), myelin (LFB-PAS) and cell nuclei (haematoxylin and eosin). The percentage of positively stained area for each stain was computed for each voxel, and compared with the magnetic resonance metrics within the same voxel (red squares in C).
Quantifying positive staining
For each autopsied spinal cord tissue, 25–35 down-sampled image voxels were randomly selected in spinal cord white matter (red squares in Fig. 1A). These down-sampled image voxels represent regions of interest in the raw high-resolution histology images containing 1087 × 1087 native image pixels. Positive staining was identified and manually counted withinthe selected down-sampled histology voxels by A.H.C. The fraction of positive stain area were computed as the ratiobetween the number of positive staining pixels and the total number of pixels (1087 × 1087) within the down-sampled histology voxel, i.e. equivalent of single MRI image voxel.
Co-registration between quantitative histology and DBSI maps
The rigid-body transformation was performed using a customized plugin in ImageJ (http://rsbweb.nih.gov/ij/) as previously described to co-register the quantified, down-sampled histology images with DBSI maps (Budde et al., 2007). Thirteen landmarks along the perimeter of the cord were manually placed on down-sampled histology (Fig. 1A) and T2-weighted images (Fig. 1B, inherently co-registered with DBSI maps) to compute the transformation matrix for matching the DBSI maps with down-sampled histology maps (Fig. 1C). Through successful image co-registration, the selected voxels on the down-sampled histology maps can be transferred to MRI (Fig. 1C). The quantitative positive histology staining can then be correlated with DBSI matrices on the randomly selected voxels.
There is a substantial difference in slice thickness between histology and MRI (histology sections were 5-µm thick, whereas MRI slice thickness was 500 µm). The 2D co-registration as performed could not address this discrepancy. Fortunately, MRI results showed that the T2-weighted lesions seen in all three autopsied tissue samples did not change in patterns through the three to five adjacent image slices, suggesting any mismatch in lesion distribution was likely to be minor in the present study.
Characterization of CNS pathologies in patients with multiple sclerosis
Human subjects
Procedures involving human subjects were all approved by the Institutional Review Board of Washington University. Every subject provided informed consent before their participation in the study. Five healthy control subjects were imaged to assess the effect of CSF contamination and crossing fibres on results from the selected MRI methods. Six patients with multiple sclerosis, including three with relapsing-remitting multiple sclerosis, two with secondary progressive multiple sclerosis, and one with primary progressive multiple sclerosis, were imaged to examine the capability of DBSI to characterize multiple sclerosis lesions. Specifically, one patient with relapsing-remitting multiple sclerosis [age 50, Expanded Disability Status Scale (EDSS) = 2.5, multiple sclerosis duration 16 years] and two patients with secondary progressive multiple sclerosis (age 50, EDSS = 4.0, with multiple sclerosis duration >20 years; and age 49, EDSS = 7.0, multiple sclerosis duration >17 years) were imaged to examine the DBSI/DTI profile of different types of multiple sclerosis lesions: persistent black hole (PBH), chronic T2-weighted hyperintensities that were non-black holes (NBH), and Gd+ lesions. Another two patients with relapsing-remitting multiple sclerosis and one patient with primary progressive multiple sclerosis were imaged to examine the correlation between the DBSI findings and MTR.
MRI of human subjects
A 3 T TIM Trio (Siemens) scanner with a 32-channel head coil (Siemens) was used for all image studies. Diffusion weighted MRI data were collected at 2 × 2 × 2 mm3 resolution in the axial plane covering the whole brain with repetition time/echo time = 10 000/120 ms. The 99-direction diffusion encoding scheme was selected as prescribed in diffusion spectrum imaging where the position vectors are the entire grid points (qx, qy, qz) over the 3D q-space under the relationship that (qx2 + qy2 + qz2) ≤ r2, where r = 3 for DBSI (Wedeen et al., 2005; Kuo et al., 2008). The maximum b-value was 2000 s/mm2. The total acquisition time using a single-shot diffusion-weighted EPI sequence was 15 min. Phase maps were collected after diffusion data acquisition to correct susceptibility artefacts. Diffusion-weighted images were then co-registered to the anatomical 3D magnetization prepared rapid acquisition of gradient echo (MPRAGE), and fluid attenuated inversion recovery (FLAIR) images using FLIRT (FMRIB’s Linear Registration Tool) (Jenkinson et al., 2002). The DTI maps of fractional anisotropy, axial diffusivity (λ|), and radial diffusivity (λ⊥), were computed using an in-house developed algorithm described previously (Budde et al., 2009). High-resolution 1 × 1 × 1 mm3 sagittal FLAIR images were used for multiple sclerosis lesion identification. T1-weighted MPRAGE images were acquired at 1 × 1 × 1 mm3 resolution for image registration and correction. For three patients with relapsing-remitting multiple sclerosis and the one patient with primary progressive multiple sclerosis, MTR (Gass et al., 1994) maps were obtained in addition to DBSI using a 3D spoiled gradient-echo sequence with and without a saturation pulse: repetition time/echo time = 41/11 ms, flip angle = 15°, field of view = 25.1 × 18.7 cm, 60 3-mm axial slices without gaps. The magnetization transfer saturation pulse provided on the Siemens 3 T Trio scanner was an off-resonance radio frequency pulse centred at 1.2 kHz below the water frequency, with a Gaussian envelope of 10 ms duration, a bandwidth of 100 Hz, and a flip angle of 500°. To calculate MTR, two independent scans were acquired, one with (MTon) and one without (MToff) the off-resonance radio frequency pulse. MTon was registered to MToff using a rigid-body procedure implemented in FLIRT. MTR was then calculated based on the formula: MTR = (MToff − MTon) / MToff. The MTR images were then co-registered to the anatomical 3D MPRAGE and FLAIR images using FLIRT.
Diffusion basis spectrum imaging
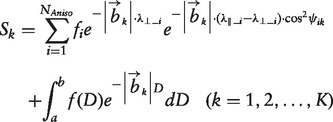
DBSI models diffusion weighted MRI signals as a linear combination of multiple tensors describing both the anisotropic axonal fibre and its surrounding environment, and a full range of isotropic components with varying diffusivities (Wang et al., 2011b)
 |
[1] |
where Sk and |bk| are the signal and b-value of the kth diffusion gradient, NAniso is the number of anisotropic tensors, ψik is the angle between the kth diffusion gradient and the principal direction of the ith anisotropic tensor, λ||_i and λ⊥_i are the axial diffusivity and radial diffusivity of the ith anisotropic tensor, fi is the signal intensity fraction for the ith anisotropic tensor, and a and b are the low and high diffusivity limits for the isotropic diffusion spectrum f(D). The anisotropic diffusion component represents the intra-axonal water molecules and those outside but adjacent to axon fibres, whether myelinated or non-myelinated. We denoted these anisotropic signal intensity fractions (fi) as fibre fractions. DBSI-derived fibre fraction, axial diffusivity and radial diffusivity reflected the integrity of white matter fibres comprising anisotropic diffusion components. Although the definitive classification of the spectrum of isotropic diffusion components has not yet been reached, previous experimental observations suggested that restricted isotropic (associating with cells) and non-restricted isotropic diffusion (associating with vasogenic oedema and tissue loss) may be distinguished using a threshold of isotropic diffusivity of 0.3 µm2/ms (Wang et al., 2011b, 2014; Chiang et al., 2014).
Generalized q-sampling imaging
Generalized q-sampling imaging (GQI) was recently proposed to estimate orientation distribution functions (ODF) directly from diffusion magnetic resonance signals based on the Fourier transform relation between diffusion weighted magnetic resonance signals and the underlying diffusion displacement (Yeh et al., 2010). Orientation distribution functions generated by GQI have demonstrated accuracy comparable to the widely used q-ball imaging (Tuch, 2004; Kuo et al., 2008) and diffusion spectrum imaging techniques (Wedeen et al., 2005, 2008, 2012). Tractography results from GQI were also shown to be comparable with those generated from q-ball imaging and diffusion spectrum imaging (Yeh et al., 2010). GQI does not require specific diffusion sampling schemes as needed for q-ball imaging (the shell sampling scheme) or diffusion spectrum imaging (the grid sampling scheme). Thus, we used GQI in this study to generate ODFs using the same diffusion weighted data that were used for DBSI. For GQI analyses herein, diffusion images were reconstructed with a diffusion sampling ratio of 1.25, the recommended parameter proposed by the original study (Yeh et al., 2010). The resulting ODFs have 642 sampling orientations, defined by 8-fold tessellated icosahedrons.
DBSI tractography
Modified whole brain streamlined fibre tracking (Wedeen et al., 2008) was conducted using the fibre orientations derived by DBSI. Starting locations of the tracts were randomly placed within the whole brain or selected region of interest. If more than one fibre was identified by DBSI, the initial direction was randomly chosen from the resolved crossing fibres. Trilinear interpolation was used to estimate the propagation direction. The step size was 0.5 mm (half of the spacing), and the maximum turning angle was 60°. DBSI-derived fibre fraction (≥15%) was used as the threshold to define a fibre. DBSI-derived fibre orientation was colour-coded following the convention in the field using DSI Studio (http://dsi-studio.labsolver.org) (Yeh et al., 2013).
Assessment of DBSI to alleviate partial volume effects and resolve crossing fibres in human brain
DTI, DBSI and GQI analyses were performed on whole brain diffusion weighted data sets from five healthy adult volunteers. In each subject, a voxel representing pure axonal fibres was placed at the centre of the corpus callosum, and a voxel with CSF contamination (partial volume effect) was placed in the corpus callosum bordering lateral ventricle. Three-dimensional diffusion ellipsoids were used to visualize and compare diffusion tensor characteristics of the image voxel using DTI and DBSI. Axial diffusivity and radial diffusivity were also computed by DTI/DBSI for comparisons. Similarly, fibre directions, axial and radial diffusivity of representative voxels placed at the point where the corona radiata crossed the corpus callosum were calculated by each method. The crossing-point axial diffusivity and radial diffusivity were compared to axial and radial diffusivity from the voxel representing pure corpus callosum and corona radiata. The GQI-derived fibre orientations were displayed using the 3D orientation distribution functions as described (Yeh et al., 2010).
Assessment of DBSI within a multiple sclerosis lesion and surrounding region
A multiple sclerosis lesion hyper-intense on FLAIR image of a patient with relapsing-remitting multiple sclerosis was selected to illustrate the confounding factors of crossing fibres and CSF contamination upon multiple sclerosis lesion analyses. The lesion was located in the corpus callosum but extended into the cingulum, passing through a region of fibre crossing. The lesion also bordered the lateral ventricle, a region susceptible to CSF partial volume effects. DBSI-based tractography was performed to identify the corpus callosum and the cingulum as they passed through the lesion. Six voxels were examined: three located within the FLAIR-identified lesion itself, and three outside of the lesion. The first voxel within the lesion was placed in the region where fibres of the corpus callosum crossed those of the cingulum. The second voxel was placed entirely in the corpus callosum region within the lesion. The third voxel within the lesion was placed such that it bordered the lateral ventricle. The other three voxels were distributed within the corpus callosum, but outside of the FLAIR-defined lesion sequentially further from the lesion.
Comparison of DBSI with MTR
MTR was performed on brains of two patients with relapsing-remitting multiple sclerosis and one with primary progressive multiple sclerosis. Forty-two regions of interest were manually delineated to include regions with MTR values from 0.04 to 0.4, representing areas ranging from T1-weighted hypointensities (‘black holes’) to normal-appearing white matter in the corpus callosum. Based on published literature, these would represent varying degrees of myelin integrity (Gass et al., 1994; Kucharczyk et al., 1994; Catalaa et al., 2000; Filippi and Rocca, 2004). MTR was compared with DBSI-derived metrics on all patients with multiple sclerosis, and correlations between MTR and DBSI-derived directional diffusivities, non-restricted isotropic fraction were examined.
Use of DBSI to characterize multiple sclerosis lesions
Sixteen multiple sclerosis lesions of three types, six PBHs, six NBHs T2-weighted hyperintensies, and four Gd+ lesions, were identified and manually outlined based on MPRAGE and FLAIR images in the two patients with secondary progressive multiple sclerosis and one with relapsing-remitting multiple sclerosis by an experienced neurologist (A.H.C.). Anatomically matched regions in healthy controls were delineated and analysed for comparisons. All PBH lesions were present on clinical MRIs for >1 year. Clinical MRIs of the three multiple sclerosis patients were obtained 3 and 4 weeks before DBSI scan. All patients had at least one Gd+ lesion and received corticosteroid treatment within days before DBSI. A voxel-based DBSI analysis was conducted on the 16 identified lesions and corresponding regions in the healthy control. A beeswarm plot (R Core Team, 2013) with different coloured symbols representing different patients, was made to show the data structure. A conventional boxplot was superimposed on the beeswarm plot to assess the pathological changes of lesions over the control.
Statistical analyses for correlations between histology measures and imaging indices and among imaging methods
To show that DBSI metrics and quantitative histology findings measure the same biological characteristics, although on different scales, Spearman’s rank correlation coefficients were used to measure the strength of monotone increasing or decreasing association. The associations of interest were DBSI fibre fraction or DBSI axial diffusivity with positive silver stain, DBSI radial diffusivity with positive Luxol Fast Blue stain and DBSI restricted isotropic diffusion fraction with positive haematoxylin stain. Measurements were taken in three multiple sclerosis spinal cord autopsy specimens. Spearman’s rank correlation coefficients were also used to test for presence of monotone increasing or decreasing association between DBSI radial diffusivity, DTI radial diffusivity, DBSI non-restricted isotropic diffusion fraction and MTR in three patients.
Results
DBSI correlated with quantitative histology
Bielschowsky’s silver (Fig. 1A), LFB-PAS and haematoxylin and eosin stained sections from three autopsy multiple sclerosis spinal cord specimens were co-registered with T2-weighted images (Fig. 1B) using a previously published method (Fig. 1C). In total 80 voxels were examined for association of positive histological staining area with the corresponding DBSI-derived metrics. DBSI fibre fraction correlated with the area of silver stain in all three specimens (Fig. 2A, E and I; r = 0.70, 0.83, 0.82; P = 0.00015, <0.0001, <0.0001, respectively), whereas DBSI axial diffusivity, a measure of axonal integrity, correlated with the area of silver stain within voxels only in the third specimen (Fig. 2B, F and J; r = 0.15, −0.04, 0.71; P = 0.48, 0.85, <0.0001, respectively). DBSI radial diffusivity negatively correlated with the area of Luxol Fast blue stain in all three specimens (Fig. 2C, G and K; r = −0.84, −0.42, −0.82; P < 0.0001, 0.039, <0.0001, respectively). DBSI restricted isotropic diffusion fraction correlated with the area of nuclei detected by haematoxylin stain in the first and third specimens (Fig. 2 D, H and L; r = 0.84, 0.25, 0.39; P < 0.0001, 0.23, 0.033, respectively). The lack of correlation in the second specimen and low correlation in the third specimen of haematoxylin area to DBSI restricted isotropic diffusion fraction are likely attributable to low numbers of cells in those spinal cord specimens.
Figure 2.

Correlations between histology measures and DBSI indices for three autopsy multiple sclerosis spinal cord specimens. Patient 1: red circle; Patient 2: yellow triangle; Patient 3: blue square. The area of positive silver staining correlated with DBSI fibre fraction in all three specimens (A, E and I). The area of positive silver staining correlated with one of the three specimens (J) but not the other two (B and F). The area of Luxol Fast Blue–Periodic Acid Schiff (LFB-PAS) staining correlated with DBSI radial diffusivity negatively in all three specimens (C, G and K). The area of positive haematoxylin staining correlated strongly with DBSI restricted diffusion fraction in one specimen (D), but not in the other two (H and L).
DBSI accurately measured diffusion properties of the corpus callosum despite CSF contamination
To determine the ability of DBSI to quantify axial diffusivity and radial diffusivity in the presence of CSF contamination, two image voxels from the corpus callosum of a healthy control subject were selected, one located in the centre of the genu to represent pure corpus callosum fibres and the second in a region containing both corpus callosum and lateral ventricle (Fig. 3). The orientations of axonal tracts derived by DTI, GQI and DBSI were also compared. Angles were defined in spherical coordinates ([θ, φ]: θ is the azimuthal angle in the x–y plane from the positive x-axis, φ is the elevation angle from x–y plane). The angles of the axonal fibres in the central genu derived by GQI, DTI and DBSI were almost identical: [θ, φ] = [−11°, 31°], [−10°, 28°], and [−10°, 28°], respectively. CSF contamination did not affect the angle assessments of the voxel-containing corpus callosum and ventricle, which was [θ, φ] = [−5°, 20°], [−6°, 22°], and [−6°, 21°] for GQI, DTI and DBSI, respectively. After quantitatively modelling the confounding isotropic diffusion tensor components due to cells and CSF, DBSI-derived axial and radial diffusivity for each of these voxels were indistinguishable: axial diffusivity = 1.78 versus 1.79 µm2/ms and radial diffusivity = 0.08 versus 0.10 µm2/ms in the central corpus callosum versus partly within the ventricle. In contrast, CSF contamination substantially altered DTI-derived axial and radial diffusivities, with axial diffusivity = 1.31 versus 1.61 µm2/ms, and radial diffusivity = 0.16 versus 0.58 µm2/ms for the region of interest in genu versus CSF-contaminated region of interest, respectively (Fig. 3). Using DBSI, restricted and non-restricted isotropic diffusion tensor fractions were compared in the two voxels. The restricted isotropic diffusion fraction comprised 10% of the pure fibre and 6% of the voxel with CSF contamination, and the non-restricted isotropic diffusion tensor fraction was 0% of the pure fibre voxel and 44% of the voxel containing CSF. Comparisons of regions of interest placed in centre of the genu of the corpus callosum with regions of interest placed partly in the corpus callosum and partly inthe ventricle were performed in five healthy control subjects using DBSI, with axial diffusivity and radial diffusivity derived (mean ± SD, n = 5): axial diffusivity = 1.79 ± 0.011 versus 1.79 ± 0.009 µm2/ms and radial diffusivity = 0.088 ± 0.018 versus 0.094 ± 0.012 µm2/ms for the pure and CSF-contaminated fibre tracts, respectively (Supplementary Fig. 1A and B, Supplementary Table 1).
Figure 3.

DBSI quantifies anisotropic (white matter tracts) diffusion tensor metrics in the presence of CSF. Colour-encoded fractional anisotropy map derived using DTI was computed on five healthy volunteers with the corpus callosum identified, as shown in the representative map (left column, outlined red). To demonstrate the effect of partial volume effect on diffusion MRI measurements, two image voxels representing pure axonal fibre tracts in corpus callosum (blue, located at the centre of the tract) and significant CSF contamination (orange, located at the border between corpus callosum and the third ventricle) were examined using the standard DTI, GQI and DBSI. Three-dimensional ellipsoids were used to visualize DTI- and DBSI-derived anisotropic diffusion tensors, with the long and short axes of the ellipsoid proportional to the ratio of axial diffusivity (λ ||) and radial diffusivity (λ┴). DBSI-derived isotropic diffusion tensors (associated with the partial volume effects from cellularity and CSF) can be visualized as 3D spheres, with the radius proportional to the mean diffusivity. Three-dimensional orientation distribution function was used to visualize the GQI-derived fibre angles. Although DTI correctly assessed the angle of the axonal fibre tracts in corpus callosum ([θ, φ] = [−10°, 28°]) and corpus callosum with CSF contamination ([θ, φ] = [−6°, 22°]), the derived axial diffusivity and radial diffusivity were significantly affected by the presence of CSF contamination (axial diffusivity = 1.31 versus 1.61 µm2/ms; radial diffusivity = 0.16 versus 0.58 µm2/ms). GQI-derived angles of pure corpus callosum ([θ, φ] = [−11°, 31°]) and corpus callosum with CSF ([θ, φ] = [−5°, 20°]) were comparable to those derived by DTI. Similarly, DBSI correctly determined the fibre angles for the two voxels, ([θ, φ] = [−10°, 28°] for pure corpus callosum, and [θ, φ] = [−6°, 21°] corpus callosum plus CSF), comparable to those derived by DTI and GQI. After correctly modelling the confounding isotropic components due to cells and CSF, DBSI-derived axial diffusivity and radial diffusivity determined by DBSI were comparable in pure corpus callosum and corpus callosum with CSF contamination (axial diffusivity = 1.78 versus 1.79 µm2/ms; radial diffusivity = 0.08 versus 0.10 µm2/ms). Consistent findings were observed in five healthy control subjects (axial diffusivity = 1.79 ± 0.011 versus 1.79 ± 0.009 µm2/ms; radial diffusivity = 0.088 ± 0.018 versus 0.094 ± 0.012 µm2/ms).
DBSI quantifies the directional diffusivities of crossing fibres
To test the ability of DBSI to resolve and assess directional diffusivities in tracts that crossed other tracts, the intersection of the corpus callosum and corona radiata was examined (Fig. 4). DBSI was compared to GQI, and to DTI. The ‘gold standard’ GQI resolved the crossing fibres, measuring fibre angles of corpus callosum ([θ, φ] = [174°, 39°]) and corona radiata ([θ, φ] = [−11°, 45°]) at the crossing point. DBSI arrived at similar orientations ([θ, φ] = [177°, 30°] for corpus callosum, and [θ, φ] = [−15°, 43°] for corona radiata). In contrast, DTI-derived diffusion tensors reflected the averaged diffusion profile of corpus callosum and corona radiata (axial diffusivity = 0.68 µm2/ms; radial diffusivity = 0.38 µm2/ms; [θ, φ] = [−7°, 30°]). Unlike GQI, DBSI was also able to quantify the fractions of anisotropic diffusion tensor components revealing 36% from corpus callosum, and 49% from corona radiata in the voxel. Additionally, restricted and non-restricted isotropic diffusion tensor fractions made up 4%, and 11% of the voxel, respectively. Using DBSI, the axial diffusivity of the corpus callosum was 1.74 µm2/ms and radial diffusivity was 0.09 µm2/ms, in close agreement with the results obtained for the voxel placed in genu of corpus callosum without crossing fibres (axial diffusivity = 1.81 µm2/ms and radial diffusivity = 0.09 µm2/ms). For the corona radiata, axial diffusivity was 1.79 µm2/ms and radial diffusivity was 0.17 µm2/ms, also consistent with the results obtained for a voxel placed in the corona radiata in a region without crossing fibres (axial diffusivity = 1.86 µm2/ms and radial diffusivity = 0.21 µm2/ms). This same process of comparing the pure corpus callosum diffusion results to those within the corpus callosum at the region of corona radiata crossing was performed in five healthy subjects, and showed (mean ± SD) axial diffusivity = 1.80 ± 0.01 versus 1.76 ± 0.03 µm2/ms and radial diffusivity = 0.11 ± 0.02 versus 0.11 ± 0.02 µm2/ms, respectively (Supplementary Table 2 and Supplementary Fig. 1C and D). Similarly, for pure corona radiata and for corona radiata fibres extricated from the region of crossing with the corpus callosum, axial diffusivity was 1.76 ± 0.08 versus 1.79 ± 0.01 µm2/ms and radial diffusivity was 0.23 ± 0.03 versus 0.20 ± 0.03 µm2/ms (Supplementary Fig. 1E and F).
Figure 4.

Effects of fibre crossing on DTI and its resolution using DBSI. Colour-encoded DTI-fractional anisotropy (left column) obtained from a healthy volunteer is displayed in coronal view to identify the region of fibre crossing between corpus callosum and corona radiata. DTI, GQI and DBSI analyses were performed on a voxel (green) within the region of fibre crossing, a voxel (orange) in the region of pure corona radiata, and a voxel (blue) in the region of pure corpus callosum. For the fibre crossing voxel (green), DTI-derived axial diffusivity (0.68 µm2/ms) and radial diffusivity (0.38 µm2/ms) reflected the averaged diffusion property of the fibres in the image voxel containing both the corpus callosum and corona radiata. Both DBSI and GQI accurately detected corpus callosum fibres crossing the corona radiata. Red arrows bisecting GQI’s orientation distribution function represents the direction of underlying fibre. DBSI further quantified the fraction of anisotropic components at 36% and 49%, corresponding to corpus callosum and corona radiata, respectively. Isotropic components of low diffusivity (presumed cells) and medium diffusivity (extracellular space) comprised 4% and 11% of the voxel, respectively. The axial diffusivity (1.74 µm2/ms) and radial diffusivity (0.09 µm2/ms) of the corpus callosum were in close agreement with the results obtained for the pure corpus callosum voxel (blue box, axial diffusivity = 1.81 µm2/ms; radial diffusivity = 0.09 µm2/ms). For corona radiata, axial diffusivity = 1.79 µm2/ms and radial diffusivity = 0.17 µm2/ms, also in close agreement with the results obtained for the pure corona radiata (orange box, axial diffusivity = 1.86 µm2/ms; radial diffusivity = 0.21 µm2/ms). Consistent findings were observed in all five healthy subjects.
DBSI characterization of a multiple sclerosis lesion confounded by crossing fibres and CSF contamination
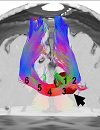
DBSI was performed on a large lesion located at the intersection of the corpus callosum and cingulum bordering the lateral ventricle, which was identified on FLAIR images in a patient with relapsing-remitting multiple sclerosis. Tracts identified by whole brain tractography were superimposed on a 3D iso-surface plot and the FLAIR image (lesion colour-coded in dark red in Fig. 5A; left, black arrow). Axial and radial diffusivity derived by DBSI revealed that decreased axial diffusivity was confined to voxels 1 and 2 within the lesion (Fig. 5B), whereas increased radial diffusivity was seen not only in voxels 1, 2 and 3 within the lesion, but also in voxel 4 (outside of the FLAIR-defined lesion) within normal-appearing corpus callosum nearest to the lesion (Fig. 5C). DBSI-derived anisotropic diffusion fraction (interpreted as fibre fraction; Fig. 5D) was within the normal range as seen in healthy control subjects except voxel 3 with significant CSF contamination (Fig. 5G). Likely due to the confounding effect of crossing fibres and CSF contamination, DTI-derived axial diffusivity failed to detect axonal injury inside the lesion (Fig. 5E). DTI-derived radial diffusivity increased in a trend similar to that of DBSI-derived radial diffusivity with different extent of change (Fig. 5F). Solid lines and dashed lines are the mean values and one standard deviation from mean derived from 600 corpus callosum voxels in a gender and age matched healthy subject.
Figure 5.

Characterization of fibre tract integrity in and out of a multiple sclerosis lesion. A large multiple sclerosis lesion located in the corpus callosum with extension into the cingulum was identified based on FLAIR hyper-intensity and MPRAGE hypo-intensity in a patient with relapsing-remitting multiple sclerosis. DBSI-based tractography was colour-coded based on the fibre orientation and superimposed on the FLAIR image to demonstrate the location of the lesion (dark red, A left). On the coronal view, six voxels were selected and labelled on the corpus callosum (A right). Voxels 1–3 were within the lesion (1 = central, 2 and 3 = peripheral). The corpus callosum (red tract) is crossed by the cingulum (green tract) in voxel 1. Voxel 3 borders the lateral ventricle. Voxels 4, 5 and 6 distributed sequentially further from the lesion within the corpus callosum. DBSI-derived axial diffusivity (B) showed reduction in voxels 1 and 2, whereas it was normal in voxels 3, 4, 5 and 6. DBSI-derived radial diffusivity (C) increased most in voxel 1, also elevated in voxels 2 and 3, and to a lesser extent in voxel 4 which was outside the lesion as defined by FLAIR. Thus, in this patient with relapsing-remitting multiple sclerosis, DBSI findings suggested that the axonal injury was only present at the centre of the lesion while demyelination was seen in the entire lesion and extending outside. Solid lines and dashed lines are the mean values and one standard deviation from mean derived from 600 corpus callosum voxels in a gender and age matched healthy subject. For comparison, DTI axial diffusivity (E) and radial diffusivity (F) are shown. DTI axial diffusivity failed to reflect the reduction shown by DBSI, especially in voxels 1 and 3 (partial volume effect from CSF in lateral ventricle). Lack of reduction in fibre fraction in voxels 1 and 2 (D) suggested little to no loss of axons in the region. Increased isotropic fraction (sum of both restricted and non-restricted isotropic diffusion fractions) in voxel 3, which abutted the ventricle, indicated contamination from CSF (G). S = superior; I = inferior; P = posterior; A = anterior; L = left; R = right.
Comparison of myelin biomarkers based on DBSI, MTR and DTI
Forty-two regions of interest were selected from three patients with multiple sclerosis to cover the whole range of MTR values, representing the spectrum of tissue integrity from normal appearing genu of the corpus callosum (Fig. 6A; top arrow, MTR ≈ 0.4) to a T2-weighted hyperintense FLAIR lesion that was also persistently hypointense on T1-weighted image for 3 years (a persistent ‘black hole’) (Fig. 6; lower arrow, MTR = 0.04). Radial diffusivity derived by both DBSI (Fig. 6B, E and H; r = −0.7, −0.58, −0.72; P = 0.008, 0.028, 0.006) and DTI (Fig. 6C, F and I; r = −0.71, −0.62, −0.81; P = 0.007, 0.019, 0.008) correlated negatively with MTR in all three patients. MTR also correlated with the DBSI-derived non-restricted isotropic diffusion fraction in all three patients (Fig. 6D, G and J; r = −0.71, −0.57, −0.83; P = 0.007, 0.035, 0.0004).
Figure 6.

Comparison of myelin imaging biomarkers as defined by DBSI, DTI and MTR. MTR (A) and FLAIR (B) images were used to guide the selection of 42 regions of interest with a wide range of MTR contrast in three multiple sclerosis patients. One region of interest adjacent to the posterior lateral ventricle (MTR = 0.04) and one region of interest are noted by white arrow heads in the normal-appearing corpus callosum (MTR ≈ 0.4). Reduced MTR correlated with increased DBSI radial diffusivity (B, E and H) and DTI radial diffusivity (C, F and I), in accordance with the idea that each of these three imaging biomarkers represents myelin integrity. MTR also correlated with DBSI non-restricted isotropic fraction (D, G and J), suggesting that MTR is also sensitive to increased water content, likely oedema and/or tissue loss. The red circle, yellow triangle, and blue squares indicated the data from Patients 1, 2 and 3, respectively.
Characterization of multiple sclerosis lesions using DBSI
Six PBHs, six NBHs, and four Gd+ lesions (1551 voxels) from three patients with multiple sclerosis were examined by DBSI. Patient 1 had early relapsing-remitting multiple sclerosis, and Patients 2 and 3 had secondary progressive multiple sclerosis. The restricted isotropic diffusion tensor fraction (Fig. 7A) was increased in Gd+ lesions compared to the control. The patient with early relapsing-remitting multiple sclerosis (Patient 1) had the largest number of voxels with increased restricted isotropic diffusion fraction characteristic of increased cellularity (Fig. 7A). Compared to normal control brains in the same regions, the restricted isotropic diffusion fraction decreased in PBH and NBH, whereas the DBSI non-restricted isotropic fraction increased in all three multiple sclerosis lesion types (Fig. 7B). DBSI axial diffusivity significantly decreased in PBH and NBH (Fig. 7C); DBSI axial diffusivity did not change significantly in Gd+ lesions. Consistent with literature reports, DTI axial diffusivity increased in all three lesion types compared to that of the control (Fig. 7D). Radial diffusivity derived by both DBSI and DTI increased in all multiple sclerosis lesion types (Fig. 7E and F).
Figure 7.

DBSI characterized and distinguished different types of multiple sclerosis lesions. (A) Gd+ lesions demonstrated increased restricted isotropic diffusion tensor fraction compared to PBH and NBH lesions. (B) PBH displayed increased non-restricted isotropic fraction. (C) Decreased DBSI axial diffusivity was observed in PBH and NBH, but not in Gd+ lesions. (D) DTI-derived axial diffusivity significantly increased in all types of lesions. (E) Both DBSI-derived radial diffusivity and (F) DTI-derived radial diffusivity significantly increased in lesions for all types of multiple sclerosis lesions compared to controls. The DBSI results suggested that PBH contained tissue loss, PBH and NBH contained axonal injury, and axonal injury was not present in acute Gd+ lesions. Both DBSI and DTI results indicated demyelination in all types of lesions. DTI-derived axial diffusivity was unable to distinguish different types of multiple sclerosis lesions. The blue, green and red dots indicated the data from Patients 1 (with relapsing-remitting multiple sclerosis) 2, and 3 (with secondary progressive multiple sclerosis). *P < 0.05.
Discussion
Imaging CNS inflammation remains a significant challenge. Gadolinium-based contrast agents in conjunction with T1-weighted MRI has been the primary clinical MRI tool for the detection of inflammation in multiple sclerosis through the detection of blood–brain barrier leakage (Grossman et al., 1988; Katz et al., 1993; Kappos et al., 1999; Vellinga et al., 2008). Ultrasmall superparamagnetic iron oxide (USPIO) nanoparticles have recently been demonstrated to detect CNS infiltrating monocyte/macrophages in research settings (Vellinga et al., 2008). PET ligands targeting the 18 kDa translocator protein, which is upregulated with inflammation, detect neuroinflammation in human diseases including multiple sclerosis and in animal models, but the effectiveness of these PET markers remains to be seen (Banati et al., 2000; Papadopoulos et al., 2006; Chauveau et al., 2009, 2011; Abourbeh et al., 2012; Xie et al., 2012). Promising advances in imaging myelination have been reported including myelin water imaging (MacKay et al., 1994; Du et al., 2007; Laule et al., 2008; Hwang et al., 2010; Prasloski et al., 2012), magnetization transfer (Inglese et al., 2003; Schmierer et al., 2004, 2007a; Dortch et al., 2011; Stikov et al., 2011; Underhill et al., 2011), optical imaging (Wang et al., 2011a) and myelin-specific PET markers (Wang et al., 2009; Wu et al., 2013). For specifically identifying axon injury and loss, reduced NAA content measured by magnetic resonance spectroscopy (MRS) has been used (De Stefano et al., 1999; Aboul-Enein et al., 2010; Wood et al., 2012). However, inflammation can interfere with measuring myelin and axons because inflammation-induced tissue swelling falsely reduces the measured myelin water and NAA content (oedema water contains no NAA and dilutes myelin water fraction), MTR (oedema water exhibits no transfer effect while contributing to the total signal), and PET marker intensity (diluting marker density) (Schmierer et al., 2004; Stanisz et al., 2004; McCreary et al., 2009; Vavasour et al., 2011). Despite that DTI-derived axial diffusivity and radial diffusivity can concurrently quantify co-existing axonal injury and demyelination in some settings (Song et al., 2002, 2003, 2005), DTI becomes inaccurate in the presence of inflammation (Sun et al., 2006b; Lodygensky et al., 2010; Xie et al., 2010), tissue loss (Kim et al., 2007), crossing fibres (Wheeler-Kingshott and Cercignani, 2009), and CSF contamination (Karampinos et al., 2008; Cheng et al., 2011) and cannot measure the inflammatory components. We thus developed DBSI and have previously accurately captured the severity of axonal injury, demyelination, and inflammation in white matter tracts from mouse models of CNS inflammatory demyelination (Wang et al., 2011b, 2014; Chiang et al., 2014).
Application of multiple imaging methods concurrently might be a way to detect and measure heterogeneous multiple sclerosis pathologies. However, this would be time-consuming and require more than one type of scanner. Moreover, determination of the relative weighting of each pathology component when using independent methods is tricky, because of the lack of a common reference to quantitatively decipher various interdependent contributions among underlying pathological components. DBSI pathology markers are derived using a single diffusion weighted, naturally co-registered MRI data set. Thus, it overcomes many of the deficiencies of other imaging methods to quantitatively identify and measure human CNS pathologies in vivo. The present studies indicated that DBSI can detect and quantify increased cellularity and oedema, reflecting cellular inflammation (without the use of gadolinium or the requirement of a breached blood–brain barrier) while simultaneously distinguishing and quantifying axon/myelin injury. Thus, DBSI can be used to document the sequence of pathological events in living multiple sclerosis patients revealing the temporal relationship between inflammation and axon/myelin injury by performing serial scans to follow the development of lesions from previously healthy tissues. A clear definition of the sequence of pathological events may shed light on the underlying mechanisms, e.g. inside-out versus outside-in, of individual lesions (Tsunoda and Fujinami, 2002; Geurts et al., 2009).
Considerable previous research effort has been devoted to developing a non-invasive MRI modality that is quantitative and specific to human CNS pathology. Currently available quantitative MRI techniques have been validated using standard histology (Mottershead et al., 2003; Schmierer et al., 2003, 2004, 2007a, b; Fisniku et al., 2009). However, a rigorously quantitative validation of magnetic resonance pathologic metrics has been relatively limited in part due to the difficulty to co-register quantitative histology findings with MRI. Here, we down-sampled high-resolution raw histology images from autopsied human multiple sclerosis spinal cord to match magnetic resonance images through a previously established co-registration procedure, allowing the exact co-localization of histology stains with the DBSI metrics (Fig. 1). We found that DBSI fibre fraction closely reflected residual axon content in white matter as revealed by Bielschowsky’s silver stain (Fig. 2). As silver stain detects both intact and injured axons, it was not unexpected that it correlated better with DBSI fibre fraction (reflecting total axon content) than DBSI axial diffusivity (reflecting the integrity of residual axons). Moreover, DBSI-derived radial diffusivity negatively correlated with myelin content as quantified by Luxol Fast Blue staining, and did so better than radial diffusivity measured by DTI. This finding is consistent with our previous study in an animal model of CNS inflammatory demyelination that radial diffusivity derived by DTI reflected both myelin integrity and extra-axonal water content; it was not specific for myelin integrity (Wang et al., 2011b, 2014; Chiang et al., 2014). Only one of the three autopsy spinal cord specimens exhibited significant correlation between haematoxylin-positive counts and restricted isotropic diffusion (Fig. 2), because the other two specimens exhibited limited inflammatory cell infiltration but with significant axon and myelin injury. Our interpretation of DBSI restricted isotropic fraction as a metric of cellularity is supported by its close correlation with 4’,6-diamidino-2-phenylindole (DAPI)-positive nuclear counts in animal models of inflammatory demyelination (Wang et al., 2011b; Chiang et al., 2014, Wang et al., 2014).
Fibre crossing is ubiquitous within the human brain; resolving crossing fibres is needed not only to attain accurate axial and radial diffusivity measures, but to perform anatomical connectivity studies with precision (Wedeen et al., 2012). However, up until now, the simultaneous quantitative assessment of diffusion properties of individual crossing tracts and any associated pathologies has proven elusive. Also, many multiple sclerosis lesions are periventricular (Lee et al., 1999; Filli et al., 2012). CSF contamination can therefore present an obstacle to precise measures when using diffusion imaging in these areas. Our results in healthy controls demonstrated that DBSI can remove structural confounds such as CSF contamination (Fig. 3) and crossing fibres (Fig. 4), and obtain accurate axial and radial diffusivity for resolved fibres. In the particular case of one multiple sclerosis lesion located at the crossing of corpus callosum and cingulum, bordering the ventricle, DBSI was able to more accurately detect white matter pathologies along the axonal tracts in corpus callosum after resolving fibre crossing and the partial volume effects from CSF contamination (Fig. 5).
MTR has been widely used to reflect myelin integrity (Schmierer et al., 2004). The increase of DBSI-derived radial diffusivity correlated well with MTR reductions in 42 regions of interest from three patients with multiple sclerosis (two with relapsing-remitting multiple sclerosis and one with primary progressive multiple sclerosis), a finding consistent with the notion that reduced MTR and increased radial diffusivity reflect demyelination. However, MTR reduction also correlated with DBSI non-restricted isotropic diffusion fraction. These data indicated that MTR was also sensitive to non-myelin related pathologies in multiple sclerosis. This is in accord with previous studies showing that MTR reduction is not only associated with demyelination but also is related to increased tissue water content (Vavasour et al., 2011). Similar to MTR, DTI radial diffusivity was affected by both myelin integrity and tissue water content, and was therefore also less specific than DBSI radial diffusivity (Wang et al., 2011b; Chiang et al., 2014).
Importantly, we observed that DBSI performed much better than DTI for determining axon injury (Wang et al., 2011b, 2014; Chiang et al., 2014). In the current study, we compared axial diffusivity derived using DBSI with DTI in Gd+ lesions, PBHs and NBHs. DBSI axial diffusivity decreased in all three lesion types but to varying extents. The reduction in DBSI-derived axial diffusivity reflected the axon injury severity that has been reported among the three types of lesions. That is, PBH exhibited the largest reduction in axial diffusivity among the three lesion types, consistent with the pathologically-supported notion that considerable axon damage underlies PBH (van Walderveen et al., 1998, 2001; van Waesberghe et al., 1999). Consistent with the most commonly seen DTI changes in multiple sclerosis lesions such as the increased axial and radial diffusivity, and the decreased fractional anisotropy (Naismith et al., 2013; Oh et al., 2013a), DTI-derived axial and radial diffusivity increased in all lesions. Thus, DTI axial diffusivity was not able to reflect the axon injury severity difference among lesion types. Similarly, DTI radial diffusivity was not able to discriminate myelin injury from oedema or tissue loss. DBSI is able to distinguish axon injury from axon loss through the estimated fibre fraction. Axon fibre fraction is a reflection of axon content in the image voxel, and in this regard provides similar information to NAA. Within an image voxel, the density of axons (i.e. fibre fraction) may be reduced because of the infiltration of cells or fluid (oedema). In contrast to NAA levels determined by spectroscopy, DBSI can account for whether the reduction in axon density is due to cellular infiltration and/or increased free water, and in what proportions, by quantitatively summing all voxels within the specific axonal tracts passing through a region. Thus, DBSI essentially provides axon counting without the need to biopsy tissues for histology.
In the present studies, we compared DBSI profiles of three multiple sclerosis lesions types: PBH, T2-weighted hyperintense NBH, and Gd+ lesions. Gd+ lesions displayed the greatest increase in restricted isotropic diffusion fraction. Gd+ lesions also had increased DBSI radial diffusivity suggestive of demyelination but, in comparison to other lesion types, decreased DBSI-derived axial diffusivity, interpreted as axonal injury, was minimal in the Gd+ lesions. According to our understanding of DBSI, these results indicate active inflammatory demyelination with only slight axonal injury in the Gd+ lesions studied in our subjects. Significantly increased DBSI non-restricted isotropic diffusion tensor fraction was the distinguishing feature of PBH lesions, suggesting severe tissue loss with increased free water in the PBHs.
DBSI is especially suitable for studying progressive multiple sclerosis. Although gadolinium-based contrast enhancement indirectly detects inflammation by detecting reduced integrity of the blood–brain barrier, which is observed secondary to inflammation in multiple sclerosis (Katz et al., 1993), Gd contrast usually does not detect inflammation associated with progressive multiple sclerosis. This is because the inflammation in progressive multiple sclerosis is less than in relapsing multiple sclerosis and often occurs in the absence of blood–brain barrier disruption (Lassmann, 2013). Thus, a quantitative non-invasive imaging method capable of detecting inflammation in the absence of blood–brain barrier breakdown would improve our understanding of the pathophysiology of progressive multiple sclerosis, in particular. Indeed, DBSI seems to be able to identify the cellular component of inflammation as restricted isotropic diffusion in the absence of Gd enhancement, and distinguish it from oedema or tissue loss, as shown by our ex vivo tissue analyses. As progressive multiple sclerosis currently lacks disease-modifying therapies, improved understanding of its pathogenesis as well as to provide a sensitive means for its monitoring was a major impetus for our development of DBSI. For example, DBSI could be used to monitor how cellular infiltration affects axon integrity over time, offering an opportunity to understand the reasons that axons are lost.
Despite the enhanced capability as demonstrated in this study, DBSI requires a larger number of diffusion-weighted images and higher signal-to-noise ratio than other MRI techniques. Currently, with diffusion-weighted echo planar imaging sequence available on 3.0 T clinical scanners, 99-direction human whole-brain DBSI scans can be completed within 15 min, making DBSI acquisition feasible for clinical scanning of patients with multiple sclerosis. The obtained signal-to-noise ratio of these diffusion data was sufficient to resolve partial volume effects due to fibre crossing, infiltrating cells, oedema, and CSF, while simultaneously quantifying the white matter fibre directional diffusivities. With emerging multi-band techniques (Moeller et al., 2010), DBSI scanning time will undoubtedly be further shortened, which would potentially allow higher spatial resolution and/or higher signal-to-noise ratio in future DBSI measurements. In addition, current DBSI is designed and validated for white matter imaging, and has not yet been perfected for grey matter. Thus, its application to grey matter and cortical demyelination in particular, remains to be established. Extending DBSI to model both white matter and grey matter and histologically validating its accuracy is currently our major focus.
In summary, the capability of DBSI to quantify multiple sub-voxel diffusion components confers an unprecedented ability for simultaneously providing multiple specific pathological biomarkers in multiple sclerosis lesions. Its longitudinal use in patients with multiple sclerosis could potentially improve the understanding and treatment stratification of the disease. DBSI has great potential for furthering the understanding and monitoring of multiple sclerosis and other human CNS diseases.
Acknowledgements
The authors would like to thank Samantha Lancia and Linda Hood for their help in the MRI acquisition, Fang-Cheng Yeh for his advice in GQI computation and Chia-Wen Chiang for help in histology images scanning. We thank the patients and healthy volunteers for their contributions.
Glossary
Abbreviations
- DTI
diffusion tensor imaging
- DBSI
diffusion basis spectrum imaging
- GQI
generalized q-sampling imaging
- MTR
magnetization transfer ratio
- NAA
N-acetyl aspartate
- PBH
persistent black holes
- NBH
non-black hole
Funding
This study was supported in part by the grants from National Institute of Health R01-NS047592 (S.-K.S.), P01-NS059560 (A.H.C.), National Multiple Sclerosis Society (NMSS) RG 4549A4/1 (S.-K.S.) and RG 5265A1 (Y.W.). AHC was supported in part by the Manny and Rosalyn Rosenthal-Dr. John Trotter multiple sclerosis Center Chair in Neuroimmunology of Barnes-Jewish Hospital Foundation. This research was also supported in part by NIH grants CO6 RR020092 and UL1 TR000448 (Washington University Institute of Clinical and Translational Sciences - Brain, Behavioral and Performance Unit).
Supplementary material
Supplementary material is available at Brain online.
References
- Aboul-Enein F, Krssak M, Hoftberger R, Prayer D, Kristoferitsch W. Reduced NAA-levels in the NAWM of patients with MS is a feature of progression. A study with quantitative magnetic resonance spectroscopy at 3 Tesla. PLoS One. 2010;5:e11625. doi: 10.1371/journal.pone.0011625. [DOI] [PMC free article] [PubMed] [Google Scholar]
- Abourbeh G, Theze B, Maroy R, Dubois A, Brulon V, Fontyn Y, et al. Imaging microglial/macrophage activation in spinal cords of experimental autoimmune encephalomyelitis rats by positron emission tomography using the mitochondrial 18 kDa translocator protein radioligand [(1)(8)F]DPA-714. J Neurosci. 2012;32:5728–36. doi: 10.1523/JNEUROSCI.2900-11.2012. [DOI] [PMC free article] [PubMed] [Google Scholar]
- Banati RB, Newcombe J, Gunn RN, Cagnin A, Turkheimer F, Heppner F, et al. The peripheral benzodiazepine binding site in the brain in multiple sclerosis: quantitative in vivo imaging of microglia as a measure of disease activity. Brain. 2000;123 (Pt 11):2321–37. doi: 10.1093/brain/123.11.2321. [DOI] [PubMed] [Google Scholar]
- Budde MD, Xie M, Cross AH, Song SK. Axial diffusivity is the primary correlate of axonal injury in the experimental autoimmune encephalomyelitis spinal cord: a quantitative pixelwise analysis. J Neurosci. 2009;29:2805–13. doi: 10.1523/JNEUROSCI.4605-08.2009. [DOI] [PMC free article] [PubMed] [Google Scholar]
- Catalaa I, Grossman RI, Kolson DL, Udupa JK, Nyul LG, Wei L, et al. Multiple sclerosis: magnetization transfer histogram analysis of segmented normal-appearing white matter. Radiology. 2000;216:351–5. doi: 10.1148/radiology.216.2.r00au16351. [DOI] [PubMed] [Google Scholar]
- Chauveau F, Boutin H, Van Camp N, Thominiaux C, Hantraye P, Rivron L, et al. In vivo imaging of neuroinflammation in the rodent brain with [11C]SSR180575, a novel indoleacetamide radioligand of the translocator protein (18 kDa) Eur J Nucl Med Mol Imaging. 2011;38:509–14. doi: 10.1007/s00259-010-1628-5. [DOI] [PubMed] [Google Scholar]
- Chauveau F, Van Camp N, Dolle F, Kuhnast B, Hinnen F, Damont A, et al. Comparative evaluation of the translocator protein radioligands 11C-DPA-713, 18F-DPA-714, and 11C-PK11195 in a rat model of acute neuroinflammation. J Nucl Med. 2009;50:468–76. doi: 10.2967/jnumed.108.058669. [DOI] [PubMed] [Google Scholar]
- Cheng YW, Chung HW, Chen CY, Chou MC. Diffusion tensor imaging with cerebrospinal fluid suppression and signal-to-noise preservation using acquisition combining fluid-attenuated inversion recovery and conventional imaging: comparison of fiber tracking. Eur J Radiol. 2011;79:113–7. doi: 10.1016/j.ejrad.2009.12.032. [DOI] [PubMed] [Google Scholar]
- Chiang CC, Wang Y, Sun P, Lin TH, Trinkaus K, Cross AH, et al. Quantifying white matter tract diffusion parameters in the presence of increased extra-fiber cellularity and vasogenic edema. Neuroimage. 2014;101:310–9. doi: 10.1016/j.neuroimage.2014.06.064. [DOI] [PMC free article] [PubMed] [Google Scholar]
- Cook SD. 4th edn. New York: Taylor & Francis; 2006. Handbook of multiple sclerosis. [Google Scholar]
- De Stefano N, Matthews PM, Arnold DL. Reversible decreases in N-acetylaspartate after acute brain injury. Magn Reson Med. 1995;34:721–7. doi: 10.1002/mrm.1910340511. [DOI] [PubMed] [Google Scholar]
- De Stefano N, Narayanan S, Matthews PM, Francis GS, Antel JP, Arnold DL. In vivo evidence for axonal dysfunction remote from focal cerebral demyelination of the type seen in multiple sclerosis. Brain. 1999;122 (Pt 10):1933–9. doi: 10.1093/brain/122.10.1933. [DOI] [PubMed] [Google Scholar]
- Deroulers C, Ameisen D, Badoual M, Gerin C, Granier A, Lartaud M. Analyzing huge pathology images with open source software. Diagn Pathol. 2013;8:92. doi: 10.1186/1746-1596-8-92. [DOI] [PMC free article] [PubMed] [Google Scholar]
- Dortch RD, Li K, Gochberg DF, Welch EB, Dula AN, Tamhane AA, et al. Quantitative magnetization transfer imaging in human brain at 3 T via selective inversion recovery. Magn Reson Med. 2011;66:1346–52. doi: 10.1002/mrm.22928. [DOI] [PMC free article] [PubMed] [Google Scholar]
- Dousset V, Brochet B, Vital A, Gross C, Benazzouz A, Boullerne A, et al. Lysolecithin-induced demyelination in primates: preliminary in vivo study with MR and magnetization transfer. Am J Neuroradiol. 1995;16:225–31. [PMC free article] [PubMed] [Google Scholar]
- Du YP, Chu R, Hwang D, Brown MS, Kleinschmidt-DeMasters BK, Singel D, et al. Fast multislice mapping of the myelin water fraction using multicompartment analysis of T2* decay at 3T: a preliminary postmortem study. Magn Reson Med. 2007;58:865–70. doi: 10.1002/mrm.21409. [DOI] [PubMed] [Google Scholar]
- Filippi M, Rocca MA. Magnetization transfer magnetic resonance imaging in the assessment of neurological diseases. J Neuroimaging. 2004;14:303–13. doi: 10.1177/1051228404265708. [DOI] [PubMed] [Google Scholar]
- Filli L, Hofstetter L, Kuster P, Traud S, Mueller-Lenke N, Naegelin Y, et al. Spatiotemporal distribution of white matter lesions in relapsing-remitting and secondary progressive multiple sclerosis. Mult Scler. 2012;18:1577–84. doi: 10.1177/1352458512442756. [DOI] [PubMed] [Google Scholar]
- Fisniku LK, Altmann DR, Cercignani M, Tozer DJ, Chard DT, Jackson JS, et al. Magnetization transfer ratio abnormalities reflect clinically relevant grey matter damage in multiple sclerosis. Mult Scler. 2009;15:668–77. doi: 10.1177/1352458509103715. [DOI] [PMC free article] [PubMed] [Google Scholar]
- Gass A, Barker GJ, Kidd D, Thorpe JW, MacManus D, Brennan A, et al. Correlation of magnetization transfer ratio with clinical disability in multiple sclerosis. Ann Neurol. 1994;36:62–7. doi: 10.1002/ana.410360113. [DOI] [PubMed] [Google Scholar]
- Geurts JJ, Stys PK, Minagar A, Amor S, Zivadinov R. Gray matter pathology in (chronic) MS: modern views on an early observation. J Neurol Sci. 2009;282:12–20. doi: 10.1016/j.jns.2009.01.018. [DOI] [PubMed] [Google Scholar]
- Grossman RI, Braffman BH, Brorson JR, Goldberg HI, Silberberg DH, Gonzalez-Scarano F. Multiple sclerosis: serial study of gadolinium-enhanced MR imaging. Radiology. 1988;169:117–22. doi: 10.1148/radiology.169.1.3420246. [DOI] [PubMed] [Google Scholar]
- Hwang D, Kim DH, Du YP. In vivo multi-slice mapping of myelin water content using T2* decay. Neuroimage. 2010;52:198–204. doi: 10.1016/j.neuroimage.2010.04.023. [DOI] [PubMed] [Google Scholar]
- Inglese M, van Waesberghe JH, Rovaris M, Beckmann K, Barkhof F, Hahn D, et al. The effect of interferon beta-1b on quantities derived from MT MRI in secondary progressive MS. Neurology. 2003;60:853–60. doi: 10.1212/01.wnl.0000049929.27032.29. [DOI] [PubMed] [Google Scholar]
- Jenkinson M, Bannister P, Brady M, Smith S. Improved optimization for the robust and accurate linear registration and motion correction of brain images. Neuroimage. 2002;17:825–41. doi: 10.1016/s1053-8119(02)91132-8. [DOI] [PubMed] [Google Scholar]
- Kappos L, Moeri D, Radue EW, Schoetzau A, Schweikert K, Barkhof F, et al. Predictive value of gadolinium-enhanced magnetic resonance imaging for relapse rate and changes in disability or impairment in multiple sclerosis: a meta-analysis. Gadolinium MRI Meta-analysis Group. Lancet. 1999;353:964–9. doi: 10.1016/s0140-6736(98)03053-0. [DOI] [PubMed] [Google Scholar]
- Karampinos DC, Van AT, Olivero WC, Georgiadis JG, Sutton BP. High resolution reduced-FOV diffusion tensor imaging of the human pons with multi-shot variable density spiral at 3T. Conf Proc IEEE Eng Med Biol Soc. 2008;2008:5761–4. doi: 10.1109/IEMBS.2008.4650523. [DOI] [PubMed] [Google Scholar]
- Katz D, Taubenberger JK, Cannella B, McFarlin DE, Raine CS, McFarland HF. Correlation between magnetic resonance imaging findings and lesion development in chronic, active multiple sclerosis. Ann Neurol. 1993;34:661–9. doi: 10.1002/ana.410340507. [DOI] [PubMed] [Google Scholar]
- Kim JH, Budde MD, Liang HF, Klein RS, Russell JH, Cross AH, et al. Detecting axon damage in spinal cord from a mouse model of multiple sclerosis. Neurobiol Dis. 2006;21:626–32. doi: 10.1016/j.nbd.2005.09.009. [DOI] [PubMed] [Google Scholar]
- Kim JH, Loy DN, Liang HF, Trinkaus K, Schmidt RE, Song SK. Noninvasive diffusion tensor imaging of evolving white matter pathology in a mouse model of acute spinal cord injury. Magn Reson Med. 2007;58:253–60. doi: 10.1002/mrm.21316. [DOI] [PubMed] [Google Scholar]
- Kimura H, Grossman RI, Lenkinski RE, Gonzalez-Scarano F. Proton MR spectroscopy and magnetization transfer ratio in multiple sclerosis: correlative findings of active versus irreversible plaque disease. Am J Neuroradiol. 1996;17:1539–47. [PMC free article] [PubMed] [Google Scholar]
- Kucharczyk W, Macdonald PM, Stanisz GJ, Henkelman RM. Relaxivity and magnetization-transfer of white-matter lipids at mr-imaging - importance of cerebrosides and Ph. Radiology. 1994;192:521–9. doi: 10.1148/radiology.192.2.8029426. [DOI] [PubMed] [Google Scholar]
- Kuo LW, Chen JH, Wedeen VJ, Tseng WY. Optimization of diffusion spectrum imaging and q-ball imaging on clinical MRI system. Neuroimage. 2008;41:7–18. doi: 10.1016/j.neuroimage.2008.02.016. [DOI] [PubMed] [Google Scholar]
- Lassmann H. Pathology and disease mechanisms in different stages of multiple sclerosis. J Neurol Sci. 2013;333:1–4. doi: 10.1016/j.jns.2013.05.010. [DOI] [PubMed] [Google Scholar]
- Laule C, Kozlowski P, Leung E, Li DK, Mackay AL, Moore GR. Myelin water imaging of multiple sclerosis at 7 T: correlations with histopathology. Neuroimage. 2008;40:1575–80. doi: 10.1016/j.neuroimage.2007.12.008. [DOI] [PubMed] [Google Scholar]
- Lee MA, Smith S, Palace J, Narayanan S, Silver N, Minicucci L, et al. Spatial mapping of T2 and gadolinium-enhancing T1 lesion volumes in multiple sclerosis: evidence for distinct mechanisms of lesion genesis? Brain. 1999;122(Pt 7):1261–70. doi: 10.1093/brain/122.7.1261. [DOI] [PubMed] [Google Scholar]
- Lodygensky GA, West T, Stump M, Holtzman DM, Inder TE, Neil JJ. In vivo MRI analysis of an inflammatory injury in the developing brain. Brain Behav Immun. 2010;24:759–67. doi: 10.1016/j.bbi.2009.11.005. [DOI] [PMC free article] [PubMed] [Google Scholar]
- Lovas G, Szilagyi N, Majtenyi K, Palkovits M, Komoly S. Axonal changes in chronic demyelinated cervical spinal cord plaques. Brain. 2000;123(Pt 2):308–17. doi: 10.1093/brain/123.2.308. [DOI] [PubMed] [Google Scholar]
- MacKay A, Whittall K, Adler J, Li D, Paty D, Graeb D. In vivo visualization of myelin water in brain by magnetic resonance. Magn Reson Med. 1994;31:673–7. doi: 10.1002/mrm.1910310614. [DOI] [PubMed] [Google Scholar]
- Matthews PM, Francis G, Antel J, Arnold DL. Proton magnetic resonance spectroscopy for metabolic characterization of plaques in multiple sclerosis. Neurology. 1991;41:1251–6. doi: 10.1212/wnl.41.8.1251. [DOI] [PubMed] [Google Scholar]
- McCreary CR, Bjarnason TA, Skihar V, Mitchell JR, Yong VW, Dunn JF. Multiexponential T2 and magnetization transfer MRI of demyelination and remyelination in murine spinal cord. Neuroimage. 2009;45:1173–82. doi: 10.1016/j.neuroimage.2008.12.071. [DOI] [PMC free article] [PubMed] [Google Scholar]
- McDonald WI. Rachelle Fishman-Matthew Moore Lecture. The pathological and clinical dynamics of multiple sclerosis. J Neuropathol Exp Neurol. 1994;53:338–43. doi: 10.1097/00005072-199407000-00003. [DOI] [PubMed] [Google Scholar]
- McDonald WI, Miller DH, Barnes D. The pathological evolution of multiple sclerosis. Neuropathol Appl Neurobiol. 1992;18:319–34. doi: 10.1111/j.1365-2990.1992.tb00794.x. [DOI] [PubMed] [Google Scholar]
- Moeller S, Yacoub E, Olman CA, Auerbach E, Strupp J, Harel N, et al. Multiband multislice GE-EPI at 7 tesla, with 16-fold acceleration using partial parallel imaging with application to high spatial and temporal whole-brain fMRI. Magn Reson Med. 2010;63:1144–53. doi: 10.1002/mrm.22361. [DOI] [PMC free article] [PubMed] [Google Scholar]
- Mottershead JP, Schmierer K, Clemence M, Thornton JS, Scaravilli F, Barker GJ, et al. High field MRI correlates of myelin content and axonal density in multiple sclerosis—a post-mortem study of the spinal cord. J Neurol. 2003;250:1293–301. doi: 10.1007/s00415-003-0192-3. [DOI] [PubMed] [Google Scholar]
- Naismith RT, Xu J, Klawiter EC, Lancia S, Tutlam NT, Wagner JM, et al. Spinal cord tract diffusion tensor imaging reveals disability substrate in demyelinating disease. Neurology. 2013;80:2201–9. doi: 10.1212/WNL.0b013e318296e8f1. [DOI] [PMC free article] [PubMed] [Google Scholar]
- Naismith RT, Xu J, Tutlam NT, Trinkaus K, Cross AH, Song SK. Radial diffusivity in remote optic neuritis discriminates visual outcomes. Neurology. 2010;74:1702–10. doi: 10.1212/WNL.0b013e3181e0434d. [DOI] [PMC free article] [PubMed] [Google Scholar]
- Oh J, Saidha S, Chen M, Smith SA, Prince J, Jones C, et al. Spinal cord quantitative MRI discriminates between disability levels in multiple sclerosis. Neurology. 2013a;80:540–7. doi: 10.1212/WNL.0b013e31828154c5. [DOI] [PMC free article] [PubMed] [Google Scholar]
- Oh J, Zackowski K, Chen M, Newsome S, Saidha S, Smith SA, et al. Multiparametric MRI correlates of sensorimotor function in the spinal cord in multiple sclerosis. Mult Scler. 2013b;19:427–35. doi: 10.1177/1352458512456614. [DOI] [PMC free article] [PubMed] [Google Scholar]
- Papadopoulos V, Baraldi M, Guilarte TR, Knudsen TB, Lacapere JJ, Lindemann P, et al. Translocator protein (18kDa): new nomenclature for the peripheral-type benzodiazepine receptor based on its structure and molecular function. Trends Pharmacol Sci. 2006;27:402–9. doi: 10.1016/j.tips.2006.06.005. [DOI] [PubMed] [Google Scholar]
- Prasloski T, Rauscher A, Mackay AL, Hodgson M, Vavasour IM, Laule C, et al. Rapid whole cerebrum myelin water imaging using a 3D GRASE sequence. Neuroimage. 2012;63:533–9. doi: 10.1016/j.neuroimage.2012.06.064. [DOI] [PubMed] [Google Scholar]
- Samsonov A, Alexander AL, Mossahebi P, Wu YC, Duncan ID, Field AS. Quantitative MR imaging of two-pool magnetization transfer model parameters in myelin mutant shaking pup. Neuroimage. 2012;62:1390–8. doi: 10.1016/j.neuroimage.2012.05.077. [DOI] [PMC free article] [PubMed] [Google Scholar]
- Schmierer K, Scaravilli F, Altmann DR, Barker GJ, Miller DH. Magnetization transfer ratio and myelin in postmortem multiple sclerosis brain. Ann Neurol. 2004;56:407–15. doi: 10.1002/ana.20202. [DOI] [PubMed] [Google Scholar]
- Schmierer K, Scaravilli F, Barker GJ, Gordon R, MacManus DG, Miller DH. Stereotactic co-registration of magnetic resonance imaging and histopathology in post-mortem multiple sclerosis brain. Neuropathol Appl Neurobiol. 2003;29:596–601. doi: 10.1046/j.0305-1846.2003.00497.x. [DOI] [PubMed] [Google Scholar]
- Schmierer K, Tozer DJ, Scaravilli F, Altmann DR, Barker GJ, Tofts PS, et al. Quantitative magnetization transfer imaging in postmortem multiple sclerosis brain. J Magn Reson Imaging. 2007a;26:41–51. doi: 10.1002/jmri.20984. [DOI] [PMC free article] [PubMed] [Google Scholar]
- Schmierer K, Wheeler-Kingshott CA, Boulby PA, Scaravilli F, Altmann DR, Barker GJ, et al. Diffusion tensor imaging of post mortem multiple sclerosis brain. Neuroimage. 2007b;35:467–77. doi: 10.1016/j.neuroimage.2006.12.010. [DOI] [PMC free article] [PubMed] [Google Scholar]
- Song SK, Sun SW, Ju WK, Lin SJ, Cross AH, Neufeld AH. Diffusion tensor imaging detects and differentiates axon and myelin degeneration in mouse optic nerve after retinal ischemia. Neuroimage. 2003;20:1714–22. doi: 10.1016/j.neuroimage.2003.07.005. [DOI] [PubMed] [Google Scholar]
- Song SK, Sun SW, Ramsbottom MJ, Chang C, Russell J, Cross AH. Dysmyelination revealed through MRI as increased radial (but unchanged axial) diffusion of water. Neuroimage. 2002;17:1429–36. doi: 10.1006/nimg.2002.1267. [DOI] [PubMed] [Google Scholar]
- Song SK, Yoshino J, Le TQ, Lin SJ, Sun SW, Cross AH, et al. Demyelination increases radial diffusivity in corpus callosum of mouse brain. Neuroimage. 2005;26:132–40. doi: 10.1016/j.neuroimage.2005.01.028. [DOI] [PubMed] [Google Scholar]
- Stanisz GJ, Webb S, Munro CA, Pun T, Midha R. MR properties of excised neural tissue following experimentally induced inflammation. Magn Reson Med. 2004;51:473–9. doi: 10.1002/mrm.20008. [DOI] [PubMed] [Google Scholar]
- Stikov N, Perry LM, Mezer A, Rykhlevskaia E, Wandell BA, Pauly JM, et al. Bound pool fractions complement diffusion measures to describe white matter micro and macrostructure. Neuroimage. 2011;54:1112–21. doi: 10.1016/j.neuroimage.2010.08.068. [DOI] [PMC free article] [PubMed] [Google Scholar]
- Sun SW, Liang HF, Le TQ, Armstrong RC, Cross AH, Song SK. Differential sensitivity of in vivo and ex vivo diffusion tensor imaging to evolving optic nerve injury in mice with retinal ischemia. Neuroimage. 2006a;32:1195–204. doi: 10.1016/j.neuroimage.2006.04.212. [DOI] [PubMed] [Google Scholar]
- Sun SW, Liang HF, Trinkaus K, Cross AH, Armstrong RC, Song SK. Noninvasive detection of cuprizone induced axonal damage and demyelination in the mouse corpus callosum. Magn Reson Med. 2006b;55:302–8. doi: 10.1002/mrm.20774. [DOI] [PubMed] [Google Scholar]
- R Core Team. 2013. R: a language and environment for statistical computing. R Foundation for Statistical Computing, Vienna, Austria. http://www.R-project.org/ [Google Scholar]
- Tsunoda I, Fujinami RS. Inside-Out versus Outside-In models for virus induced demyelination: axonal damage triggering demyelination. Springer Semin Immunopathol. 2002;24:105–25. doi: 10.1007/s00281-002-0105-z. [DOI] [PMC free article] [PubMed] [Google Scholar]
- Tuch DS. Q-ball imaging. Magn Reson Med. 2004;52:1358–72. doi: 10.1002/mrm.20279. [DOI] [PubMed] [Google Scholar]
- Underhill HR, Rostomily RC, Mikheev AM, Yuan C, Yarnykh VL. Fast bound pool fraction imaging of the in vivo rat brain: association with myelin content and validation in the C6 glioma model. Neuroimage. 2011;54:2052–65. doi: 10.1016/j.neuroimage.2010.10.065. [DOI] [PMC free article] [PubMed] [Google Scholar]
- van Waesberghe JH, Kamphorst W, De Groot CJ, van Walderveen MA, Castelijns JA, Ravid R, et al. Axonal loss in multiple sclerosis lesions: magnetic resonance imaging insights into substrates of disability. Ann Neurol. 1999;46:747–54. doi: 10.1002/1531-8249(199911)46:5<747::aid-ana10>3.3.co;2-w. [DOI] [PubMed] [Google Scholar]
- van Walderveen MA, Kamphorst W, Scheltens P, van Waesberghe JH, Ravid R, Valk J, et al. Histopathologic correlate of hypointense lesions on T1-weighted spin-echo MRI in multiple sclerosis. Neurology. 1998;50:1282–8. doi: 10.1212/wnl.50.5.1282. [DOI] [PubMed] [Google Scholar]
- van Walderveen MA, Lycklama ANGJ, Ader HJ, Jongen PJ, Polman CH, Castelijns JA, et al. Hypointense lesions on T1-weighted spin-echo magnetic resonance imaging: relation to clinical characteristics in subgroups of patients with multiple sclerosis. Arch Neurol. 2001;58:76–81. doi: 10.1001/archneur.58.1.76. [DOI] [PubMed] [Google Scholar]
- Vavasour IM, Laule C, Li DK, Traboulsee AL, MacKay AL. Is the magnetization transfer ratio a marker for myelin in multiple sclerosis? J Magn Reson Imaging. 2011;33:713–8. doi: 10.1002/jmri.22441. [DOI] [PubMed] [Google Scholar]
- Vellinga MM, Oude Engberink RD, Seewann A, Pouwels PJ, Wattjes MP, van der Pol SM, et al. Pluriformity of inflammation in multiple sclerosis shown by ultra-small iron oxide particle enhancement. Brain. 2008;131(Pt 3):800–7. doi: 10.1093/brain/awn009. [DOI] [PubMed] [Google Scholar]
- Wang C, Wu C, Popescu DC, Zhu J, Macklin WB, Miller RH, et al. Longitudinal near-infrared imaging of myelination. J Neurosci. 2011a;31:2382–90. doi: 10.1523/JNEUROSCI.2698-10.2011. [DOI] [PMC free article] [PubMed] [Google Scholar]
- Wang X, Cusick MF, Wang Y, Sun P, Libbey JE, Trinkaus K, et al. Diffusion basis spectrum imaging detects and distinguishes coexisting subclinical inflammation, demyelination and axonal injury in experimental autoimmune encephalomyelitis mice. NMR Biomed. 2014;27:843–52. doi: 10.1002/nbm.3129. [DOI] [PMC free article] [PubMed] [Google Scholar]
- Wang Y, Wang Q, Haldar JP, Yeh FC, Xie M, Sun P, et al. Quantification of increased cellularity during inflammatory demyelination. Brain. 2011b;134(Pt 12):3590–601. doi: 10.1093/brain/awr307. [DOI] [PMC free article] [PubMed] [Google Scholar]
- Wang Y, Wu C, Caprariello AV, Somoza E, Zhu W, Wang C, et al. In vivo quantification of myelin changes in the vertebrate nervous system. J Neurosci. 2009;29:14663–9. doi: 10.1523/JNEUROSCI.4082-08.2009. [DOI] [PMC free article] [PubMed] [Google Scholar]
- Wedeen VJ, Hagmann P, Tseng WY, Reese TG, Weisskoff RM. Mapping complex tissue architecture with diffusion spectrum magnetic resonance imaging. Magn Reson Med. 2005;54:1377–86. doi: 10.1002/mrm.20642. [DOI] [PubMed] [Google Scholar]
- Wedeen VJ, Rosene DL, Wang R, Dai G, Mortazavi F, Hagmann P, et al. The geometric structure of the brain fiber pathways. Science. 2012;335:1628–34. doi: 10.1126/science.1215280. [DOI] [PMC free article] [PubMed] [Google Scholar]
- Wedeen VJ, Wang RP, Schmahmann JD, Benner T, Tseng WY, Dai G, et al. Diffusion spectrum magnetic resonance imaging (DSI) tractography of crossing fibers. Neuroimage. 2008;41:1267–77. doi: 10.1016/j.neuroimage.2008.03.036. [DOI] [PubMed] [Google Scholar]
- Wheeler-Kingshott CA, Cercignani M. About “axial” and “radial” diffusivities. Magn Reson Med. 2009;61:1255–60. doi: 10.1002/mrm.21965. [DOI] [PubMed] [Google Scholar]
- Wood ET, Ronen I, Techawiboonwong A, Jones CK, Barker PB, Calabresi P, et al. Investigating axonal damage in multiple sclerosis by diffusion tensor spectroscopy. J Neurosci. 2012;32:6665–9. doi: 10.1523/JNEUROSCI.0044-12.2012. [DOI] [PMC free article] [PubMed] [Google Scholar]
- Wu C, Zhu J, Baeslack J, Zaremba A, Hecker J, Kraso J, et al. Longitudinal PET imaging for monitoring myelin repair in the spinal cord. Ann Neurol. 2013;75:688–98. doi: 10.1002/ana.23965. [DOI] [PubMed] [Google Scholar]
- Xie L, Yamasaki T, Ichimaru N, Yui J, Kawamura K, Kumata K, et al. [(11)C]DAC-PET for noninvasively monitoring neuroinflammation and immunosuppressive therapy efficacy in rat experimental autoimmune encephalomyelitis model. J Neuroimmune Pharmacol. 2012;7:231–42. doi: 10.1007/s11481-011-9322-3. [DOI] [PubMed] [Google Scholar]
- Xie M, Tobin JE, Budde MD, Chen CI, Trinkaus K, Cross AH, et al. Rostrocaudal analysis of corpus callosum demyelination and axon damage across disease stages refines diffusion tensor imaging correlations with pathological features. J Neuropathol Exp Neurol. 2010;69:704–16. doi: 10.1097/NEN.0b013e3181e3de90. [DOI] [PMC free article] [PubMed] [Google Scholar]
- Yeh FC, Verstynen TD, Wang YB, Fernandez-Miranda JC, Tseng WYI. Deterministic diffusion fiber tracking improved by quantitative anisotropy. PloS One. 2013;8 doi: 10.1371/journal.pone.0080713. [DOI] [PMC free article] [PubMed] [Google Scholar]
- Yeh FC, Wedeen VJ, Tseng WY. Generalized q-sampling imaging. IEEE Trans Med Imaging. 2010;29:1626–35. doi: 10.1109/TMI.2010.2045126. [DOI] [PubMed] [Google Scholar]