

Abstract
Cardiolipin (CL) is a complex phospholipid that is specifically found in mitochondria. Owing to the association of the CL levels with mitochondrial physiopathology such as in Parkinson’s disease, we study the molecular effect of CL on membrane organization using model Langmuir monolayer, fluorescence microscopy, and x-ray reflectivity. We find that the liquid-expanded phase in membranes increases with increasing CL concentration, indicating an increase in the elasticity of the mixed membrane. The Gibbs excess free energy of mixing indicates that the binary monolayer composed of CL and DPPC is most thermodynamically stable at ΦCL = 10 mol %, and the stability is enhanced when the surface pressure is increased. Additionally, when ΦCL is small, the expansion of the membrane with increasing CL content was slower at higher surface pressure. These abnormal results are indicative of a folding structure being present before a collapsing structure, which was confirmed by using fluorescence microscopy and was characterized by using x-ray reflectivity with the electron density profile along the membrane’s surface normal.
Introduction
The mitochondrion is a special organelle and has been one of the classical subjects in biology owing to its specific functions that carry out adenosine triphosphate synthesis and apoptosis, and to its independent role in eukaryotic cells (1–3). The biological functions of the mitochondrion are interesting, but the exact mechanism of how the highly-folded membrane of mitochondrial cristae, which creates a large surface area within a volume-constraining outer membrane, is formed is an intriguing subject as well. However, the capability of lipid compartments to create the folding topology without support of the membrane proteins remains controversial (4).
The folding of the inner mitochondrial membrane raises a question as to whether it can be regulated intrinsically by the lipid components on the membrane. Among the various types of phospholipids that make up the mitochondrial membrane, cardiolipin (CL) exclusively exists in the membranes of bacteria and mitochondria (5). CL is a unique phospholipid with a dimeric structure, carrying two negative charges on a small acidic headgroup and having a large hydrophobic tail formed by four acyl chains with various lengths. CL is primarily localized in the inner membrane of mitochondria, where it represents ∼25% of the total phospholipid content (6). CL is important in maintaining the structure and the morphology of the mitochondrial cristae (4,7,8). Any alteration in the CL levels leads to a mitochondrial physiopathology such as heart failure (9), diabetes (10), Barth syndrome (11), and Parkinson’s disease (12). Ohtsuka et al. (13) reported that a drop of 30% in the CL content caused a drastic alteration of the mitochondrial structure. All mitochondria appeared to be greatly enlarged and swollen, and cristae were lacking or disorganized. However, defects in phosphatidylserine and sphingolipid biosynthesis had no significant effects on the shapes, sizes, or cristae contents of the mitochondria. The results suggest that an alteration of mitochondrial ultrastructure is specifically associated with a reduction in CL content, rather than some other abundant lipids on the mitochondrial membrane (13). In in vitro studies, with model systems composed of CL-containing giant unilamellar vesicles, creation of a localized pH gradient induced a cristae-like morphology in the vesicles. This phenomenon was not observed for lipid vesicles without CL. The results support the ideas that adenosine triphosphate synthase in the cristae membrane is coupled with CL to produce a maximum curvature of the membrane and that the cristae morphology becomes self-maintaining (8,14).
Despite its central role in cellular function, and its being associated with the mitochondrial ultrastructure, which has been well confirmed in cell, the molecular effects of CL on membrane organization and dynamics remain poorly understood. Previously the role of CL in modulating membrane properties and membrane integrity has been probed using biophysics model membranes, including monolayer, bilayer, and vesicle systems. Model membrane studies determined that the incorporation of CL strongly affected the thermodynamic properties of lipid monolayers (15,16) and bilayers (15,17–19). Monolayer analyses indicate that a mixture of EPC (egg phosphatidylcholine) and CL in specific mixed ratios and at specific pressures is thermodynamically stable, even though the apparent area compressibility modulus and the lysis tension of vesicle structures decreases with increasing CL content. Both suggest a decrease in the lateral interaction between the monolayer leaflets, which means that less energy is needed to stretch the membrane (15). Such an effect would likely decrease the energy required to create folds in the inner mitochondrial membrane. Due to its chemical structure, CL may form micellar, lamellar, and hexagonal states in an aqueous dispersion, depending on the pH and ionic strength of the environment (17–20). The abundance of high curvature zones in mitochondrial cristae might also be attributed to the intrinsic curvature of the CL molecule (7,21).
To the best of our knowledge, no direct report on model monolayer has been provided to prove the potential role of CL for inducing the folding structure of the mitochondrial cristae at molecular scale. In our study, we systematically investigated the molecular effect of CL on the mechanical properties of monolayers by means of Langmuir π-A isotherms, followed by the lateral and vertical morphological characterizations by using fluorescence microscopy and x-ray reflectivity, respectively. Particularly, a mixed monolayer composed of CL, a highly-unsaturated and doubly-negatively charged lipid, and DPPC (dipalmitoylphosphatidylcholine) (Fig. 1), a fully saturated and neutral lipid, provides a critical model monolayer for studying the thermodynamics and the mechanical properties of membranes as a function of CL content by Langmuir isotherms. The lateral interaction model estimated from the isotherms will be visualized by fluorescence microscopy. The mechanism of collapsed formation clearly observed by fluorescence microscopy is finally revealed by x-ray reflectivity, with the electron density profile perpendicular to the membrane’s surface, at medium pressure.
Figure 1.
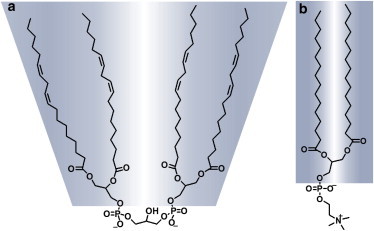
Chemical structures of (a) CL and (b) DPPC. To see this figure in color, go online.
Materials and Methods
CL (cardiolipin (heart, bovine-disodium salt)), DPPC (1,2-dipalmitoyl-sn-glycero-3-phosphocholine), POPC (1-hexadecanoyl-2-(9Z-octadecenoyl)-sn-glycero-3-phosphocholine), DOPC (1,2-di-(9Z-octadecenoyl)-sn-glycero-3-phosphocholine), and DLPA (1,2-dilinoleoyl-sn-glycero-3-phosphate) were all purchased from Avanti Polar Lipids (Alabaster, AL). The fluorescent probe, Texas Red, was purchased from Invitrogen (Carlsbad, CA). Chloroform, methanol, sodium chloride, and calcium chloride were bought from Jin Chemical Pharmaceutical (Gyeonggi-do, Korea). All chemicals and phospholipids were used without further purification. The subphase was pure water (pH 5.7) treated with a Labtech-Purelab Classic system (system (resistivity, 18 MΩ cm; Daihan Labtech, Namyangju-si, Gyeonggi-do, Korea). Stock solutions of DPPC, DOPC, POPC, and CL, 1 mg/mL, were prepared in a chloroform and methanol (5:1) (v:v) mixture.
Surface pressure measurements
Surface pressure-area (π-A) isotherms were recorded at a compression rate of 10 cm2 min−1 in a symmetric mode by using a Langmuir trough (model No. 611M; NIMA Technology, The Science Park, Coventry, UK) containing a DI water subphase. The total compression area of the Langmuir trough was 30–20 cm2, and the trough was placed in a plexiglass enclosure to prevent air vibration. Before every experiment, the trough and the barriers were cleaned with chloroform and were rinsed twice with DI water. The water subphase was also treated until the compression and the expansion of the barriers remained at constant pressure (±0.1 mN/m). Solutions containing mixed phospholipids in chloroform at various molar ratios, ranging from 0 to 100 mol % of CL, were prepared and spread onto the interface by using a microsyringe (Hamilton, Reno, NV). Typically, the compression was initiated 15 min after spreading to allow for the evaporation of chloroform and the stabilization of the membrane structures. The value π was monitored with a Wilhelmy article probe hanging from a high precision microbalance connected to a computer, and is defined as
| (1) |
where γ0 is the surface tension of the air-water interface and γ is the surface tension in the presence of a mixed monolayer compressed to varying packing densities.
Analysis of isotherms
The value of the monolayer compressibility (Cs) for an indicated film composition at a given surface pressure π was obtained from the π-A data by using
| (2) |
where Aπ is the area per molecule at the indicated surface-pressure π. For convenience, we further analyzed our data in terms of the reciprocal isothermal compressibility, i.e., the elastic modulus of the area compressibility (Cs−1) as described previously in Smaby et al. (22), because this facilitated comparisons with measurements made in bilayer systems. Accordingly, the higher the value of Cs−1, the lower the interfacial elasticity. We selected a pressure value, which is closest to integer, to represent each pressure elevated by the lateral compression. We used the averaging method for every four-points to smoothen the π-Cs−1 curve at regions exhibiting high fluctuations.
The value of the excess Gibbs free energy of mixing, GE, which is indicative of the thermodynamic stability of mixed monolayers, was determined by using
| (3) |
where Ai and Φi are the molecular area and mole fraction values of each component, respectively, and A12 is the average area per molecule of the mixture (23).
Fluorescent microscopy
For fluorescence microscopy, a Langmuir trough (KSV NIMA 302M; Biolin Scientific, South Stockport, Cheshire, UK) with a glass window at the bottom was mounted on an inverted fluorescence microscope (Eclipse TE2000-U; Nikon, Melville, NY). The temperature was maintained at 16°C by using an external water bath with a thermostat. To minimize the lateral diffusion and the thermal fluctuations in the monolayer at the air-water interface, the temperature used for imaging the lipid domains was intentionally made lower than that needed to obtain the isotherms; this made the lipid more rigid and provided a condition similar to that of a collapsed phase at high pressure so that the folding structure could be observed. The stock solution of Texas Red in chloroform was added to the pure, nonfluorescence mixed lipid solution, 1 mol %. The monolayers were then compressed and maintained at target pressures by using continuous, low-speed asymmetric compression at a rate of 10 cm2 min−1. During compression, images of the monolayer were collected by using a 20× objective lens and a high-speed camera, which allowed 1000 frames/s, enabling us to record a video of the dynamic structure and the phase transition of the membrane structure in real-time. The probe molecules were excluded from densely-packed structure of the LC phase, providing contrast between the liquid-expanded (LE) and liquid-condensed (LC) phases. A mercury lamp was used to excite the fluorescence probes, and a wavelength filter was used for imaging. Discrimination between the excitation (595 nm) and the emission (605 nm) fluorescence from the dye (Texas Red) was regulated by using dichroic mirrors and interchangeable cut-off filters.
X-ray reflectivity
X-ray reflectivity was performed using a D8 Advance (Bruker AXS, Karlsruhe, Germany) with a vertical goniometer, which allowed the liquid’s surface to be studied without disturbing the Langmuir trough during the measurements. The Langmuir trough was enclosed in a plexiglass box with Kapton windows, and the incoming and the reflected beams were detected through Kapton-covered windows. The Langmuir trough setup was placed on an antivibration table (Halcyonics NANO 30; Accurion, Göttingen, Germany). A ceramic anode x-ray generator was used to produce Cu Kα radiation (λ = 1.542 Å), and a parallel incident beam was produced by using a Göbel mirror (GM III). Two slits before the sample defined the incident beam size and reduced the vertical divergence (24). We repeatedly scanned the reflectivity to monitor the thickness (d) and the electron density changes as functions of the CL mol % to understand the molecular effect of CL on the membrane’s organization at the membrane-liquid interface. Each scan took a total of 4 h to acquire. The dispersion, δ, which is the real part of the index of refraction, is given linearly in terms of the electron density, ρ, by δ = λ2ρr0/2π, where r0 is the classical electron radius (2.82 × 10⁻¹³ cm). The electron density profiles (ρ) shown in this article were obtained from the dispersion profiles (δ) acquired from fits to these x-ray reflectivity data and were normalized by the electron density of water (25,26). The x-ray reflectivity R(qz) is approximated from the simple Born approximation (27) by
| (4) |
To analyze these x-ray reflectivity data, we used the recursive Parratt formalism (28). The sharp interfaces were smeared because of the root-mean-square roughness, σ, which was calculated by convoluting the infinitely sharp profile with a Gaussian smoothing function. We systematically varied and then optimized the fitting parameters (ρ, d, and σ) until the sums of the squares, from the offsets (χ2) of the points from the curve, were minimized.
Results
π-A isotherms for CL/DPPC monolayers
We purposely chose to use DPPC at temperatures that were well below its phase transition to perform the experiments, because the π-A isotherm of DPPC exhibits clearly a well-known LE-to-LC phase transition of DPPC. The LE and LC states are the overall state of membrane, which are mainly addressed in this study. By slowly compressing, the membrane will simultaneously change its structure corresponding to its phase, from the gas phase to the LE phase and then to the LC phase. The LE phase is where the lipid molecules start to get close to each other and reduce the freedom of molecular orientation. The LC phase is where lipid molecules start to pack tightly without freedom of orientation and tilt of acyl chains. If the membrane is compressed further, the solid phase and collapse are conducted. By varying the molar ratio of CL, the effect of CL on the phase of DPPC will be systematically investigated.
Compression isotherms (Fig. 2 a) were first recorded for binary mixtures of CL and DPPC. The isotherm for the latter lipid was in good agreement with the behavior reported previously in Phillips et al. (29), with a clearly discernible LE-LC phase transition that was displayed as a plateau at 3–7 mN/m on the isotherm. Data for CL/DPPC mixed monolayers revealed several interesting features. First, with increasing ΦCL, the LE-LC coexistence region progressively disappeared until it had completely disappeared at ΦCL = 40% (Fig. 2 a), suggesting that the films with ΦCL ≥ 40% were predominantly in the LE state. The second feature of the isotherms is that the collapsed pressure of the films was nearly constant or increased slightly as a plateau for ΦCL ≥ 40% (Fig. 2 a)—which raises questions as to how the structure of the binary membrane can change upon continuous compression to maintain the pressure constant, and whether the folding structure can be induced before the collapsing structure. Also, to compare an expanding effect of CL in DPPC monolayers at different packing states, the isobars of the molecular area A versus ΦCL at surface pressures of 3 (before LE-LC coexistence), 7 (after LE-LC coexistence), and 10, 20, 30, and 40 mN/m were constructed (Fig. 2 b). Surface pressures ≥20 mN/m the presence of CL led to a slight expansion, whereas at pressures of 7 and 10 mN/m, the expansions were more pronounced, and at pressure of 3 mN/m, the expansion was almost linear. However, when ΦCL ≥ 60%, the expansions of the monolayers seemed to be more or less identical at every surface pressure. Accordingly, we may conclude CL to prefer the LE phase in monolayers and probably also liquefy the LC domains of DPPC, causing the overall expansion of the films.
Figure 2.
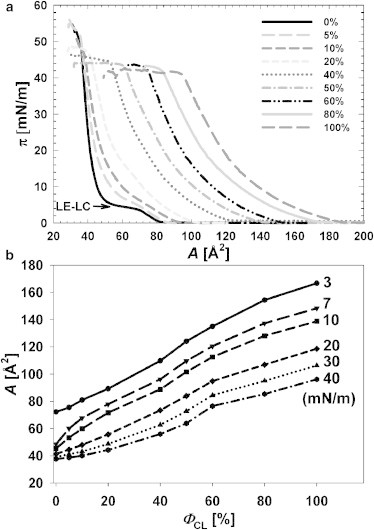
(a) Surface pressure-area isotherms (π-A isotherms) of CL/DPPC mixed monolayers at various ΦCL, ranging from 0 to 100 mol %, at an air-water interface. The isotherms were recorded at a compression rate of 10 cm2/min with total area of 30 × 20 cm2. The temperature was monitored and maintained at 25°C. (b) Variations in molecular areas A with ΦCL for mixed CL/DPPC monolayers at 3 (before LE-LC coexistence), 7 (after LE-LC coexistence), and 10, 20, 30, and 40 mN/m were calculated from the π-A isotherms to understand the expanding effect of CL on mixed monolayers at different packing states.
Thermodynamic properties of CL/DPPC monolayers
The excess free Gibbs energy of mixing, GE, resulting from differences between the areas under the mixed isotherms and the weighted average of the single-component isotherms, provides information on whether a particular interaction is thermodynamically favored (GE < 0) or not (GE > 0) compared to an ideal mixture, where it is assumed that no difference exists in the interaction potentials when a molecule interacts with another molecule of the same molecular species or with a different one. Approximately, values of GE > 0 can be understood as a tendency for the molecules to interact preferentially with molecules of the same kind, leading to the observation of phase separation. Accordingly, a minimum, which is usually most negative, in the plot of GE versus molar fraction is usually indicative of the formation of a complex between molecules of different species (23).
The excess free energy of mixing, GE, for all CL/DPPC mixed monolayers at different values of ΦCL were calculated from the π-A isotherms according to Eq. 3, with π ranging from 5 to 40 mN/m. Some noticeable features can be seen in the diagram of GE versus ΦCL in Fig. 3. First, immiscibility was evident at most values of ΦCL, probably due to a significant structural difference between the two lipid components. Second, when ΦCL > 40%, the immiscibility of each composition increased greatly with increasing π. This phenomenon can probably be attributed to a repulsive interaction between the negatively-charged headgroups of CL. Third, GE showed a minimum at ΦCL =10 mol % for all π investigated, suggesting the formation of complex structure that is able to overcome the two above-mentioned factors that cause immiscibility. This complex structure at ΦCL = 10% will be characterized and visualized more in this article.
Figure 3.
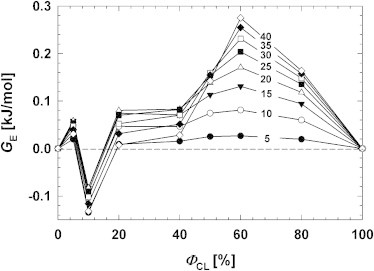
Excess Gibbs free energy of mixing, GE, for all CL/DPPC mixed monolayers at different values of ΦCL with π ranging from 5 to 40 mN/m, was extracted from ρ-A isotherms. (Horizontal dashed line) Visual guide only.
Interfacial elastic moduli of area compressibility of CL/DPPC monolayers
To compare the in-plane elastic packing interaction of lipid components composed of monolayers with increasing ΦCL, the interfacial elastic moduli of area compressibility Cs−1 as a function of lateral packing pressure π was determined (22), hence providing insight into the influence of the CL on the interfacial elasticity of the films. From Fig. 4 a, increasing ΦCL up to 20% significantly decreased Cs−1; indeed, the Cs−1 values at π = 30 mN/m were 222, 137, 110, and 106 mN/m for ΦCL = 0, 5, 10, and 20 mol %, respectively, revealing an augmented elasticity of the mixed monolayers. From the π-Cs−1 behavior of a pure DPPC monolayer, a sharp drop in the Cs−1 value was seen to occur at surface pressures of 4 mN/m. The Cs−1 values were then seen to reverse sign and to increase to values more characteristic of a condensed phase at higher surface pressures. The dramatic drop in the Cs−1 values reflects both discontinuities in the lateral packing at phase boundaries and the accompanying lateral density fluctuations that are known to occur when the LE and the LC phases coexist. For this reason, plots of π-Cs−1 proved to be an informative way to recognize the surface-pressure range over which fluid (LE) and condensed (LC) phases coexist. In addition, the minimum value of Cs−1 in the π-Cs−1 plot, which reflects the LE-LC phase transition, became broader and shifted to higher π, from 4 to 24 mN/m, with increasing ΦCL from 0 to 40 mol %, respectively. This phenomenon indicated that the molecular effect of CL on the interfacial elasticity of the membranes was to shift the maximum in-plane elasticity to a higher surface pressure π. This phenomenon was also predicted as a common trend occurring when the lower melting-temperature lipids (30) or the molecules that had a tendency to reorient themselves from random alignments at the interface to a relatively ordered perpendicular array (31) were mixed with DPPC in a binary monolayer membrane.
Figure 4.
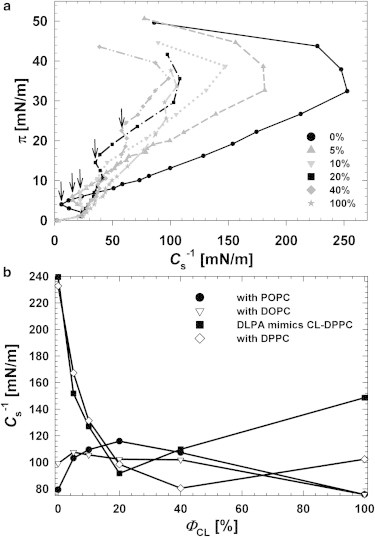
(a) Surface pressure π versus the elastic moduli Cs−1 of area compressibility calculated from the π-A isotherms for CL/DPPC mixed monolayers with various values of ΦCL: 0, 5, 10, 20, 40, and 100%. (Arrows) Visual guide only; pointing at the Cs−1 minima of plots. (b) Elastic moduli Cs−1 of binary monolayers composed of CL and various phosphatidylcholine lipids with different unsaturated degrees on acyl chains.
Cs−1 versus ΦCL data at a physiologically relevant surface pressure of 30 mN/m for binary monolayers composed of CL with different types of lipids were constructed to better demonstrate an overall view of the molecular effect of CL on various membranes. From Fig. 4 b, for a CL/DPPC monolayer at 30 mN/m, Cs−1 dramatically diminished when ΦCL was increased to 20%, implying an enhancement of the elasticity of the films. Above that critical molar ratio, Cs−1 values were more or less identical. The maxima of the Cs−1-ΦCL plots for mixtures of CL with other lipids whose chemical structures had higher unsaturated degrees, e.g., POPC and DOPC, also generally had the same critical molar ratio of ΦCL 20%. Note that the Cs−1-ΦCL behaviors for both mixtures with POPC and DOPC were opposite to that with DPPC due to the unsaturated degrees on the hydrocarbon chains of POPC and DOPC, even though the changes in the amplitudes of Cs−1 for both cases were not significant. This raises a question as to whether this critical ΦCL of 20% can be attributed only to CL’s chemical structure and not to the other lipid components with which the CL is mixed. An additional experiment was carried out with DLPA, which is known to have half the chemical structure of CL. Consequently the DLPA molecule is expected to occupy half of the mean volume of the CL molecule. To mimic the effect of the chemical structure of CL, we used DLPA at a double molar concentration in the mixture with DPPC to make binary monolayers. Fig. 4 b showed that the Cs−1-ΦCL behaviors for CL/DPPC and DLPA/DPPC were almost identical for increasing ΦCL up to 20% and that the Cs−1 values of DLPA/DPPC were higher than those of CL/DPPC for ΦCL ≥ 40%. This difference is probably due to the intrinsic liquefying effect of CL itself, which is related to the preferentially LE characteristic of CL. This result answered a question raised earlier, in that the critical ΦCL of 20% is attributed only to the chemical structure of CL.
Fluorescence microscopy of CL/DPPC monolayers
The impact of CL on the molecular organization of mixed membranes with DPPC was analyzed by using fluorescence microscopy to visualize the lateral distribution of the LE phase, which favors the fluorescent dye Texas Red (Φdye = 1 mol %) (Fig. 5). Differences in the dye solubility between the LE and the LC phases result in a contrast; the dark region contains tightly packed lipids in the LC phase. The dye is excluded from this solidlike phase and is localized in the loosely packed lipids in the LE phase surrounding the LC domains (32). The solid domains of DPPC started to appear when π coincided with the onset pressure for the LE-LC transition. A growth of continuous LC domains with diameters of 30–40 μm can be observed in Fig. 5 a at a pressure of 10 mN/m. The shapes and sizes of the LC domains of DPPC were in agreement with previous reports (33). Even though the condensed domains appear to be randomly arrayed and are observed to diffuse in the plane of the monolayer due to the Brownian motion, they rarely come into contact, indicating that the domains repel each other at short distances (34). At an equivalent π of 10 mN/m, an increase in ΦCL led to the LC domains of DPPC becoming smaller in size and less dense (Fig. 5, b–d). These observations reveal a liquefying effect of CL, which was proposed earlier in this article.
Figure 5.
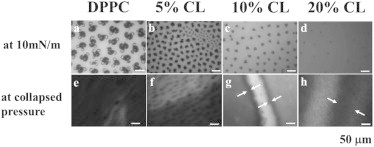
Fluorescent micrographs of (a) DPPC at 10 mN/m; (b) 5% CL at 10 mN/m; (c) 10% CL at 10 mN/m; (d) 20% CL at 10 mN/m; (e) DPPC at 60 mN/m; (f) 5% CL at 60 mN/m; (g) 10% CL at 55 mN/m, marking when the collapsed structures start to appear; and (h) 20% CL at 50 mN/m, showing the collapsed structures with unclear boundaries. (Dark domains) LC domains of DPPC; (open areas) LE phase of membranes composed of CL and DPPC. The temperature was maintained at 16°C. The temperature for fluorescence imaging was intentionally lower than for recording isotherms to minimize the lateral diffusion of the lipids. (Arrows) Visual guide only; marking two edges of the stripes or collapsed structures being observed. The scale bars represent 50 μm.
Upon further compression to the collapsed region, pure DPPC and mixed monolayers at ΦCL = 5 mol % showed mostly dark areas that entirely covered the membrane’s surface. However, at ΦCL = 10 mol %, where the miscibility was the most energetically stable, the complex structures were observed on the fluorescence micrographs (Fig. 5 g). Thick uniform stripes surrounded by fluids with high fluorescence intensity were seen. The sizes of these uniform stripes were ∼20–30 μm and became larger at ΦCL = 20 mol %. The exact size of stripes at ΦCL = 20 mol % was unclear due to low contrast between the collapsed phase and the fluorescent fluids. This low contrast is probably due to the complete quenching of dye molecules when they come into contact with water (35). These stripes were composed of several domains layers with various thicknesses, which is indicative of a membrane with collapsed structure. These collapsed structures remain stable and are distinguishable at ΦCL = 10–20 mol % but disappeared at ΦCL ≥ 40 mol %.
In situ x-ray reflectivity
Because the fluorescence images and the π-A isotherms give no direct information for the impact of CL on the structural changes in the depth profile, we performed in situ x-ray reflectometry (XR) experiments. Hence, each dataset in Fig. 6 shows unique interference fringes, which contain the damping factors due to the surface roughness and an oscillating term due to the layer thicknesses without q−4 decay. In all cases, the reflectivity of the films clearly exhibits a single modulation, indicating a lipid monolayer with a well-defined structure. To describe the detailed structures, we used the effective-density model to refine a dispersion profile perpendicular to the film layer, with the goodness of fit being evaluated by monitoring the χ2-values (36).
Figure 6.
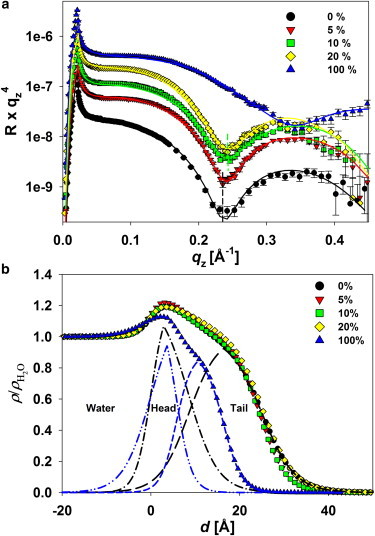
(a) XR curves measured at the water-air interface for monolayers composed of DPPC with various ΦCL. (Solid lines) Least-square fits. (b) Corresponding normalized electron density profiles of monolayers obtained from the reflectivity fits of (a). The electron density profiles of DPPC and CL were denoted as follows: (dash-dot-dash) DPPC’s headgroup, (dash-dot-dot-dash) CL’s headgroup, (long dash) DPPC’s tail, and (short dash) CL’s tail. Measurements were all carried out at π = 30 mN/m. The temperature was maintained at 16°C. To see this figure in color, go online.
We described the overall membrane structure as two homogenous layers on a water subphase (air/tailgroup/headgroup/subphase). The measured x-ray reflectivity profiles (Fig. 6 a, circles) matched very well with the structural model (Fig. 6 a, solid line), which subsequently provided an average dispersion profile normal to the air-water interface that encompasses both the solid and the LE domains that exist at π = 30 mN/m. Note that CL’s headgroup is composed of two phosphate headgroups, leading to the electron density being higher than that of DPPC’s headgroup, which is composed of only one phosphate. The hydrophobic tail of CL contains four hydrocarbon chains, while that of DPPC contains only two. However, the hydrocarbon chains of CL with a high degree of unsaturation are expected to strongly repel each other and to occupy a much larger volume than DPPC does. The repulsive force between CL molecules tends to hinder the packing capacity of the CL layer, consequently leading to a lower overall electron density and a smaller thickness compared to DPPC. At 30 mN/m, the membrane composed of 100% cardiolipin is expected to behave like a fluidic phase with randomly tilted tails, and to be less structurally defined. X-ray reflectivity data shown in Fig. 6 a prove this structural comparison. At a glance, the first minimum in the reflectivity curve for pure CL is significantly shifted to the higher qz region, indicating that the total monolayer thickness has decreased; the lowered amplitude of the Kiessig fringe is significantly damped, revealing a low packing density of pure CL film. Accordingly, the lengths of the headgroups of DPPC and CL obtained from the fits of Fig. 6 b were ∼8.5 and 5.7 Å, respectively, while the lengths of the tailgroups of DPPC and CL were ∼16.6 and 10.6 Å, respectively. The electron densities of the headgroup region and the tail region of DPPC were ∼4.51 and 3.60 e−/Å3, respectively, while those of CL were ∼4.40 and 3.18 e−/Å3, respectively. Also, from the electron density profiles shown in Fig. 6 b for mixed monolayers, one can see that the electron densities of the head- and the tailgroup progressively decreased as ΦCL was increased, except for ΦCL = 20 mol %. The amplitude of profile for ΦCL = 20 mol % was slightly damped, implying that both head-tailgroup and tailgroup-air interfaces had been disturbed, leading to increases in roughness of 9.9 and 6.3 Å, respectively. These observations might be indicative of a reconformation of CL molecules within the membrane, or the potential of a folding structure that is expected to be present before the collapsed region. The parameters obtained from the fits are described in Table 1.
Table 1.
X-ray reflectivity fitting parameters for CL/DPPC mixed monolayers
| % | σw (Å)b | ρh (e−/Å3)a | σh/t (Å)b | dh (Å)b | ρt (e−/Å3)a | σt/a (Å)b | dt (Å)b |
|---|---|---|---|---|---|---|---|
| 0 | 3.0 | 4.51 | 5.9 | 8.5 | 3.60 | 6.6 | 16.6 |
| 5 | 3.0 | 4.76 | 7.5 | 8.0 | 3.50 | 5.4 | 16.5 |
| 10 | 3.0 | 4.65 | 7.9 | 8.0 | 3.45 | 5.3 | 16.5 |
| 20 | 3.0 | 4.64 | 9.9 | 8.0 | 3.65 | 6.3 | 17.0 |
| 100 | 5.7 | 4.40 | 3.1 | 5.7 | 3.18 | 3.7 | 10.6 |
Measured at various ΦCL for the respective electron density values ρh and ρt, thickness values dh and dt for head- and the tailgroup regions, and interfacial roughness values σh/t and σt/a for headgroup/tail and tailgroup/air interfaces.
The uncertainty of ρ was 2% of the value.
The error range of σ and d was <±0.2 Å.
Discussion
Previous studies on mitochondrial physiopathology suggest that any alteration in the CL level would lead to alteration in the mitochondrial cristae structure and morphology (14). Therefore, it was of interest to characterize the physical and the mechanical properties of membrane, as reflected in the molecular impact of CL on a mixed monolayer with DPPC.
The desired surface pressures were chosen based on the purpose of the experiments. Overall, for Langmuir π-A isotherms, we would like to systematically study the intermolecular interaction between CL and DPPC, as functions of lateral compression (or surface pressure) and concentration of CL. The surface pressures for fluorescence microscopy experiments were selected at 10 mN/m (representing low pressure) and collapsed pressure (representing high pressure). This would be done to observe the effect of CL on LC domain of DPPC in terms of shape and size at low pressure, and the capability of CL to induce the collapsed structure on the membrane at high pressure. However, the reason for which we measured XR only at 30 mN/m is associated to the real cell system where the packing state is estimated ∼30–35 mN/m (37). In addition, the XR measurement was inspired from the collapsed structure observed from fluorescence images, which is likely induced by CL. Our aim was to answer the question as to whether CL can induce the folding structure, which is the structural transition from the flat membrane to collapsed state upon further compression, at the physiologically relevant pressure of 30 mN/m. Indeed, we successfully observed the signature of folding structure, although it occurred very locally.
Regarding the CL ratio, the reasons for which we chose a low range of molar ratio of CL, from 5 mol % to 20 mol %, are also associated with physiologically relevant composition and experimental results from π-A isotherm and fluorescence microscopy. First, in a real cell system, the CL concentration is varied by age and its location, and ranged from 5% to 20% in molar ratio (6,38). From isotherm analyses and fluorescence microscopy, the mechanical properties of membrane at a higher molar ratio (≥40%) were predominant for CL. The CL domain of DPPC was difficult to observe by fluorescence at low pressure when the molar ratio of CL is ≥40%. Therefore, the effect of CL at higher molar ratios is not our interest in this study.
DPPC at the temperature used for the experiment is in the gel phase, while CL is in the fluid phase. Owing to the difference in the chemical structure of these two lipids, the mixed membrane is expected to undergo the phase separation. If those two lipids are phase-separated, gel and fluid states must coexist. This observation is in agreement with the literature (15,16), when two lipid components have a transition temperature above and below the temperature at which the investigation has been carried out. However, from our observation in the isotherm, the elastic moduli diagram, and the fluorescence microscopy, the overall feature of membrane is predominated by CL’s fluidic feature, even at small CL molar ratio. In other word, the overall feature of the mixed membranes is more fluid than gel state.
In brief, our thermodynamics analysis showed that a ΦCL of 10% was the most thermodynamically stable composition, regardless of the surface pressure, suggesting the formation of a complex structure that was able to manage the repulsive interaction between CL molecules (Fig. 3). As evidenced by the lateral interaction observed on fluorescence microscopy, as shown in Fig. 5, the liquefying effect of CL reduced the size and the density of the LC domains of DPPC and induced the formation of the collapsed structures being observed as uniform stripes of ∼20–30 mm in size. These collapsed structures remained stable and were distinguishable in the range of ΦCL from 10 to 20 mol %. X-ray reflectivity showed that the increase in the electron density in the tail region and the increase in headgroup-tail and tail-air interfacial roughnesses for ΦCL = 20 mol % might be a signature of a folding structure, which is followed by the collapsed structure observed by fluorescence microscopy in the collapsed region (Fig. 6 b and Table 1). In fact, at higher molar ratio of CL, ΦCL = 50 mol % (Fig. S1 in the Supporting Material), the increase in electron density of the tail region and in the interfacial roughnesses was even more significant, indicating that the probability of folding structure occurrence was increased upon increase of CL’s concentration. However, the film was still a monolayer structure overall, because the fold occurred very locally on the membrane.
Taken all together, the model of the effect of CL on the membrane is presented in Fig. 7. Upon incorporating CL into the monolayer, CL molecules liquefy DPPC from its LC domain to LE phase; and each CL molecule will pair up with DPPC molecules in a proper stoichiometry (39). Once the CL molecules become more crowded, the probability of two CL molecules being in direct contact increases, but the system remains thermodynamically stable and miscible because of the decrease in the phase separation. Upon compression to high pressure, the CL-rich regions on the membranes start being stretched out of the plane of the membrane to create a folding structure. Upon further compression to the collapsed region, CL molecules start to be squeezed-out of the membrane and to form an apposed layer, with some of the hydrocarbon tails maintaining the hydrophobic interaction with the original membrane and others exposed to the air to stabilize the entire collapsed structure (Fig. 7). The model of hydrocarbon tails of CL having opposite directions was actually proposed in previous reports for a bilayer (40) and a cytochrome c–CL interaction (39).
Figure 7.
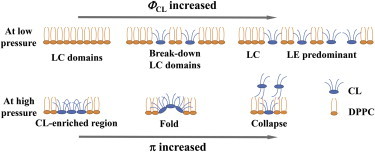
Schematic model of a possible arrangement of CL in mixed monolayers with DPPC during compression. At low pressure, the model shows how CL liquefies the LC domain of DPPC upon increase of the CL’s concentration. At high pressure, the model explains how CL induces the folding structure locally on the membrane, before reaching the collapsed state upon further compression. Note that the model only highlights CL’s effect on partial membrane. The folding structure’s proof was detected from XR data, while the collapsed state was clearly observed by fluorescence microscopy. To see this figure in color, go online.
The area expansion behavior with increasing ΦCL for π ≥ 20 mN/m (Fig. 2 b) showed the expansion rate slightly decreases when the compression is increased. This fact supports the model of the folding structure proposed in Fig. 7; with the same number of CL molecules on the membrane, a higher compression leads to a higher probability of CL molecules being in contact with each other and to more folding structures being induced. Furthermore, the Gibbs excess energy diagram (Fig. 3) implied that the mixed membranes were thermodynamically favored. From the model for a folding structure, one can see that the increased interfacial area by forming a curvature helps CL molecules to minimize the repulsive force caused by the unsaturated hydrocarbon chains and the negatively charged headgroups. The end of the folding process, which leads to the collapsed structure, is an even more thermodynamically favorable process—one in which the internal repulsion between hydrocarbon chains is drastically reduced. In the collapsed structure, the negatively-charged repulsion is completely gone on the apposed layer.
Lastly, the folding structure in the proposed model has been estimated in several previous studies on bilayers (15,18) and membrane-protein interactions (41) with the incorporation of CL. However, to the best of our knowledge, no report has provided a direct evidence for this curvature morphology on the monolayer system at the air/water interface. Note that the folding structures appear locally on the membrane. In addition, the folds are not well-defined structures because of the lateral dynamics of the membrane, especially for the membrane composed of a highly fluidic lipid such as CL. Therefore, the parameters obtained from the best fit of x-ray data can only reveal the signature of the folding structure by considering the electron density of the tail region and the roughness of both headgroup-tail and tail-air interfaces. In summary, our data obtained from different interfacial characterizations strongly support the presence of a folding structure before the collapse. This folding structure is crucial in understanding the impact of CL on the structure of mitochondrial cristae.
Conclusions
We have analyzed the impact of CL on the structure, mechanical properties, and morphology of model lipid monolayers. We found that the LE phase of pure DPPC membranes increased with increasing CL concentration, indicating an increase in the elasticity of the mixed membrane. The Gibbs excess free energy of mixing was the most negative value at ΦCL = 10 mol %, and the stability was enhanced when the surface pressure was increased. Additionally, in the range of ΦCL ≤ 50 mol %, the expansion of the membrane’s area with increasing CL content was slower at higher surface pressure. These abnormal results are indicative of the presence of a folding structure before a collapsing structure, which was confirmed by using fluorescence microscopy and was characterized by x-ray reflectivity with the electron density profile along the membrane’s surface, dρ(z)/dz. Altogether, our results support the role of CL in the induction of the membrane alterations involved in the remodeling, deformation, and permeability of biological membranes enriched in this lipid. The importance of such membrane alterations relates to the physiological mode by which cells adjust the mechanical properties in response to the external stimuli by changing local lipid composition, and optimize the macroscopic structure of mitochondrial cristae to support the protein interaction in membrane-dependent processes.
Author Contributions
M.D.P. performed research, analyzed data, and wrote the article; K.S. designed the research, contributed analytic tools, checked, and improved the article.
Acknowledgments
This work was supported by the Nuclear Research R&D Program, the Mid-Career Researcher Program (grant No. 2011-0017539), the Advanced Research Center for Nuclear Excellence and Basic Science Research Program (grant No. 2013R1A1A2010265), and the Gwangju Institute of Science and Technology-National Core Research Center (grant No. R15-2008-006) through the National Research Foundation of Korea funded by the Ministry of Science, Information and Communications Technology & Future Planning, Korea, and Sogang University.
Supporting Material
References
- 1.Scheffler I.E. Wiley-Liss; Wilmington, DE: 1999. Mitochondria. [Google Scholar]
- 2.Ernster L., Schatz G. Mitochondria: a historical review. J. Cell Biol. 1981;91:227s–255s. doi: 10.1083/jcb.91.3.227s. [DOI] [PMC free article] [PubMed] [Google Scholar]
- 3.Scheffler I.E. Mitochondria make a comeback. Adv. Drug Deliv. Rev. 2001;49:3–26. doi: 10.1016/s0169-409x(01)00123-5. [DOI] [PubMed] [Google Scholar]
- 4.Mannella C.A. Review. Structure and dynamics of the mitochondrial inner membrane cristae. Biochim. Biophys. Acta. 2006;1763:542–548. doi: 10.1016/j.bbamcr.2006.04.006. [DOI] [PubMed] [Google Scholar]
- 5.Schlame M., Rua D., Greenberg M.L. The biosynthesis and functional role of cardiolipin. Prog. Lipid Res. 2000;39:257–288. doi: 10.1016/s0163-7827(00)00005-9. [DOI] [PubMed] [Google Scholar]
- 6.Fleischer S., Rouser G., Kritchevsky G. Lipid composition of mitochondria from bovine heart, liver, and kidney. J. Lipid Res. 1967;8:170–180. [PubMed] [Google Scholar]
- 7.Schlame M., Ren M. The role of cardiolipin in the structural organization of mitochondrial membranes. Biochim. Biophys. Acta. 2009;1788:2080–2083. doi: 10.1016/j.bbamem.2009.04.019. [DOI] [PMC free article] [PubMed] [Google Scholar]
- 8.Khalifat N., Puff N., Angelova M.I. Membrane deformation under local pH gradient: mimicking mitochondrial cristae dynamics. Biophys. J. 2008;95:4924–4933. doi: 10.1529/biophysj.108.136077. [DOI] [PMC free article] [PubMed] [Google Scholar]
- 9.Sparagna G.C., Chicco A.J., Moore R.L. Loss of cardiac tetralinoleoyl cardiolipin in human and experimental heart failure. J. Lipid Res. 2007;48:1559–1570. doi: 10.1194/jlr.M600551-JLR200. [DOI] [PubMed] [Google Scholar]
- 10.Han X., Yang J., Gross R.W. Shotgun lipidomics identifies cardiolipin depletion in diabetic myocardium linking altered substrate utilization with mitochondrial dysfunction. Biochemistry. 2005;44:16684–16694. doi: 10.1021/bi051908a. [DOI] [PubMed] [Google Scholar]
- 11.Schlame M., Ren M. Barth syndrome, a human disorder of cardiolipin metabolism. FEBS Lett. 2006;580:5450–5455. doi: 10.1016/j.febslet.2006.07.022. [DOI] [PubMed] [Google Scholar]
- 12.Tyurina Y.Y., Winnica D.E., Kagan V.E. LC/MS characterization of rotenone-induced cardiolipin oxidation in human lymphocytes: implications for mitochondrial dysfunction associated with Parkinson’s disease. Mol. Nutr. Food Res. 2013;57:1410–1422. doi: 10.1002/mnfr.201200801. [DOI] [PMC free article] [PubMed] [Google Scholar]
- 13.Ohtsuka T., Nishijima M., Akamatsu Y. Mitochondrial dysfunction of a cultured Chinese hamster ovary cell mutant deficient in cardiolipin. J. Biol. Chem. 1993;268:22914–22919. [PubMed] [Google Scholar]
- 14.Mileykovskaya E., Dowhan W. Cardiolipin membrane domains in prokaryotes and eukaryotes. Biochim. Biophys. Acta. 2009;1788:2084–2091. doi: 10.1016/j.bbamem.2009.04.003. [DOI] [PMC free article] [PubMed] [Google Scholar]
- 15.Nichols-Smith S., Teh S.Y., Kuhl T.L. Thermodynamic and mechanical properties of model mitochondrial membranes. Biochim. Biophys. Acta. 2004;1663:82–88. doi: 10.1016/j.bbamem.2004.02.002. [DOI] [PubMed] [Google Scholar]
- 16.Sennato S., Bordi F., Rufini S. Evidence of domain formation in cardiolipin-glycerophospholipid mixed monolayers. A thermodynamic and AFM study. J. Phys. Chem. B. 2005;109:15950–15957. doi: 10.1021/jp051893q. [DOI] [PubMed] [Google Scholar]
- 17.Domènech O., Morros A., Hernández-Borrell J. Thermal response of domains in cardiolipin content bilayers. Ultramicroscopy. 2007;107:943–947. doi: 10.1016/j.ultramic.2007.04.009. [DOI] [PubMed] [Google Scholar]
- 18.Domènech O., Morros A., Hernández-Borrell J. Supported planar bilayers from hexagonal phases. Biochim. Biophys. Acta. 2007;1768:100–106. doi: 10.1016/j.bbamem.2006.06.012. [DOI] [PubMed] [Google Scholar]
- 19.Alessandrini A., Muscatello U. AFM and FTIR spectroscopy investigation of the inverted hexagonal phase of cardiolipin. J. Phys. Chem. B. 2009;113:3437–3444. doi: 10.1021/jp809705d. [DOI] [PubMed] [Google Scholar]
- 20.Paradies G., Petrosillo G., Ruggiero F.M. Role of cardiolipin peroxidation and Ca2+ in mitochondrial dysfunction and disease. Cell Calcium. 2009;45:643–650. doi: 10.1016/j.ceca.2009.03.012. [DOI] [PubMed] [Google Scholar]
- 21.Huang K.C., Mukhopadhyay R., Wingreen N.S. A curvature-mediated mechanism for localization of lipids to bacterial poles. PLOS Comput. Biol. 2006;2:e151. doi: 10.1371/journal.pcbi.0020151. [DOI] [PMC free article] [PubMed] [Google Scholar]
- 22.Smaby J.M., Kulkarni V.S., Brown R.E. The interfacial elastic packing interactions of galactosylceramides, sphingomyelins, and phosphatidylcholines. Biophys. J. 1996;70:868–877. doi: 10.1016/S0006-3495(96)79629-7. [DOI] [PMC free article] [PubMed] [Google Scholar]
- 23.Goodrich F.C. Molecular interaction in mixed monolayers. Proc. 2nd Int. Congr. Surface Act. 1957;15:85. [Google Scholar]
- 24.Kim J.H., Yim S.Y., Shin K. Adsorption behaviors and structural transitions of organic cations on an anionic lipid monolayer at the air-water interface. Soft Matter. 2012;8:6504–6511. [Google Scholar]
- 25.Russell T.P. X-ray and neutron reflectivity for the investigation of polymers. Mater. Sci. Rep. 1990;5:171–271. [Google Scholar]
- 26.Jeworrek C., Evers F., Winter R. Effects of specific versus nonspecific ionic interactions on the structure and lateral organization of lipopolysaccharides. Biophys. J. 2011;100:2169–2177. doi: 10.1016/j.bpj.2011.03.019. [DOI] [PMC free article] [PubMed] [Google Scholar]
- 27.Shin K., Pu Y., Kolb R. Correlated surfaces of free-standing polystyrene thin films. Macromolecules. 2001;34:5620–5626. [Google Scholar]
- 28.Parratt L.G. Surface studies of solids by total reflection of x-rays. Phys. Rev. 1954;95:395–396. [Google Scholar]
- 29.Phillips M.C., Chapman D. Monolayer characteristics of saturated 1,2,-diacyl phosphatidylcholines (lecithins) and phosphatidylethanolamines at the air-water interface. Biochim. Biophys. Acta. 1968;163:301–313. doi: 10.1016/0005-2736(68)90115-6. [DOI] [PubMed] [Google Scholar]
- 30.Sabatini K., Mattila J.P., Kinnunen P.K.J. Characterization of two oxidatively modified phospholipids in mixed monolayers with DPPC. Biophys. J. 2006;90:4488–4499. doi: 10.1529/biophysj.105.080176. [DOI] [PMC free article] [PubMed] [Google Scholar]
- 31.Wang Z., Li X., Yang S. Studies of dipalmitoylphosphatidylcholine (DPPC) monolayers embedded with endohedral metallofullerene (Dy@C82) Langmuir. 2009;25:12968–12973. doi: 10.1021/la9017932. [DOI] [PubMed] [Google Scholar]
- 32.Nakahara H., Lee S., Shibata O. Langmuir monolayer of artificial pulmonary surfactant mixtures with an amphiphilic peptide at the air/water interface: comparison of new preparations with surfactin (surfactant TA) Langmuir. 2008;24:3370–3379. doi: 10.1021/la703180x. [DOI] [PubMed] [Google Scholar]
- 33.McConlogue C.W., Vanderlick T.K. A close look at domain formation in DPPC monolayers. Langmuir. 1997;13:7158–7164. [Google Scholar]
- 34.Lösche M., Sackmann E., Möhwald H. A fluorescence microscopic study concerning the phase diagram of phospholipids. Ber. Bunsenges. Phys. Chem. 1983;87:848–852. [Google Scholar]
- 35.Takamoto D.Y., Lipp M.M., Zasadzinski J.A. Interaction of lung surfactant proteins with anionic phospholipids. Biophys. J. 2001;81:153–169. doi: 10.1016/S0006-3495(01)75688-3. [DOI] [PMC free article] [PubMed] [Google Scholar]
- 36.Tolan M. Springer; Karlsruhe, Germany: 1999. X-Ray Scattering from Soft-Matter Thin Films. [Google Scholar]
- 37.Seelig A. Local anesthetics and pressure: a comparison of dibucaine binding to lipid monolayers and bilayers. Biochim. Biophys. Acta. 1987;899:196–204. doi: 10.1016/0005-2736(87)90400-7. [DOI] [PubMed] [Google Scholar]
- 38.Daum G. Lipids of mitochondria. Biochim. Biophys. Acta. 1985;822:1–42. doi: 10.1016/0304-4157(85)90002-4. [DOI] [PubMed] [Google Scholar]
- 39.Virtanen J.A., Cheng K.H., Somerharju P. Phospholipid composition of the mammalian red cell membrane can be rationalized by a superlattice model. Proc. Natl. Acad. Sci. USA. 1998;95:4964–4969. doi: 10.1073/pnas.95.9.4964. [DOI] [PMC free article] [PubMed] [Google Scholar]
- 40.Unsay J.D., Cosentino K., García-Sáez A.J. Cardiolipin effects on membrane structure and dynamics. Langmuir. 2013;29:15878–15887. doi: 10.1021/la402669z. [DOI] [PubMed] [Google Scholar]
- 41.Beales P.A., Bergstrom C.L., Vanderlick T.K. Single vesicle observations of the cardiolipin–cytochrome-c interaction: induction of membrane morphology changes. Langmuir. 2011;27:6107–6115. doi: 10.1021/la104924c. [DOI] [PMC free article] [PubMed] [Google Scholar]
Associated Data
This section collects any data citations, data availability statements, or supplementary materials included in this article.