

Abstract
The aggregation of α-synuclein (α-Syn) is linked to Parkinson’s disease. The mechanism of early aggregation steps and the effect of pathogenic single-point mutations remain elusive. We report here a single-molecule fluorescence study of α-Syn dimerization and the effect of mutations. Specific interactions between tethered fluorophore-free α-Syn monomers on a substrate and fluorophore-labeled monomers diffusing freely in solution were observed using total internal reflection fluorescence microscopy. The results showed that wild-type (WT) α-Syn dimers adopt two types of dimers. The lifetimes of type 1 and type 2 dimers were determined to be 197 ± 3 ms and 3334 ± 145 ms, respectively. All three of the mutations used, A30P, E46K, and A53T, increased the lifetime of type 1 dimer and enhanced the relative population of type 2 dimer, with type 1 dimer constituting the major fraction. The kinetic stability of type 1 dimers (expressed in terms of lifetime) followed the order A30P (693 ± 14 ms) > E46K (292 ± 5 ms) > A53T (226 ± 6 ms) > WT (197 ± 3 ms). Type 2 dimers, which are more stable, had lifetimes in the range of several seconds. The strongest effect, observed for the A30P mutant, resulted in a lifetime 3.5 times higher than observed for the WT type 1 dimer. This mutation also doubled the relative fraction of type 2 dimer. These data show that single-point mutations promote dimerization, and they suggest that the structural heterogeneity of α-Syn dimers could lead to different aggregation pathways.
Introduction
Self-assembly of protein into amyloid-type aggregates is a widespread phenomenon associated with the development of many neurodegenerative diseases, including Parkinson’s disease (PD), a hallmark of which is the aggregation of α-synuclein (α-Syn) and the assembly of aggregates into intracellular Lewy bodies (1,2). Amyloid self-assembly kinetics are described by a nucleation and growth mechanism in which the first phase, nucleation, produces a critical oligomer that gives rise to the second phase, a thermodynamically favorable elongation process, resulting in the formation of fibrillary aggregates (3). Biophysical techniques have been applied in the structural characterization of amyloid or amyloid-like fibrils, revealing a number of general features of aggregates formed by the assembly of amyloid proteins, including α-Syn (4–7).
α-Syn is a relatively small protein comprised of 140 residues that belongs to the family of intrinsically disordered proteins (IDPs). In aqueous solution, the protein lacks clear structural motifs and is characterized by a globular shape slightly smaller than a random coil (6,7). In fibrils, however, α-Syn undergoes a dramatic structural transition involving the formation of β-sheet structural motifs that primarily span the central hydrophobic part of the protein, referred to as the nonamyloid component (NAC, amino acids 61–95). Dramatic conformational transitions of this nature typify fibrils formed by IDPs, whereas structurally organized amyloid proteins (e.g., Sup35 prion protein) can form fibrils without undergoing such a dramatic structural change (7). The key common feature of amyloid-like fibrils is an extended β-sheet that stabilizes the fibrillar structure (8,9). The conversion of amyloidogenic proteins to β-sheet-rich assemblies involves a dramatic change in the protein conformation that has been termed protein misfolding.
Compared to our understanding of the elongation process, knowledge of the first phase of α-Syn self-assembly, the formation of oligomers, is limited due to the lack of appropriate techniques to characterize temporal features of the assembly process. Oligomeric states of the protein are transient, so their characterization requires nontraditional approaches. Single-molecule techniques are capable of characterizing transient states of amyloid proteins (reviewed in (10,11)). Sandal et al. applied atomic-force-microscopy (AFM)-based single-molecule force spectroscopy (SMFS) to characterize conformational equilibria of α-Syn monomers (12). A number of environmental factors and pathogenic mutations known to promote α-Syn aggregation were found to shift the equilibria to structured conformers (13). The same method was adopted by Hervás et al. to reveal a conformational polymorphism of monomeric forms of amyloidogenic proteins, including α-Syn (14). Optical tweezers methods were applied to identify a range of metastable structures for α-Syn monomers, dimers, and tetramers (15). Trexler and Rhoades utilized single-pair Förster resonance energy transfer to explore the aggregation-prone states of α-Syn monomer (16), revealing an important role of the C-terminus. Single-molecule Förster resonance energy transfer was also used to demonstrate the structural transition between the broken horseshoe and the extended α-helix structures of α-Syn upon binding to lipids (17). Based on our understanding of α-Syn fibrillar structure, discussed above, it is widely assumed that the aggregation of α-Syn and other amyloid proteins is initiated by the formation of misfolded monomers and their assembly into dimers. The monomer structure changes upon interaction with an oligomer, and a detailed computational model of this process, termed dock and lock, has recently been developed (18). In that model, the unstructured monomer, after docking to the structured oligomer, adopts a conformation required to lock the oligomer, adding one more unit to the structured assembly.
Recently, our group developed an AFM-based SMFS approach designed to monitor the interaction between monomers tethered to the surface and the AFM tip (11,19–28). Using this approach, misfolded states of α-Syn and other proteins have been probed to reveal a number of common features. For example, we showed that dimers with different conformations form, and we identified protein segments involved in the interprotein interaction. In addition, the dimers were shown to be stable and characterized by lifetimes in the range of 1 s.
The application of the SMFS approach to amyloid β (Aβ) proteins revealed dramatic differences in folding pattern between the Aβ40 and Aβ42 dimers, and the N-terminal segment of the protein was found to play a critical role in the protein folding (26). Probing of α-Syn interactions enabled us to identify α-Syn segments involved in dimer assembly and to characterize the impact of familial mutations of α-Syn on the misfolded dimer conformations (24). Evidence that misfolded dimers exhibit high stability led to the hypothesis that the formation of such dimers is the mechanism by which the misfolded state of amyloidogenic proteins is stabilized, suggesting that dimerization triggers the self-assembly process (11). Recent computational analyses confirmed this hypothesis (29). Molecular dynamics (MD) simulations played an important role in demonstrating that misfolded conformations did not occur in monomers but did appear in dimers, which remained stable over timescales of several hundreds of nanoseconds, whereas monomers changed their conformations in a few nanoseconds. In addition, these studies revealed a set of misfolded dimeric conformations, which led to our hypothesis that various dimeric conformers are involved in the amyloid oligomerization process. Although there is a nice qualitative correlation between the high stability of dimers measured by SMFS and that obtained in MD simulations, the dimers in the experiment were probed along the applied force, so the impact of dimer fluctuations in other directions on dimer stability remains unclear. We address that issue in this study, in which a single-molecule fluorescence approach was developed to probe dimer stability.
Here, we applied single-molecule fluorescence imaging to measure directly the lifetimes of α-Syn dimers. In this approach, unlabeled α-Syn was tethered to the coverslips, and fluorescently labeled α-Syn in the solution was capable of interacting with the immobilized α-Syn to form dimers. Dimer formation was detected by fluorescence bursts, and dimer lifetimes were quantified. Statistical analysis revealed long-lived dimers, with lifetimes exceeding hundreds of milliseconds. In particular, we identified two major populations of such dimers with lifetimes of several hundreds of milliseconds and several seconds, whose lifetimes and relative distributions were altered by specific disease-related mutations.
Materials and Methods
Materials
Phosphate-buffered saline (PBS), pH 7.0, was prepared and filtered through a disposable Millex-GP syringe filter unit (0.22 μm) before use. All reagents were purchased from Sigma Aldrich (St. Louis, MO). In all experiments, we used square glass coverslips (20 mm × 20 mm; Karl Hecht, Sondheim, Germany), potassium dichromate (ICN Biomedicals, Aurora, OH), and deionized (DI) water (18.2 MΩ resistivity, 0.22 μm filter pore size; APS Water Services, Van Nuys, CA). A stock solution of 50 mM 1-(3-aminopropyl) silatrane (APS) was prepared by dissolving the APS powder in DI water. The intramolecularly photostabilized Cy3 fluorophore (GE Healthcare, Little Chalfont, United Kingdom) was chemically synthesized (30). Maleimide-poly(ethylene glycol)-succinimidyl valerate (Mal-PEG-SVA, 3.4 kDa), SVA-PEG-SVA, and methoxy-PEG-SVA (mPEG-SVA, 2 KDa) were purchased from Laysan Bio (Arab, AL). In addition, we used sodium bicarbonate (Mallinckrodt Baker, Paris, KY), Amicon 10 kDa and 30 KDa centrifugal filter units (EMD Millipore. Billerica, MA), mica sheets (Asheville-Schoonmaker Mica, Newport News, VA), carbon-coated double-sided tape (Ted Pella, Redding, CA), and 0.1-mm-thick teflon spacers (American Durafilm, Holliston, MA). All α-Syn proteins were prepared as described in our previous publications (22,24), and details are provided in the Supporting Material.
Total internal reflection fluorescence microscopy imaging
Glass coverslips were cleaned with potassium dichromate for 30 min and immersed in DI water until use. Glass coverslips were assembled on the original sample holder (PicoQuant, Berlin, Germany), then covered by a 0.1-mm-thick teflon spacer and a 25-mm-diameter quartz disk. The created sample chamber was then filled with an aqueous solution of 167 mM APS for 30 min and rinsed with DI water, resulting in a glass surface modified with primary amine groups. The APS coverslips were functionalized with a 1:100 Mal-PEG-SVA/mPEG-SVA molar mixture (31,32) by incubation for 1 h in 0.1 M sodium bicarbonate buffer, pH 8.5 (33). Bubbles were removed from the sodium bicarbonate buffer by vortexing and ultrasonication. The sample chamber was sequentially rinsed with sodium bicarbonate buffer, pH 8.5, and 10 mM PBS buffer, pH 7.0, before immobilization of α-Syn. The α-Syn solution was sonicated (Branson 1210, Branson Ultrasonics, Danbury, CT) and then filtered through an Amicon filter (molecular weight cutoff, 30 kDa) at 14,000 rpm for 15 min to remove aggregates. For surface immobilization, the α-Syn solution (25 pM fluorescently labeled or unlabeled) was injected into the sample chamber to allow Cys moieties of α-Syn to react with maleimide groups of immobilized Mal-PEG-SVA during a 1 h incubation. The sample chamber was thoroughly rinsed with PBS buffer solution and used immediately.
Single-molecule imaging was performed with an objective-type total internal reflection fluorescence (TIRF) microscope built around an Olympus IX71 microscope (Hitschfel Instruments, St. Louis, MO). An oil-immersion UPlanSApo 100× objective with 1.40 NA (Olympus, Tokyo, Japan) was used for all measurements. A laser line at 532 nm (CrystaLaser, Reno, NV) was used to excite the fluorophore of immobilized α-Syn in the total internal reflection mode. Fluorescence emission was detected with an electron-multiplying charge-coupled-device camera (ImagEM Enhanced C9100-13, Hamamatsu, Bridgewater, NJ). TIRF videos of 45 s to 50 s duration were recorded at a temporal resolution of 30 ms. The labeled 1 nM α-Syn solution (labeling procedures can be found in the Supporting Material) was sonicated for 1 min to break aggregates and filtered through an Amicon filter (molecular weight cutoff, 30 kDa) at 14,000 rpm for 15 min. TIRF experiments were repeated three times for each protein.
Double cysteinyl α-Syn enabling fluorescence labeling and covalent immobilization was used in experiments in which the density of α-Syn surface coverage was adjusted. Before the surface immobilization, a 100 pM solution of Cy3 α-Syn was sonicated for 1 min to break aggregates and filtered through an Amicon filter (molecular weight cutoff, 30 kDa) at 14,000 rpm for 15 min. The filtered α-Syn solution was immobilized on the PEG-functionalized coverslips using the procedure described above. The experiments were repeated three times.
TIRF data analysis
The videos recorded with TIRF were visually inspected frame by frame using Slidebook 5.0 software (Intelligent Imaging Innovations (3i), Denver, CO). Whenever a candidate dimer was detected, a confined area was circled out for further analysis. A typical dimerization event showed a sudden increase of fluorescence intensity with an abrupt drop back to background after a short time period. The increment threshold of fluorescence intensity was set at three times higher than the standard deviation of background fluctuation. Several hundreds of dimers were analyzed for each protein. The data were assembled and shown as a distribution.
The normalized survival probability, Psurv, was used to measure the lifetime of α-Syn dimers. A prominent characteristic of the NSP approach is that it does not require any assumptions about the type of data distribution (34,35). Therefore, if the decay process is complicated (e.g., multiexponential), the NSP approach is capable of extracting features for all species. Psurv was calculated by dividing the number of events that fall into each time-bin interval by the total number of events. The original distribution of counts versus lifetime was transformed into another display in which Psurv was plotted versus lifetime according to the equation
| (1) |
where is the number of dimerization events that survive longer than lifetime , and is the total number of dimerization events detected. Compared with single- and triple- exponential decay (Table S1), the data were best fitted with a double-exponential decay process, which we ascribe to two types of dimers with distinct lifetimes, and :
| (2) |
where A1 and A2 are fractions of species with lifetimes τ1 and τ2, respectively.
The Kolmogorov-Smirnov test (no assumption of data distribution required) was used to test the difference between the two identified distributions for each experiment.
The free energies were estimated according to methods in previous studies, using the equation (36)
| (3) |
where is the height of the energy barrier, kB is the Boltzmann constant, T is temperature, h is the Planck constant, and koff (the reciprocal value of τ1 and τ2) is the dissociation rate without applied external force.
Single-molecule fluorescence traces of covalently immobilized α-Syn were manually selected for analysis. The number of photobleaching steps in each trace was determined according to published procedures (37). All fluorescence traces contained only one or two bleaching steps. At least 100 molecules were analyzed for each sample.
Results
Tethered approach outline
We designed the approach for direct visualization of α-Syn interactions at the single-molecule level using single-molecule fluorescence in the TIRF mode. In this approach, schematically shown in Fig. 1, α-Syn proteins (wild-type (WT) and three mutants, A30P, E46K, and A53T (Fig. 1 A)) are immobilized on a coverslip and allowed to interact with fluorescently labeled α-Syn in the solution to form a complex (dimer). Dimer formation is detected by the appearance of a fluorescence burst at the location of the transiently formed dimer (Fig. 1 B). The duration of the burst is the measure of the α-Syn dimer lifetime. To minimize the effect of α-Syn immobilization on the interaction with free protein molecules, α-Syn molecules were tethered to the surface via flexible PEG linkers. We used bifunctional PEG tethers that were covalently immobilized on the amino-modified surface (i.e., the APS surface) (27) via the reaction of the SVA terminal reactive group (the N-hydroxysuccinimide group) making the maleimide terminus (Mal group) of immobilized PEG available for reaction with the thiol group of the α-Syn cysteine residue. α-Syn does not contain cysteine residues, so we used an A140C derivative of α-Syn in which the C-terminal alanine was replaced with cysteine. The rationale for using the C-terminal domain for α-Syn immobilization stems from the well-documented fact that the C-terminal segment of α-Syn is not involved in protein aggregation; therefore, C-terminal immobilization via cysteine provides the fewest potential constraints for the interaction of immobilized α-Syn with free protein. Indeed, a similar immobilization of α-Syn was used in our prior AFM force spectroscopy studies, in which the interactions between two immobilized α-Syn proteins were probed (11,19,22,24). The same terminal cysteine was used for fluorescence labeling of α-Syn that was free in solution in the experimental setup (Fig. 1 B). A number of critical issues have to be addressed to accomplish the experiments as described in the scheme (Fig. 1 B).
Figure 1.
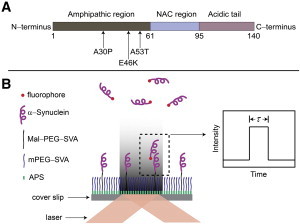
(A) Schematic of the structure of α-Syn. The amphipathic region (1–61), nonamyloid component region (NAC, 61–95), and acidic tail (95–140) are colored dark gray, light blue, and light pink, respectively. Arrows indicate the three single-point mutations, A30P, E46K, and A53T. A cysteine is tagged at the C-terminus for single cysteinyl α-Syn. Two cysteines are placed at both ends for double cysteinyl α-Syn. (B) Schematic of the TIRF setup. A glass coverslip is functionalized with APS, followed by functionalization with two types of PEG and immobilization of the unlabeled α-Syn. The solution of the labeled α-Syn (shown with red dots at one end) is injected into the sample chamber, allowing free α-Syn molecules to interact with the tethered protein molecules. A laser is brought to the sample in the total internal reflection mode, enabling the generation of an evanescent field and excitation of molecules in the proximity of the surface. The dimerization event is detected by the appearance of a fluorescence burst with duration τ defining the dimer lifetime, as shown schematically (inset). To see this figure in color, go online.
First, the duration of the dye fluorescence should be long enough to enable us to measure the dimer lifetime before fluorophore bleaching. To ensure slow photobleaching, we used organic fluorophores that were photostabilized through intramolecular triplet-state quenching (38). We tested the stability of a given fluorophore conjugated to α-Syn in experiments in which labeled α-Syn was covalently immobilized on the PEG-ylated surface. In these experiments, α-Syn containing two cysteines (one each at the N- and C-termini) was used. One Cys residue enabled the conjugation of the dye, whereas the other provided immobilization of Cy3-labeled molecules to the glass coverslips functionalized with PEG-maleimide. There was no blinking or bleaching of the fluorescence spots during the observation time (see Movie S1 and the time trajectory shown in Fig. S1). Thus, these data directly confirmed the fluorescence stability of the label within the protein and under the environmental conditions used for these experiments. Second, the surface coverage of α-Syn should be sparse, to avoid overlap of fluorescence signals from labeled α-Syn bound to two adjacent immobilized α-Syn molecules. This criterion was met by adjusting the surface density of PEG-maleimide and the α-Syn concentration. The surface density of PEG-maleimide was controlled by the use of an excess of mPEG-SVA along with the main tether, Mal-PEG-SVA, both of which bind covalently to amines of the APS-glass surface. Because mPEG-SVA does not have a reactive maleimide group, the ratio between the two PEG tethers allowed us to adjust the surface density of these groups as needed for α-Syn immobilization. The conditions for the surface preparation and α-Syn concentration were identified by experiments with the use of Cy3-labeled α-Syn that contained two cysteines at the N- and C-termini, as described above. Fig. S2 A shows that individual bright spots were well separated with the distance (approximately microns) between the adjacent spots. Third, we tested the level of nonspecific binding of α-Syn. The experiments using the mPEG-SVA surface showed that the level of binding of Cy3-labeled α-Syn is very low (cf. Fig. S2, A and B). Nonspecific adsorption of dyes on other surfaces was also tested (Fig. S3). Fourth, we ensured that immobilized Cy3-labeled α-Syn was monomeric by performing photobleaching experiments. The results shown in Movie S2 demonstrated that immobilized labeled α-Syn photobleaches rapidly, as can be seen in the sample trajectory in Fig. S2 C. Statistical analysis (Fig. S2 D) demonstrates that 95% of cases were one-step bleaching events. Two-step processes were observed in 5% of cases and were assigned to dimer bleaching. Fifth, we need to take into consideration the ability of α-Syn to self-assemble into aggregates. The monomeric size of α-Syn was verified by AFM imaging (Fig. S4; see also Shlyakhtenko et al. (39)). This finding was in line with the low yield of two-step photobleaching experiments mentioned above (Fig. S2 D). A potential contribution to the observed fluorescence bursts from free-floating α-Syn is very small if any. Given the diffusion coefficient of α-Syn of 2 × 10⁻⁶ cm2 s−1 (40), the characteristic time of translocation over the evanescent area (∼100 nm) is ∼0.1 ms, which is beyond the temporal resolution of the TIRF setup of the instrument (30 ms). The five factors just described were critical in developing the α-Syn immobilization procedure for reliable detection of the α-Syn dimerization process. The concentration of α-Syn for surface immobilization and the ratio between PEGs were optimized to reach the required surface coverage, as shown in Fig. S5.
Visualization of α-Syn dimerization
Unlabeled WT α-Syn was tethered to the glass coverslip as described above, and the solution of fluorescently labeled WT α-Syn was placed on the top, so the binding process of labeled molecules to immobilized unlabeled WT α-Syn could be detected by continuous measuring of fluorescence by the TIRF system. This dimerization process can be seen in Movie S3 and Fig. S6, A–C (three frames from Movie S3). Bright spots on the image frames correspond to binding events, and the fluorescence duration defines the protein-complex lifetime. For example, fluorescence at spot 1 (Fig. S6, A–C, circle 1) is short, whereas spot 2 (circle 2) persists for a much longer time. These events are quantitatively characterized by the time trajectories, and a selected set of such trajectories with different duration times is shown in Fig. 2. The peak in Fig. 2 A represents a complex formation event with a relatively short duration time, τ = 0.21 s. Given the high stability of the fluorophore conjugated with α-Syn, the abrupt drop in fluorescence intensity after 0.21 s was assigned to the dissociation of the complex rather than to photobleaching or photoblinking. Fig. 2, B and C, corresponded to longer lived complexes with lifetimes of 0.45 s and 1.29 s, respectively. Note the very long-lived event, with a lifetime of 6.63 s, in Fig. 2 D. It is important to note that all events had very similar fluorescence intensity, suggesting that complexes of the same stoichiometry are formed. The spots were predicted to be dimers formed by the immobilized α-Syn and its fluorescent counterpart in solution. Trimerization would lead to a two-step dissociation pattern that was rarely observed in these experiments, since rather low concentrations of labeled α-Syn were used. The process was reversible, as suggested by the fact that multiple dissociation and rebinding events were observed on the same trajectory for a selected target (Fig. S7). Fig. S7 A illustrates two consecutive binding-dissociation events at the same spot. The lifetimes of the dimers indicated in the graph are quite close. Fig. S7 B demonstrates three consecutive binding-dissociation events involving the same target. The initial event produces a dimer with a lifetime of 0.48 s, whereas the next events lead to the formation of dimers with shorter lifetimes.
Figure 2.
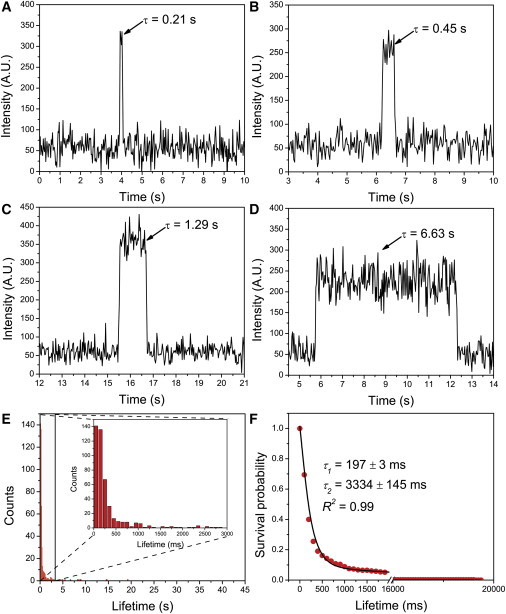
Typical fluorescence time traces of WT α-Syn dimer with various lifetimes. Bursts of fluorescence (arrows) represent the formation of dimers by binding of a fluorophore-labeled α-Syn to an immobilized α-Syn on the surface with various lifetimes: 0.21 s (A), 0.45 s (B), 1.29 s (C), and 6.63 s (D). The concentrations of labeled α-Syn in solution and unlabeled α-Syn functionalized on the PEG-ylated surface are 1 nM and 25 pM, respectively. (E) Quantitative analysis of the fluorescence data. Histogram of lifetimes of WT α-Syn dimer (n = 462). The majority of fluorescence bursts are shown in the inset of Fig. 2E. (F) Normalized survival probability graph in which the red circles are normalized data points and the solid line is a fitting curve approximated by a two-exponential decay equation with lifetimes indicated in the graph. The errors are fitting errors. The R-squared value indicates the goodness of the fit. To see this figure in color, go online.
Several hundreds of such events collected from different experiments were analyzed, and the data, assembled as histograms, are shown in Fig. 2 E. The majority of the events were grouped at a lifetime of ∼0.2 s, although events as long as ∼18 s could be found as well. The data were analyzed using the NSP approach, which does not require any assumptions about the type of data distribution (34,35). Graphs are shown in Fig. 2 F, and the entire data set is approximated by a double-exponential decay process, with distinct decay times of 197 ± 3 ms and 3334 ± 145 ms assigned to type 1 and type 2 dimers, respectively. The population of type 1 dimers was the most abundant (90%), with only 10% of the detected dimers belonging to long-lived type 2 assemblies. In each individual experiment, two distinct lifetimes that differ by an order of magnitude were consistently observed. To further validate the type 2 dimer, the Kolmogorov-Smirnov test was used to test the difference between the two identified types of dimers. The results showed that the two types of dimer differ substantially from each other (p < 0.01) with respect to lifetime (Table S2).
Effects of mutations on dimer stability
Similar analysis was performed with three α-Syn mutants, A30P, E46K, and A53T, corresponding to familial mutations of Parkinson’s disease. The experimental setup was similar to that for WT α-Syn, described above. Each α-Syn mutant was tethered to the coverslips, and the solution of the same fluorescently labeled α-Syn mutant was placed on top of the coverslip to allow free α-Syn molecules to interact with the immobilized counterpart. Complex formation was detected for these proteins as well (see Movies S4, S5, and S6). Time traces of representative dimer formation and dissociation events for A30P, E46K, and A53T α-Syn mutants are shown in Figs. S8, S9, and S10, respectively. Similar to the results obtained with WT α-Syn dimers, the lifetimes of mutant dimers varied in the range between several hundreds of milliseconds and several seconds. Histograms of dimer lifetimes for all mutants assembled over several hundred events are shown in Fig. 3, A, C, and E. The majority of lifetimes clustered at 0–0.5 s accompanied by spread-out events with lifetimes as long as several dozens of seconds. Compared with the WT α-Syn data, which showed the majority of lifetimes clustered around 100 and 200 ms (Fig. 2 E), the lifetimes of mutants were shifted to larger values, indicating their higher dimer stability relative to the WT. Note the strong maximum of ∼400 ms for the A30P mutant (Fig. 3 A). The NSP approach was applied to these data sets, and the resulting data for all mutants are shown in Fig. 3, B, D, and F. The double-exponential decay was a good approximation for all data sets that led to lifetimes of type 1 dimers of A30P, E46K, and A53T of 693 ± 14 ms (Fig. 3 B), 292 ± 5 ms (Fig. 3 D), and 226 ± 6 ms (Fig. 3 F), respectively, averaged over three independent experiments. Altogether, the stability of type 1 dimers is arranged in the order A30P > E46K > A53T > WT. The lifetimes of type 2 dimers of A30P, E46K, and A53T were 4998 ± 134 ms, 3593 ± 140 ms, and 2931 ± 104 ms, respectively, so the stability of type 2 dimers (long-lived) decreases in the order A30P > E46K ≈ WT > A53T.
Figure 3.
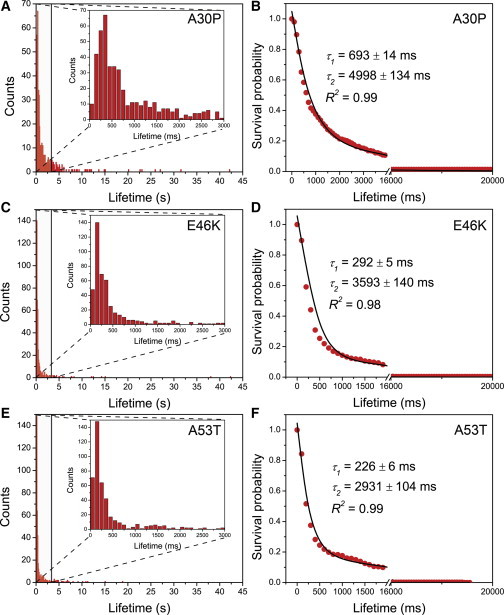
Quantitative analysis of the experiments with α-Syn mutants A30P (A and B, n = 505), E46K (C and D, n = 460), and A53T (E and F, n = 453). The concentrations of labeled α-Syn in solution and unlabeled α-Syn functionalized on the PEG-ylated surface are 1 nM and 25 pM, respectively. (Insets in A, C, and E) Zooms of the graphs, showing the majority of the fluorescence bursts spanning 0–3 s. For each mutant dimer, the corresponding normalized survival probability is plotted against the lifetime and fitted with a two-exponential decay equation (B, D, and F). Red circles are normalized data points, solid lines are fitting curves, and lifetimes are shown in the graphs. The errors are fitting errors. R-squared values indicate the goodness of the fit. To see this figure in color, go online.
The distributions of type 1 and type 2 dimer populations are summarized in Fig. 4. Compared to WT dimers, E46K dimers had similar distribution (88% were type 1 dimer). A30P dimers had the smallest portion of type 1 dimers (78%) and possessed the longest lifetime of type 1 dimers among all the variants. The fraction of type 1 dimer for A53T (81%) was close to that of A30P but smaller than that of WT.
Figure 4.
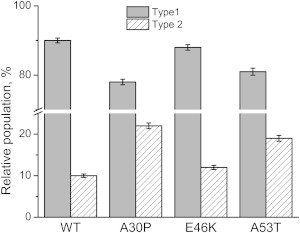
Relative populations of type 1 (short lifetime, gray column) and type 2 (long lifetime, hatched column) dimers of WT, A30P, E46K, and A53T dimers. The error bars are fitting errors.
Discussion
Conformational dynamics of α-Syn dimers
The proposed single-molecule fluorescence approach enabled us to quantitatively characterize interactions between α-Syn molecules. Using this approach, we demonstrated that the protein can form dimers with lifetimes in the range of a second that correspond to a barrier height as large as ∼28 kBT (Table S3). Recently, the AFM force spectroscopy approach was applied to characterize α-Syn dimers (11,19,22), and the value of the dimer lifetime was also on a timescale in the range of seconds. However, AFM force spectroscopy probes dimer stability along the direction of the applied force. The correlation between the data obtained by two different techniques suggests that the dimer dissociation along the pulling direction has a similar barrier height. However, the fluorescence approach allowed us to identify dimers with substantially longer lifetimes of several seconds, termed type 2 dimers. Such stable α-Syn dimers were also identified in the AFM force spectroscopy experiments, but only at pH 2.7, whereas the fluorescence experiments used here were performed at neutral pH. The yield of rupture events of force measurements at neutral pH was very low, but measurements at pH 5.1 provided only one lifetime, τ = 0.23 s (19). The fluorescence data show that the population of type 2 conformers of dimers is ∼10%, so their detection with AFM force spectroscopy is problematic. Therefore, we infer that primarily type 1 conformers are detected in the AFM force spectroscopy experiments.
The experimental approach described here consisted of an end-immobilization strategy involving the use of long flexible PEG tethers containing ∼77 units of ethylene glycol that allowed the entire α-Syn molecule to adopt almost unrestricted conformations. In our force spectroscopy analysis of α-Syn (22,24), we showed that a C-terminal segment as long as ∼30 residues was not involved in the interaction within the dimer, so tethering by the very end of the molecule does not interfere with dimer folding. Although the C-terminal domain of monomeric, unfolded α-Syn has been shown to interact with the central hydrophobic region via long-range interactions (41), the authors model the dimer interactions that occur with α-Syn molecules in solution under conditions where long-range interactions are relieved. Evidence suggests that the relief of these long-range interactions could promote dimerization and oligomerization (42). Moreover, any surface properties that may have influenced α-Syn dimerization in this study could be relevant to cellular oligomerization, based on evidence that membrane surfaces promote the self-assembly of α-Syn and other amyloidogenic proteins (43–45).
Although it has been widely assumed that the intracellular state of α-Syn is monomeric, the very recent studies of D. Selkoe et al. (46) suggest that α-Syn tetramers, rather than monomers, are the primary endogenous state of the protein, although others argue against this hypothesis (47,48). The long-lived dimers may form either potentially toxic oligomers (see below) or benign tetramers, and the distribution of these two outcomes is likely to vary among different α-Syn variants. We speculate that the difference between the two types of dimers observed here is in the stability of β-sheet structure, the major contributor to α-Syn fibril formation. This interpretation is supported by our recent computational analysis of dimers formed by amyloid β (14–23) dimers, which showed the formation of two stable amyloid β dimers with different stabilities, as defined by β-sheet size (29). We also speculate that long-lived dimer species may be more neurotoxic compared to short-lived species. This assumption is supported by a recent study (49) in which the authors discovered two types of oligomer with distinct neurotoxicity.
Role of mutations in α-Syn dimerization and aggregation
The comparative studies of WT α-Syn and all mutants (Figs. 2 and 3) demonstrate that mutations enhance the lifespan of type 1 dimer and that the lifetime values decay in the order A30P (693 ± 14 ms) > E46K (292 ± 5 ms) > A53T (226 ± 6 ms) > WT (197 ± 3 ms). These lifetimes correspond to energy barriers of 27.8 kBT, 29.1 kBT, 28.2 kBT, and 28.0 kBT for WT, A30P, E46K, and A53T, respectively (Table S3). The longer lifetimes of type 1 dimers for the mutants compared with WT suggested that the single-point mutations promote dimerization along the type 1 pathway and eventually the entire aggregation process of α-Syn. The possibility that the dimeric species observed in this study may be species on the α-Syn self-assembly pathway leading to higher-order oligomers is suggested by the findings that 1) dimerization is a key step in α-Syn self-assembly (50–52); 2) familial α-Syn variants have been shown to have a high propensity to form oligomers (7); and 3) the data presented here suggest that familial mutations stabilize dimeric forms of α-Syn. Of the three mutations, A30P exerts the strongest effect on dimerization, causing a 3.5-fold increase in the lifetime of type 1 dimer over the lifetime for the WT. Only the A30P mutation increases the lifetime of long-lived type 2 dimers. However, all three mutations lead to an increase in the population of type 2 α-Syn dimer, although the effect depends on the mutation type. All but the A30P mutation accelerate α-Syn fibrillization kinetics (53,54), whereas A30P induces an increase in the rate of oligomerization (protofibril formation) (55,56). This particular mutant is different from the others, as well as from WT α-Syn, based on its very long lifetimes for both types of dimer and its relatively high population of type 2 dimers, which was more than twofold higher than that of WT α-Syn type 2 dimers. It has been shown recently that two structurally different α-Syn oligomers coexist for all four dimer species, A30P, E46K, A53T, and WT (57). One type of oligomer was reported to result in fibrillization, whereas the other was responsible for oligomerization. The A30P mutation only promotes oligomerization and retards fibrillization. Therefore, we speculate that oligomerization propensity depends on the ability to form long-lived dimers, and the high ratio between type 2 and type 1 A30P dimers promotes the oligomerization pathway. Additional dimer stabilization can be provided by oxidation (58,59) and/or nitration (60) processes that could promote protein aggregation in vivo.
Our finding that α-Syn forms dimers with different lifetimes yields insights into the potential mechanisms of α-Syn self-assembly. One possibility is that different types of α-Syn dimers form different types of assemblies, consistent with structural heterogeneity of oligomeric and fibrillar forms of α-Syn (8,15,49). Alternatively, some dimers could be precursors of potentially toxic α-Syn oligomers, whereas others are not (e.g., they could be precursors of benign tetramers). Additional evidence from future studies will be needed to determine which dimers lead to the formation of potentially toxic α-Syn oligomers and thus should be considered therapeutic targets. The data presented here support the interpretation from our earlier studies (24) that multiple contacts enhance the stability of dimeric, mutant α-Syn. In turn, this enhanced dimer stability increases the probability that dimeric α-Syn will proceed down the α-Syn self-assembly pathway toward oligomers instead of undergoing dissociation followed by rapid monomer remodeling (40,61).
Conclusions
In summary, the single-molecule imaging approach developed here enabled us to measure the lifetimes of α-Syn dimers that appeared to be on a timescale in the range of seconds. Two classes of dimer with markedly different lifetimes were discovered. α-Syn mutations involved in the development of familial PD increase dimer stability, suggesting that the disease onset is defined by dimer formation, which is the very first aggregation event. Consistent with these findings, a previous study revealed that dimer formation was accelerated for the pathogenic A30P and A53T α-Syn mutants (50). The authors hypothesized that the effect was due to the greater propensity of mutants to self-interact, and our findings support this hypothesis. It is important to note that dimer formation was detected in solutions of nanomolar levels of α-Syn, suggesting that aggregation can occur at protein concentrations several orders of magnitude lower than those typically used in amyloid aggregation studies in solution in vitro. Although these low-concentration aggregation conditions were achieved in the protein-tethered setup, in which α-Syn was immobilized on the surface and dimers were formed by interaction of the immobilized protein with a freely diffusing α-Syn, the recent studies of Rabe et al. (62) showed that tethering of the protein is not required and that aggregation of α-Syn from a nanomolar-range solution can occur at the surface-liquid interface. Moreover, aggregation on the surface occurs more rapidly than in solution, regardless of the very high protein concentration in solution, which is several orders of magnitude higher than the concentrations used in the on-surface aggregation studies. Surfaces of various types are ubiquitous for intracellular and extracellular compartments, so it is highly important to understand the acceleration effect of surfaces in the protein self-assembly process. The approach described in this article showed that the very first self-assembly step, with the participation of the tethered protein, occurs at a subnanomolar protein concentration in solution and leads to the formation of stable dimers presumably in their misfolded state. The use of long-lived fluorophores (30,63) makes it possible to extend these studies to the quantitative analysis of later self-assembly stages such as trimer and tetramer, and work in this regard is in progress. Note as well that the described tethered approach is general and can be applied to any protein that undergoes misfolding and self-assembly.
Author Contributions
Z.L., A.V.K. and Y.L.L. designed the experiments. D.Y. and J.C.R. produced α-Syn proteins. S.C.B. provided fluorophores. Z.L. and Y.Z. performed the experiments and analyzed the data. Z.L., A.V.K., Y.Z. and Y.L.L. discussed the results and wrote the manuscript. All authors reviewed the manuscript.
Acknowledgments
This work was supported by grants GM096039 (National Institutes of Health) and EPS-1004094 (National Science Foundation) to Y.L.L., grant GM098859 to S.C.B., and a grant from the Branfman Family Foundation to J.C.R.
Supporting Material
References
- 1.Dawson T.M., Dawson V.L. Molecular pathways of neurodegeneration in Parkinson’s disease. Science. 2003;302:819–822. doi: 10.1126/science.1087753. [DOI] [PubMed] [Google Scholar]
- 2.Goedert M., Spillantini M.G., Braak H. 100 years of Lewy pathology. Nat. Rev. Neurol. 2013;9:13–24. doi: 10.1038/nrneurol.2012.242. [DOI] [PubMed] [Google Scholar]
- 3.Jarrett J.T., Lansbury P.T., Jr. Seeding “one-dimensional crystallization” of amyloid: a pathogenic mechanism in Alzheimer’s disease and scrapie? Cell. 1993;73:1055–1058. doi: 10.1016/0092-8674(93)90635-4. [DOI] [PubMed] [Google Scholar]
- 4.Lashuel H.A., Overk C.R., Masliah E. The many faces of α-synuclein: from structure and toxicity to therapeutic target. Nat. Rev. Neurosci. 2013;14:38–48. doi: 10.1038/nrn3406. [DOI] [PMC free article] [PubMed] [Google Scholar]
- 5.Deleersnijder A., Gerard M., Baekelandt V. The remarkable conformational plasticity of α-synuclein: blessing or curse? Trends Mol. Med. 2013;19:368–377. doi: 10.1016/j.molmed.2013.04.002. [DOI] [PubMed] [Google Scholar]
- 6.Bendor J.T., Logan T.P., Edwards R.H. The function of α-synuclein. Neuron. 2013;79:1044–1066. doi: 10.1016/j.neuron.2013.09.004. [DOI] [PMC free article] [PubMed] [Google Scholar]
- 7.Breydo L., Wu J.W., Uversky V.N. Α-synuclein misfolding and Parkinson’s disease. Biochim. Biophys. Acta. 2012;1822:261–285. doi: 10.1016/j.bbadis.2011.10.002. [DOI] [PubMed] [Google Scholar]
- 8.Heise H., Hoyer W., Baldus M. Molecular-level secondary structure, polymorphism, and dynamics of full-length α-synuclein fibrils studied by solid-state NMR. Proc. Natl. Acad. Sci. USA. 2005;102:15871–15876. doi: 10.1073/pnas.0506109102. [DOI] [PMC free article] [PubMed] [Google Scholar]
- 9.Vilar M., Chou H.T., Riek R. The fold of α-synuclein fibrils. Proc. Natl. Acad. Sci. USA. 2008;105:8637–8642. doi: 10.1073/pnas.0712179105. [DOI] [PMC free article] [PubMed] [Google Scholar]
- 10.Brucale M., Schuler B., Samori B. Single-molecule studies of intrinsically disordered proteins. Chem. Rev. 2014;114:3281–3317. doi: 10.1021/cr400297g. [DOI] [PubMed] [Google Scholar]
- 11.Lyubchenko Y.L., Kim B.H., Yu J. Nanoimaging for protein misfolding diseases. Wiley Interdiscip. Rev. Nanomed. Nanobiotechnol. 2010;2:526–543. doi: 10.1002/wnan.102. [DOI] [PubMed] [Google Scholar]
- 12.Sandal M., Valle F., Samorì B. Conformational equilibria in monomeric α-synuclein at the single-molecule level. PLoS Biol. 2008;6:e6. doi: 10.1371/journal.pbio.0060006. [DOI] [PMC free article] [PubMed] [Google Scholar]
- 13.Brucale M., Sandal M., Samorì B. Pathogenic mutations shift the equilibria of α-synuclein single molecules towards structured conformers. ChemBioChem. 2009;10:176–183. doi: 10.1002/cbic.200800581. [DOI] [PubMed] [Google Scholar]
- 14.Hervás R., Oroz J., Carrión-Vázquez M. Common features at the start of the neurodegeneration cascade. PLoS Biol. 2012;10:e1001335. doi: 10.1371/journal.pbio.1001335. [DOI] [PMC free article] [PubMed] [Google Scholar]
- 15.Neupane K., Solanki A., Woodside M.T. Diverse metastable structures formed by small oligomers of α-synuclein probed by force spectroscopy. PLoS ONE. 2014;9:e86495. doi: 10.1371/journal.pone.0086495. [DOI] [PMC free article] [PubMed] [Google Scholar]
- 16.Trexler A.J., Rhoades E. Single molecule characterization of α-synuclein in aggregation-prone states. Biophys. J. 2010;99:3048–3055. doi: 10.1016/j.bpj.2010.08.056. [DOI] [PMC free article] [PubMed] [Google Scholar]
- 17.Ferreon A.C., Gambin Y., Deniz A.A. Interplay of α-synuclein binding and conformational switching probed by single-molecule fluorescence. Proc. Natl. Acad. Sci. USA. 2009;106:5645–5650. doi: 10.1073/pnas.0809232106. [DOI] [PMC free article] [PubMed] [Google Scholar]
- 18.Straub J.E., Thirumalai D. Toward a molecular theory of early and late events in monomer to amyloid fibril formation. Annu. Rev. Phys. Chem. 2011;62:437–463. doi: 10.1146/annurev-physchem-032210-103526. [DOI] [PMC free article] [PubMed] [Google Scholar]
- 19.Yu J., Malkova S., Lyubchenko Y.L. α-Synuclein misfolding: single molecule AFM force spectroscopy study. J. Mol. Biol. 2008;384:992–1001. doi: 10.1016/j.jmb.2008.10.006. [DOI] [PubMed] [Google Scholar]
- 20.Kim B.H., Palermo N.Y., Lyubchenko Y.L. Single-molecule atomic force microscopy force spectroscopy study of Aβ-40 interactions. Biochemistry. 2011;50:5154–5162. doi: 10.1021/bi200147a. [DOI] [PMC free article] [PubMed] [Google Scholar]
- 21.Yu J., Warnke J., Lyubchenko Y.L. Nanoprobing of α-synuclein misfolding and aggregation with atomic force microscopy. Nanomedicine (Lond.) 2011;7:146–152. doi: 10.1016/j.nano.2010.08.001. [DOI] [PubMed] [Google Scholar]
- 22.Krasnoslobodtsev A.V., Peng J., Lyubchenko Y.L. Effect of spermidine on misfolding and interactions of α-synuclein. PLoS ONE. 2012;7:e38099. doi: 10.1371/journal.pone.0038099. [DOI] [PMC free article] [PubMed] [Google Scholar]
- 23.Portillo A.M., Krasnoslobodtsev A.V., Lyubchenko Y.L. Effect of electrostatics on aggregation of prion protein Sup35 peptide. J. Phys. Condens. Matter. 2012;24:164205. doi: 10.1088/0953-8984/24/16/164205. [DOI] [PMC free article] [PubMed] [Google Scholar]
- 24.Krasnoslobodtsev A.V., Volkov I.L., Lyubchenko Y.L. α-Synuclein misfolding assessed with single molecule AFM force spectroscopy: effect of pathogenic mutations. Biochemistry. 2013;52:7377–7386. doi: 10.1021/bi401037z. [DOI] [PMC free article] [PubMed] [Google Scholar]
- 25.Lv Z., Condron M.M., Lyubchenko Y.L. Nanoprobing of the effect of Cu2+ cations on misfolding, interaction and aggregation of amyloid β peptide. J. Neuroimmune Pharmacol. 2013;8:262–273. doi: 10.1007/s11481-012-9416-6. [DOI] [PMC free article] [PubMed] [Google Scholar]
- 26.Lv Z., Roychaudhuri R., Lyubchenko Y.L. Mechanism of amyloid β-protein dimerization determined using single-molecule AFM force spectroscopy. Sci. Rep. 2013;3:2880. doi: 10.1038/srep02880. [DOI] [PMC free article] [PubMed] [Google Scholar]
- 27.Shlyakhtenko L.S., Gall A.A., Lyubchenko Y.L. Mica functionalization for imaging of DNA and protein-DNA complexes with atomic force microscopy. Methods Mol. Biol. 2013;931:295–312. doi: 10.1007/978-1-62703-056-4_14. [DOI] [PMC free article] [PubMed] [Google Scholar]
- 28.Kim B.H., Lyubchenko Y.L. Nanoprobing of misfolding and interactions of amyloid β 42 protein. Nanomedicine (Lond.) 2014;10:871–878. doi: 10.1016/j.nano.2013.11.016. [DOI] [PMC free article] [PubMed] [Google Scholar]
- 29.Lovas S., Zhang Y., Lyubchenko Y.L. Molecular mechanism of misfolding and aggregation of Aβ(13–23) J. Phys. Chem. B. 2013;117:6175–6186. doi: 10.1021/jp402938p. [DOI] [PMC free article] [PubMed] [Google Scholar]
- 30.Zheng Q., Juette M.F., Blanchard S.C. Ultra-stable organic fluorophores for single-molecule research. Chem. Soc. Rev. 2014;43:1044–1056. doi: 10.1039/c3cs60237k. [DOI] [PMC free article] [PubMed] [Google Scholar]
- 31.Lee H.W., Kyung T., Yoon T.Y. Real-time single-molecule co-immunoprecipitation analyses reveal cancer-specific Ras signalling dynamics. Nat. Commun. 2013;4:1505. doi: 10.1038/ncomms2507. [DOI] [PMC free article] [PubMed] [Google Scholar]
- 32.Lamboy J.A., Kim H., Komives E.A. Visualization of the nanospring dynamics of the IκBα ankyrin repeat domain in real time. Proc. Natl. Acad. Sci. USA. 2011;108:10178–10183. doi: 10.1073/pnas.1102226108. [DOI] [PMC free article] [PubMed] [Google Scholar]
- 33.Roy R., Hohng S., Ha T. A practical guide to single-molecule FRET. Nat. Methods. 2008;5:507–516. doi: 10.1038/nmeth.1208. [DOI] [PMC free article] [PubMed] [Google Scholar]
- 34.Bayas M.V., Leung A., Leckband D. Lifetime measurements reveal kinetic differences between homophilic cadherin bonds. Biophys. J. 2006;90:1385–1395. doi: 10.1529/biophysj.105.069583. [DOI] [PMC free article] [PubMed] [Google Scholar]
- 35.Karymov M.A., Krasnoslobodtsev A.V., Lyubchenko Y.L. Dynamics of synaptic SfiI-DNA complex: single-molecule fluorescence analysis. Biophys. J. 2007;92:3241–3250. doi: 10.1529/biophysj.106.095778. [DOI] [PMC free article] [PubMed] [Google Scholar]
- 36.Tinoco I., Jr., Bustamante C. The effect of force on thermodynamics and kinetics of single molecule reactions. Biophys. Chem. 2002;101-102:513–533. doi: 10.1016/s0301-4622(02)00177-1. [DOI] [PubMed] [Google Scholar]
- 37.Powell L.R., Dukes K.D., Lammi R.K. Probing the efficacy of peptide-based inhibitors against acid- and zinc-promoted oligomerization of amyloid-β peptide via single-oligomer spectroscopy. Biophys. Chem. 2012;160:12–19. doi: 10.1016/j.bpc.2011.08.006. [DOI] [PMC free article] [PubMed] [Google Scholar]
- 38.Zheng Q., Jockusch S., Blanchard S.C. On the mechanisms of cyanine fluorophore photostabilization. J. Phys. Chem. Lett. 2012;3:2200–2203. doi: 10.1021/jz300670p. [DOI] [PMC free article] [PubMed] [Google Scholar]
- 39.Shlyakhtenko L.S., Gilmore J., Lyubchenko Y.L. Molecular mechanism underlying RAG1/RAG2 synaptic complex formation. J. Biol. Chem. 2009;284:20956–20965. doi: 10.1074/jbc.M109.028977. [DOI] [PMC free article] [PubMed] [Google Scholar]
- 40.Ahmad B., Chen Y., Lapidus L.J. Aggregation of α-synuclein is kinetically controlled by intramolecular diffusion. Proc. Natl. Acad. Sci. USA. 2012;109:2336–2341. doi: 10.1073/pnas.1109526109. [DOI] [PMC free article] [PubMed] [Google Scholar]
- 41.Dedmon M.M., Lindorff-Larsen K., Dobson C.M. Mapping long-range interactions in α-synuclein using spin-label NMR and ensemble molecular dynamics simulations. J. Am. Chem. Soc. 2005;127:476–477. doi: 10.1021/ja044834j. [DOI] [PubMed] [Google Scholar]
- 42.Bertoncini C.W., Jung Y.S., Zweckstetter M. Release of long-range tertiary interactions potentiates aggregation of natively unstructured α-synuclein. Proc. Natl. Acad. Sci. USA. 2005;102:1430–1435. doi: 10.1073/pnas.0407146102. [DOI] [PMC free article] [PubMed] [Google Scholar]
- 43.Cao P., Abedini A., Raleigh D.P. Aggregation of islet amyloid polypeptide: from physical chemistry to cell biology. Curr. Opin. Struct. Biol. 2013;23:82–89. doi: 10.1016/j.sbi.2012.11.003. [DOI] [PMC free article] [PubMed] [Google Scholar]
- 44.Pandey A.P., Haque F., Hovis J.S. α-Synuclein-induced tubule formation in lipid bilayers. J. Phys. Chem. B. 2011;115:5886–5893. doi: 10.1021/jp1121917. [DOI] [PMC free article] [PubMed] [Google Scholar]
- 45.Haque F., Pandey A.P., Hovis J.S. Adsorption of α-synuclein on lipid bilayers: modulating the structure and stability of protein assemblies. J. Phys. Chem. B. 2010;114:4070–4081. doi: 10.1021/jp1006704. [DOI] [PMC free article] [PubMed] [Google Scholar]
- 46.Selkoe D., Dettmer U., Bartels T. Defining the native state of α-synuclein. Neurodegener. Dis. 2014;13:114–117. doi: 10.1159/000355516. [DOI] [PubMed] [Google Scholar]
- 47.Fauvet B., Mbefo M.K., Lashuel H.A. α-Synuclein in central nervous system and from erythrocytes, mammalian cells, and Escherichia coli exists predominantly as disordered monomer. J. Biol. Chem. 2012;287:15345–15364. doi: 10.1074/jbc.M111.318949. [DOI] [PMC free article] [PubMed] [Google Scholar]
- 48.Burre J., Vivona S., Sudhof T.C. Properties of native brain α-synuclein. Nature. 2013;498:E4–E6. doi: 10.1038/nature12125. discussion E6–E7. [DOI] [PMC free article] [PubMed] [Google Scholar]
- 49.Cremades N., Cohen S.I., Klenerman D. Direct observation of the interconversion of normal and toxic forms of α-synuclein. Cell. 2012;149:1048–1059. doi: 10.1016/j.cell.2012.03.037. [DOI] [PMC free article] [PubMed] [Google Scholar]
- 50.Krishnan S., Chi E.Y., Carpenter J.F. Oxidative dimer formation is the critical rate-limiting step for Parkinson’s disease α-synuclein fibrillogenesis. Biochemistry. 2003;42:829–837. doi: 10.1021/bi026528t. [DOI] [PubMed] [Google Scholar]
- 51.Pivato M., De Franceschi G., Bubacco L. Covalent α-synuclein dimers: chemico-physical and aggregation properties. PLoS ONE. 2012;7:e50027. doi: 10.1371/journal.pone.0050027. [DOI] [PMC free article] [PubMed] [Google Scholar]
- 52.Roostaee A., Beaudoin S., Roucou X. Aggregation and neurotoxicity of recombinant α-synuclein aggregates initiated by dimerization. Mol. Neurodegener. 2013;8:5. doi: 10.1186/1750-1326-8-5. [DOI] [PMC free article] [PubMed] [Google Scholar]
- 53.Conway K.A., Harper J.D., Lansbury P.T. Accelerated in vitro fibril formation by a mutant α-synuclein linked to early-onset Parkinson disease. Nat. Med. 1998;4:1318–1320. doi: 10.1038/3311. [DOI] [PubMed] [Google Scholar]
- 54.Greenbaum E.A., Graves C.L., Giasson B.I. The E46K mutation in α-synuclein increases amyloid fibril formation. J. Biol. Chem. 2005;280:7800–7807. doi: 10.1074/jbc.M411638200. [DOI] [PubMed] [Google Scholar]
- 55.Conway K.A., Lee S.J., Lansbury P.T., Jr. Acceleration of oligomerization, not fibrillization, is a shared property of both α-synuclein mutations linked to early-onset Parkinson’s disease: implications for pathogenesis and therapy. Proc. Natl. Acad. Sci. USA. 2000;97:571–576. doi: 10.1073/pnas.97.2.571. [DOI] [PMC free article] [PubMed] [Google Scholar]
- 56.Li J., Uversky V.N., Fink A.L. Effect of familial Parkinson’s disease point mutations A30P and A53T on the structural properties, aggregation, and fibrillation of human α-synuclein. Biochemistry. 2001;40:11604–11613. doi: 10.1021/bi010616g. [DOI] [PubMed] [Google Scholar]
- 57.Paslawski W., Mysling S., Otzen D.E. Co-existence of two different α-synuclein oligomers with different core structures determined by hydrogen/deuterium exchange mass spectrometry. Angew. Chem. Int. Ed. Engl. 2014;53:7560–7563. doi: 10.1002/anie.201400491. [DOI] [PubMed] [Google Scholar]
- 58.Liu F., Hindupur J., Rochet J.C. Methionine sulfoxide reductase A protects dopaminergic cells from Parkinson’s disease-related insults. Free Radic. Biol. Med. 2008;45:242–255. doi: 10.1016/j.freeradbiomed.2008.03.022. [DOI] [PMC free article] [PubMed] [Google Scholar]
- 59.Swomley A.M., Förster S., Butterfield D.A. Aβ, oxidative stress in Alzheimer disease: evidence based on proteomics studies. Biochim. Biophys. Acta. 2014;1842:1248–1257. doi: 10.1016/j.bbadis.2013.09.015. [DOI] [PMC free article] [PubMed] [Google Scholar]
- 60.Stone D.K., Kiyota T., Gendelman H.E. A model of nitric oxide induced α-synuclein misfolding in Parkinson’s disease. Neurosci. Lett. 2012;523:167–173. doi: 10.1016/j.neulet.2012.06.070. [DOI] [PMC free article] [PubMed] [Google Scholar]
- 61.Lapidus L.J. Understanding protein aggregation from the view of monomer dynamics. Mol. Biosyst. 2013;9:29–35. doi: 10.1039/c2mb25334h. [DOI] [PMC free article] [PubMed] [Google Scholar]
- 62.Rabe M., Soragni A., Seeger S. On-surface aggregation of α-synuclein at nanomolar concentrations results in two distinct growth mechanisms. ACS Chem. Neurosci. 2013;4:408–417. doi: 10.1021/cn3001312. [DOI] [PMC free article] [PubMed] [Google Scholar]
- 63.Altman R.B., Terry D.S., Blanchard S.C. Cyanine fluorophore derivatives with enhanced photostability. Nat. Methods. 2012;9:68–71. doi: 10.1038/nmeth.1774. [DOI] [PMC free article] [PubMed] [Google Scholar]
Associated Data
This section collects any data citations, data availability statements, or supplementary materials included in this article.